Bulletin – June 2011 Banking Fees in Australia
- Download the article 337KB
Abstract
The Reserve Bank has conducted a survey on bank fees each year since 1997. The results of the latest survey show that banks' aggregate fee income was unchanged in 2010. Fee income from households declined as exception fee income and ATM revenue fell sharply, while fee income from businesses grew.
Fees from Banking Activities
The Reserve Bank's annual bank fee survey provides information on the fees that commercial banks earn from their Australian operations.[1] It focuses on fee income earned by banks in the process of taking deposits, making loans and providing payment services. Other forms of non-interest income, such as income earned from funds management and insurance operations, are excluded from the survey. This article summarises the results of the latest survey, relating to banks' 2010 financial year. It covers 17 institutions, which together account for around 90 per cent of the total assets of the Australian banking sector.
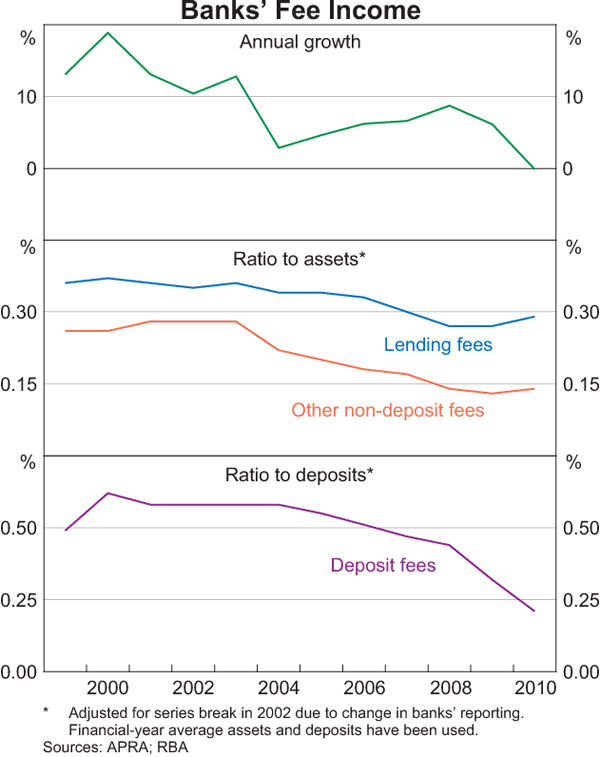
Total domestic fee income in 2010 was unchanged at $11.1 billion from a year earlier, the first time that total fee income has not risen since the survey began in 1997 (Graph 1 and Table 1). This aggregate outcome reflects differing developments, including:
- a decline in fee income from households;
- an increase in fee income from businesses;
- slower growth in fee income from loans, reflecting the slower pace of expansion in banks' lending to businesses and households; and
- a continued decline in deposit fee income despite strong growth in deposits.

| Households | Businesses | Total | ||||||
|---|---|---|---|---|---|---|---|---|
| $ million | Growth Per cent |
$ million | Growth Per cent |
$ million | Growth Per cent |
|||
| 2008 | 5,008 | 11 | 5,503 | 7 | 10,511 | 9 | ||
| 2009 | 5,081 | 1 | 6,077 | 10 | 11,158 | 6 | ||
| 2010 | 4,247 | −16 | 6,897 | 13 | 11,144 | 0 | ||
|
Source: RBA |
||||||||
Households
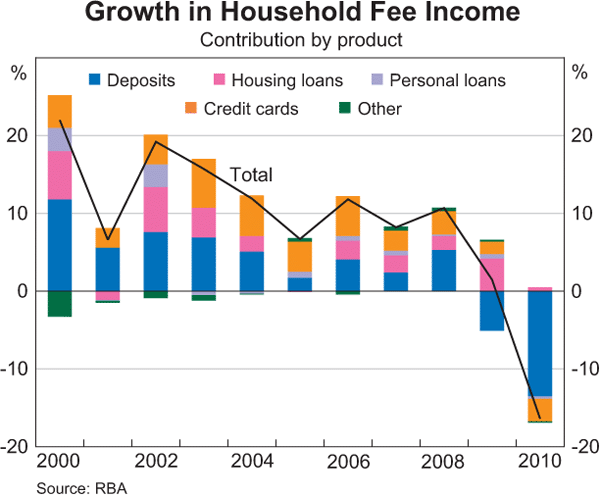
Banks' fee income from households declined by 16 per cent in 2010, to $4.2 billion (Graph 2 and Table 2). This was its lowest level since 2006. Almost 80 per cent of the decline can be attributed to exception fees. A number of banks reduced, and in some cases abolished, exception fees in late 2009, such that income from these fees roughly halved in 2010 (Table 3).

| 2008 | 2009 | 2010 | Growth 2010 |
Average growth 2004–2009 |
|||
|---|---|---|---|---|---|---|---|
| $ million | Per cent | Per cent | |||||
| Loans: | >|||||||
| – Housing | 1,076 | 1,286 | 1,313 | 2 | 9 | ||
| – Personal | 300 | 331 | 317 | −4 | 9 | ||
| – Credit cards | 1,332 | 1,413 | 1,263 | −11 | 13 | ||
| Deposits | 2,193 | 1,935 | 1,247 | −36 | 3 | ||
| Other fees | 107 | 115 | 106 | −7 | 11 | ||
| Total | 5,008 | 5,081 | 4,247 | −16 | 8 | ||
|
Source: RBA |
|||||||
| 2008 | 2009 | 2010 | Growth | ||
|---|---|---|---|---|---|
| $ million | Per cent | ||||
| Deposit accounts | 701 | 688 | 293 | −57 | |
| Loans | 481 | 603 | 359 | −40 | |
| – Housing | 29 | 50 | 33 | −33 | |
| – Personal | 26 | 32 | 24 | −23 | |
| – Credit cards | 427 | 521 | 301 | −42 | |
| Total | 1,183 | 1,291 | 652 | −49 | |
|
Source: RBA |
|||||
Exception fees are charged when a customer breaches the terms of a banking product, typically overdrawing a deposit account, making a late payment or exceeding a credit limit. Around 80 per cent of exception fees are paid by households. Exception fee income associated with household deposit accounts fell by $395 million in 2010, or 57 per cent. Exception fee income from household credit cards fell by $220 million, accounting for more than the entire decline in credit card fees from the household sector. Exception fees on housing loans also declined, despite an increase in the share of housing loans that are non-performing.
Another significant driver of the decline in banks' fee income from household deposit accounts was a decline in revenue from ATMs. The ATM reforms introduced in March 2009 have led to a marked shift in transactions away from ‘foreign’ ATMs towards the use of cardholders' own institutions' ATMs, which are generally free of charge. In addition, households have reduced their overall ATM usage in favour of using EFTPOS transactions, which are also typically free of charge, to obtain cash (Flood, Hancock and Smith 2011). Deposit fee income has also been under downward pressure over recent years as banks have introduced and expanded deposit products that waive account fees if the account holder makes regular deposits of funds – such as regular salary payments – above a given threshold.
Total fee income from housing loans increased by 2 per cent in 2010, below the rate of growth of housing credit of 8 per cent. While exception fee income from housing loans declined by 33 per cent, other fee income rose by 3½per cent. Account servicing fee income was boosted by the increase in the stock of housing credit, although the lower level of housing loan approvals contributed to reduced establishment fee income for some banks. There was also a decline in income from break fees; these are charged by banks when a fixed-rate loan is terminated early, as the bank incurs costs in exiting the swap transactions that they undertake to hedge the interest rate risk involved in extending fixed-rate loans. This decline occurred because fewer customers refinanced from a fixed-rate to a variable-rate housing loan; this refinancing activity had picked up significantly in the previous financial year in response to lower variable mortgage rates, but declined in 2010 as mortgage rates increased again.
Fee income from personal lending, excluding exception fees, fell by around 2 per cent, broadly in line with the fall in the stock of personal credit. Credit card fee income rose by 5 per cent (excluding exception fees). Credit card account servicing fee income rose slightly, driven by a small increase in the number of cards and an increase in the annual fees on some credit cards (Table 4). Transaction fee income (arising from items such as cash advance fees) increased by 2 per cent from the previous survey.
| 2008 | 2009 | 2010 | Growth | ||
|---|---|---|---|---|---|
| Per cent | |||||
| Annual fees ($)(b) | |||||
| – No-frills cards | 49 | 52 | 53 | 1 | |
| – Standard cards | 29 | 29 | 29 | 0 | |
| – Standard rewards-based cards | 80 | 80 | 80 | 0 | |
| – Gold rewards-based cards | 140 | 140 | 151 | 8 | |
| Cash advance fees(c) | |||||
| Own banks' ATMs ($) | 1.35 | 1.23 | 1.06 | −13 | |
| – Per cent of value | 1.3 | 1.6 | 1.8 | 8 | |
| Other banks' ATMs ($) | 1.63 | 1.38 | 1.06 | −23 | |
| – Per cent of value | 1.6 | 1.6 | 1.8 | 8 | |
| Overseas ATMs ($) | 3.63 | 3.63 | 3.63 | 0 | |
| – Per cent of value | 1.6 | 1.7 | 1.7 | 0 | |
| Foreign currency conversion fee (Per cent of value) | 2.5 | 2.6 | 2.6 | 0 | |
| Late payment fee ($) | 31 | 31 | 15 | −53 | |
| Over-limit fee ($)(d) | 30 | 30 | 14 | −55 | |
|
(a) Simple average of fees for credit cards with interest-free periods
issued by major banks, except for the annual fee on no-frills cards, which
is based on a wider sample of banks. Note that changes in the sample affect
the average fee. Sources: RBA; credit card issuers' websites |
|||||
Businesses
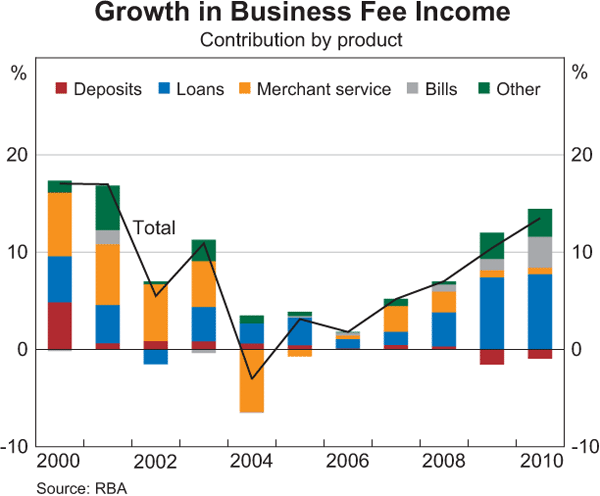
Banks' fee income from businesses increased by 13 per cent in 2010 to $6.9 billion, despite business credit outstanding falling over the year (Table 5 and Graph 3). Most of the growth in business fee income was driven by growth in fees from lending, including both loans and bank bill facilities; total lending fee income grew by about 25 per cent. This largely reflects the repricing of establishment and line fees, which are charged by banks to maintain a line of credit regardless of use. Bank bill fee income reported in the 2010 survey has been adjusted to align it with the banks' statutory reports. In particular, bank bill fee income included in banks' interest income in their statutory reports is no longer recorded as fees; as a result, previous years' figures have been revised down.
| 2008 | 2009 | 2010 | Growth 2010 |
Average growth 2004–2009 |
|||
|---|---|---|---|---|---|---|---|
| $ million | Per cent | Per cent | |||||
| Deposit accounts | 855 | 768 | 711 | −7 | −1 | ||
| – of which: exception fees | 131 | 122 | 59 | −51 | na | ||
| Loans | 1,859 | 2,266 | 2,737 | 21 | 10 | ||
| – of which: exception fees | 72 | 75 | 53 | −30 | na | ||
| Merchant service fees | 1,743 | 1785 | 1,824 | 2 | 3 | ||
| Bank bills | 314 | 377 | 574 | 52 | 8 | ||
| Other | 732 | 880 | 1,051 | 19 | 6 | ||
| Total | 5,503 | 6,077 | 6,897 | 13 | 5 | ||
| – of which: exception fees | 203 | 197 | 112 | −43 | na | ||
|
Source: RBA |
|||||||

Business deposit fee income declined by 7 per cent as a result of reduced exception fees. Small businesses benefited most from this, because they pay around 85 per cent of business exception fees.
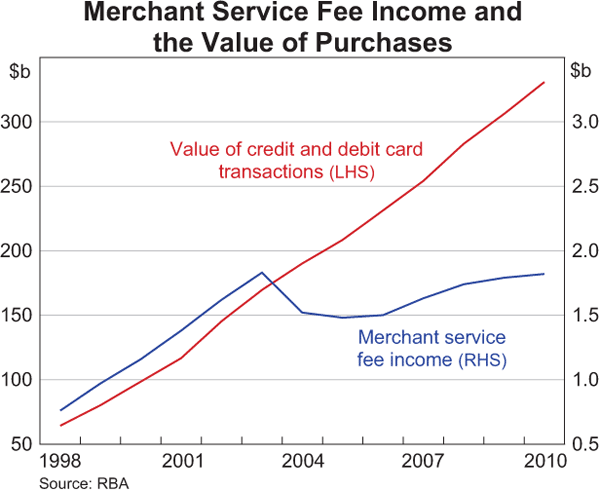
Merchant service fee income – which is derived from providing merchants with credit and debit card transaction services – rose by 2 per cent in 2010 (Graph 4). Since the introduction of the Reserve Bank's credit card interchange reforms in 2003, total merchant service fee income has changed little in net terms despite the value of card transactions having nearly doubled. This largely reflects the decline in merchant service fees on credit cards as a share of the value of transactions; for example, the average merchant service fee paid for transactions on MasterCard and Visa credit cards fell by 60 basis points over this period to about 80 basis points. Small businesses continue to pay around three-quarters of all merchant service fees.

Footnote
The survey relates to fee income earned by participating banks over the course of their respective financial years. The data from the survey are published on the Reserve Bank's website: Statistical Table F6, ‘Domestic Banking Fee Income’. There have been a number of amendments to the historical data. The main changes stem from revisions to bank bill fee income, particularly acceptance fees, to align their treatment more closely with that in banks' statutory accounts, and reclassifications by one bank of some of its household loan and deposit fees. [1]
Reference
Flood D, J Hancock and K Smith (2011), ‘The ATM Reforms – New Evidence from Survey and Market Data’, RBA Bulletin, March, pp 43–49.