Speech The Evolving Australian Labour Market

Alexandra Heath[*]
Head of Economic Analysis Department
Business Educators Australasia 2018 Biennial Conference
Canberra –
Much has been said about the structural changes underway in the labour market that are redefining the nature of work. Previously, I have talked about changes in demand for different types of skills in the workforce, noting that an increasing share of today's jobs are non-routine in nature, partly because technological changes have allowed more routine tasks to be automated.[1] Another aspect of the labour market that has evolved over time is the flexibility of work. Flexibility in the labour market comes in many different forms. For example, it might mean being able to work less than full time, or not having to work between 9.00 am and 5.00 pm every day.
Today, I'm going to talk about the long-running trend towards more flexible work and the implications it might have for a monetary policymaker. I'll start like a true economist and document some facts. What can we say about the nature of flexible work in the Australian economy and how this has changed over time? Given the data we have available and the time I have today, I will mainly focus on part-time work. There are other important dimensions of work flexibility, such as the emergence of the gig economy and the implications of more flexible labour markets for job security, that I will only touch on briefly.
The data show that part-time work and other flexible work arrangements have become more prevalent over time. For many people flexible work provides an opportunity to work and manage other commitments like study or caring responsibilities. Overall, it appears that people are working hours that are closer to their preferred hours than in the past.
But for others, part-time work is less of a choice. There are still underemployed people who would like to work more hours and who represent spare capacity in the labour market. There are also people who are not actively looking for work but might take on a job if the right one presented itself who are recorded as not being in the labour force. This suggests that the pool of unemployed is not the only source of spare capacity in the labour market. The key question for monetary policy is whether the increased availability of flexible work arrangements has changed the nature of spare capacity in the labour market and/or the sensitivity of spare capacity to changes in economic conditions. To summarise this discussion, I'll talk about developments in our understanding of underemployment and the participation rate over the past couple of years and how our analysis of these developments has helped to inform monetary policy.
Flexible Work in Australia
What kinds of flexible work are common?
Most workers report that their workplace provides access to carers leave and permanent part-time employment (Graph 1). Over half report that they have access to flexible hours. More than half of workers report that their workplace provides paid maternity leave, which is up from less than 40 per cent in 2002, and about one-third report that they can work from home, which is up from about 20 per cent.[2]
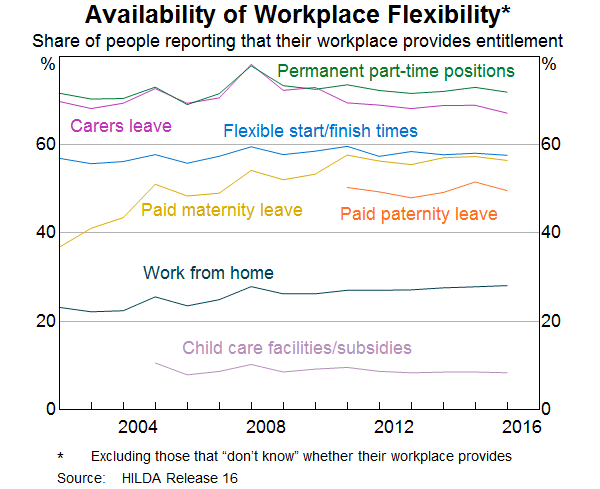
From the perspective of business, most large employers in Australia report that they offer some sort of flexible working hours to their staff, and that flexible work arrangements have become more prevalent over time. More than two-thirds of these businesses offer the ability to purchase additional leave or take leave without pay, and a similar share offer paid parental leave. It has also been quite common for these businesses to offer some form of flexible hours and the option of working from home. It is worth noting that flexible work options are generally less available at smaller businesses.
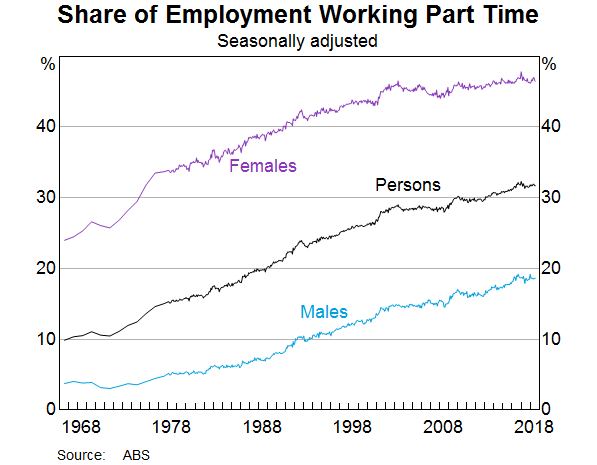
A longer-run perspective on flexibility can be obtained by looking at how the share of part-time work has changed in the economy over time (Graph 2). Part-time workers, who work less than 35 hours per week by definition, have become a more important share of total employment for at least the past half century. Today around one in three employed people work part time, compared with one in ten 50 years ago.
Who works part time?
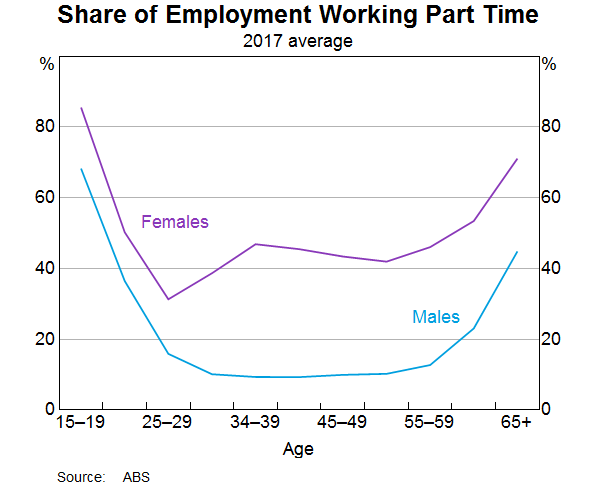
A striking feature of these trends is that part-time work has always been more prevalent for females than males. This is still apparent when we look at the importance of part-time work for different age groups (Graph 3). However, looking at things this way reveals that the experience of females and males really changes after the age of 30 years: women tend to increase their use of part-time employment as they progress through child-raising years but men do not. This graph also emphasises that part-time work is much more common for younger workers and those nearing retirement age.
So which groups have contributed most to the fact that part-time employment is more than three times more common today as it was 50 years ago? The biggest contribution to this increase has come from the rise in the share of young people, both male and female, working part time (Graph 4).[3] In 1966, about one in 15 younger workers was employed part time; today, more than half are. The increase in the share of part-time work for older men, particularly those between the ages of 25 and 54 years, has also contributed to the overall increase in part-time employment.
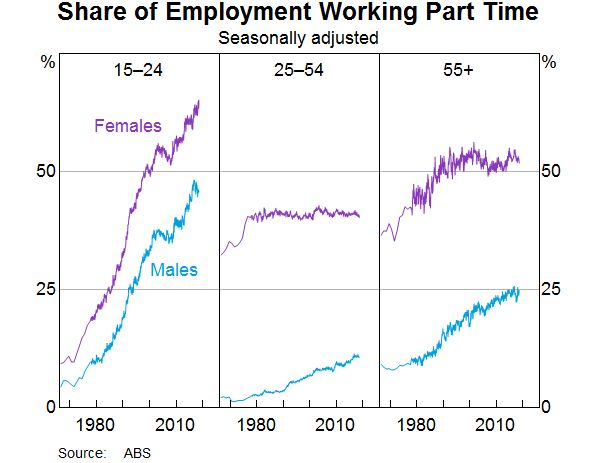
The story for women over the age of 24 years, however, is a little bit different. They too have contributed to the overall increase in the share of part-time workers, although the share of part-time work for this group has been remarkably stable. The reconciling factor is that the participation of women older than 25 years in the formal workforce has doubled from around 30 per cent in 1966 to around 60 per cent today. Although many women have benefited from the increased availability of part-time work, there has been a roughly equal percentage increase in women with full-time jobs. This highlights that other factors, such as increased access to tertiary education, have also had significant effects on the labour force outcomes of women.[4]
Why do people work part time?
The next question that naturally flows from these graphs, is why? The Household Income and Labour Dynamics Australia (HILDA) survey is one of the main sources we have for understanding the behaviour of households. This survey shows that around 20 per cent of women and almost 30 per cent of men indicate they are working part time because they could not find full-time work or because of job requirements (Graph 5). Working part time because the job requires it has become a more important factor over time, particularly for men.
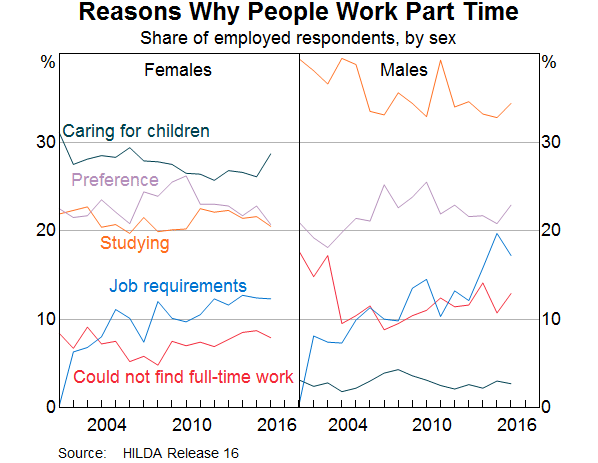
That leaves around three-quarters of part-time workers reporting that they are doing so because they choose to, or because it helps them combine work with other responsibilities. Older workers are most likely to report they are working part time because it is their preference.
The majority of young part-time workers indicate that their main motivation is that part-time work allows them to combine paid work with study.[5] The increase in young people working part time has occurred at the same time as a significant increase in the participation of young people in full-time education. Just over three-quarters of 15–19 year olds and around one-third of 20–24 year olds are now enrolled in full-time study. This is up from one-half and 10 per cent, respectively, in the mid 1980s. The high incidence of full-time students working part time means that Australia has the fourth highest labour force participation rate for younger workers in the OECD.
For people aged between 25 and 54 years, and women in particular, it has been common for part-time employment to be a way of maintaining connection to the workforce during a period in which they take primary responsibility for the care of dependent children. Indeed, caring for young children or elderly relatives is among the more common reasons for households to desire flexibility in their work arrangements.
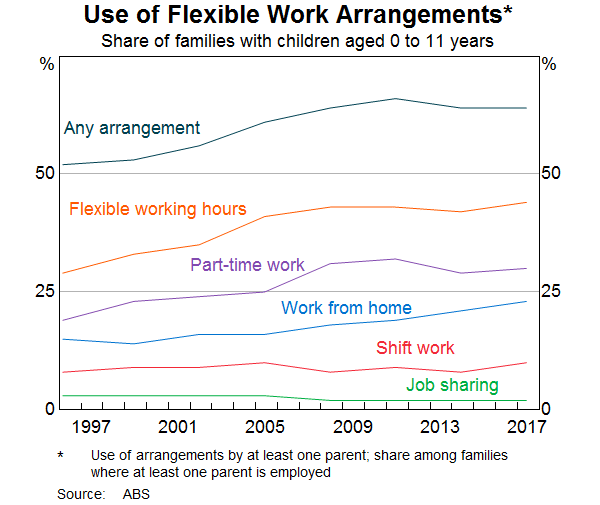
The relationship between child care responsibilities and part-time work is complex; some parents may choose to work part-time hours to spend more time caring for children, whereas other parents may prefer additional or full-time hours but are unable to find or afford adequate child care arrangements. Household survey data from the ABS show that almost one-third of families with young children have at least one parent in part-time work (Graph 6). Around two-fifths of households with dependent children rely on flexible working hours. Families with children have increasingly used all forms of flexibility over recent decades.
Demand or supply?
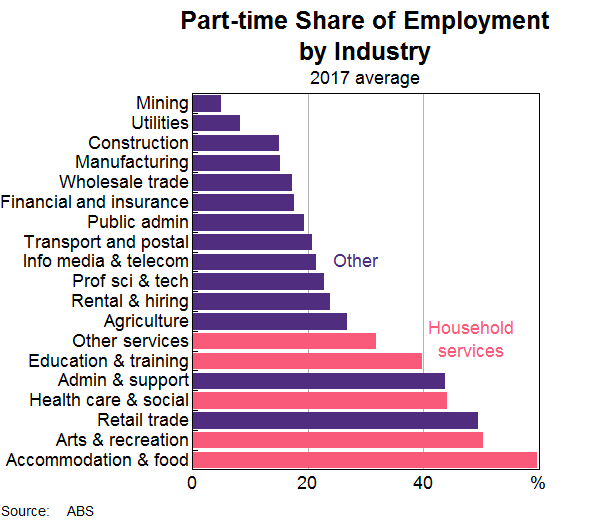
It seems that many people would like to work part time or flexibly in some way, and the opportunities to do so have increased over time. Some industries have embraced flexible work arrangements more than others. In particular, businesses in the household services sector, such as those in health, education, tourism and hospitality, have relatively high shares of part-time workers and have also had relatively strong employment growth (Graph 7). Conversations we have with firms across the country as a part of our business liaison program have also increasingly reported that part-time and casual employment are being used to improve the flexibility of their business models.
Given that both households and firms have sought increased flexibility, it begs the question whether the increase in flexibility has been primarily demand or supply driven? Of course, the answer is likely to be that it has been driven by both. Another important but slightly different question that is beyond the scope of my comments today is whether the increase in flexibility has benefited individuals and firms equally.
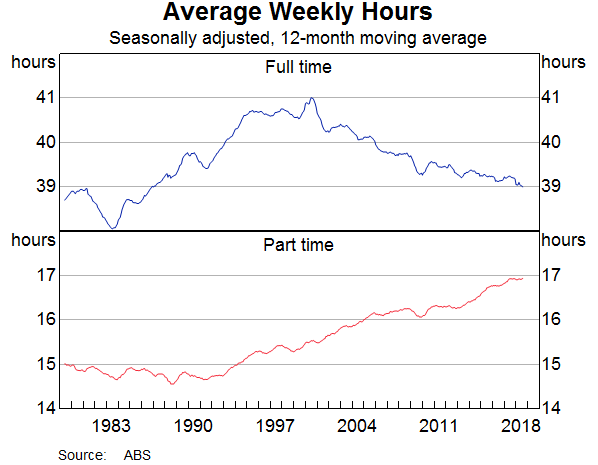
We can see that the hours worked by part-time and full-time employees have changed over time. Back in the late 1980s, the average part-time worker worked around 14½ hours per week, but more recently that figure has risen to around 17 hours per week (Graph 8). The opposite trend is apparent for full-time workers, who are classified as those who work 35 hours or more. Average full-time hours have declined from around 41 hours per week in the early 2000s to around 39 hours per week today. Taking both groups together, people are tending to work fewer hours than they used to.
One way to approach the question of whether these change have been beneficial to employees is to look at whether people report they are closer to working the hours they want to work than in the past. Before looking at this in detail, I'm going to make a quick detour to look at what we know about how other conditions of employment have changed.
There are plenty of anecdotes about how employment conditions have changed with the arrival of the gig economy and other forms of more flexible work, but it is remarkably hard to find evidence of these changes in the aggregate data we have available. For example, casual employees, who do not have access to things like paid sick leave and holiday pay, make up a sizeable share of the workforce of around 20 per cent, but this share has been relatively stable since the 1990s. So over this period the rise in part-time work has not been accompanied by a rise in casualisation. Another possible manifestation of more flexible, but less secure work is that people who might have once been employees are now operating as independent contractors. However, ABS and HILDA data suggest that over the past decade there has been a decline in independent contractors as a share of total employment. However, rather than conclude that there is nothing happening along these dimensions, I think the message is that this is an area where more work needs to be done.
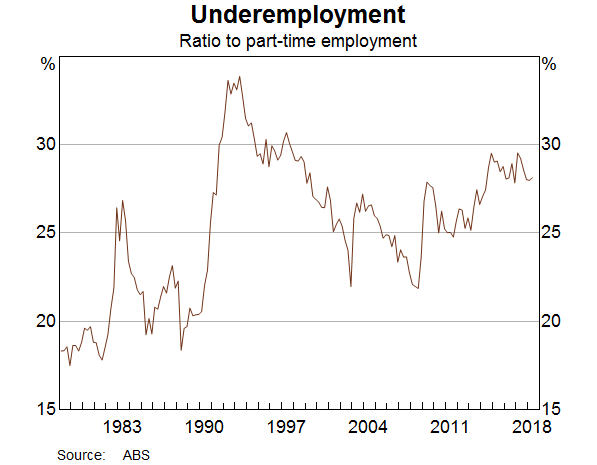
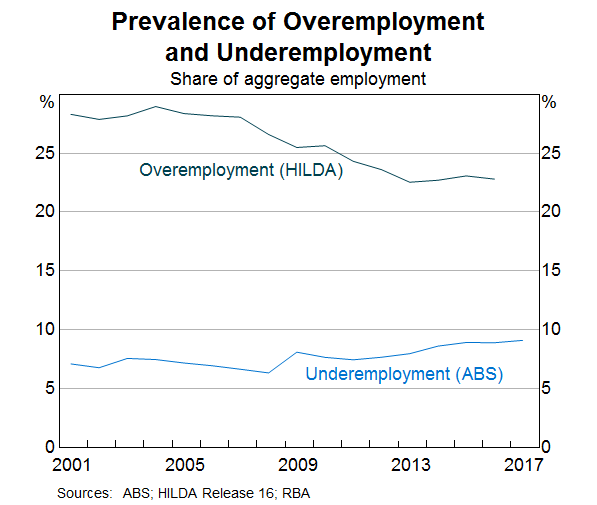
Returning to the question of whether people report they are closer to working the hours they would like to than in the past, the ABS measure of underemployment predominately reflects part-time workers that would prefer more hours and are available to do so. Underemployment has risen both as a share of part-time employment, and as a share of the broader labour force, since the 1970s (Graph 9). Underemployment also has a strong cyclical element that I will return to later.
At the same time as underemployment has risen, the HILDA survey shows there has been a decline in the share of employed people who would prefer to work fewer hours, the ‘overemployed’, taking into account that this would affect their income (Graph 10). This downward trend is consistent with the decline in average full-time hours worked since the turn of the century. Unsurprisingly, overemployment is most common among those who work relatively long hours, including the substantial share of the workforce who usually work more than 50 hours per week. As an aside that might be of interest to the current audience, over one-third of teachers reported that they were overemployed in 2007.[6] Often the overemployed report that they would like to reduce their working hours so they could spend more time with their family.
The HILDA data also allow us to compare workers' actual and preferred hours in aggregate. A decade ago, the average employed person in Australia would have preferred to work two hours less than they usually did. This is because there were many more workers who reported themselves as overemployed, relative to those who reported they were underemployed. By 2016, the mismatch between usual and preferred hours had declined to one hour, suggesting that workers are now closer on average to their preferred hours. This is evidence that, on balance, quite a bit of the change in working arrangements over the past two decades has suited employees.
Cyclical Adjustment in the Labour Market
From a monetary policy perspective, these trends are interesting, but what really matters is whether they have any implications for how the labour market adjusts to changes in the economic cycle and how we forecast wages growth.
In the textbook labour market, the unemployment rate summarises spare capacity.[7] As demand for labour increases, unemployed people find jobs and can choose the hours they want given their productivity levels and the value of what they are doing when they are not working in the formal labour force. However, in practice, especially given the increase in the availability of flexible work arrangements, stronger labour demand can be met in a range of different ways. A firm can still employ someone looking for work, but can also increase the hours of existing workers, or employ people outside the labour force. Some people outside the labour force are not actively looking for work, but might start working if the right job comes along.
This complexity means that monetary policymakers need to take a broader perspective than just looking at the unemployment rate when assessing how much spare capacity there is in the labour market and how it is likely to change in response to changes in economic conditions. Although the unemployment rate continues to be an integral part of the monetary policy discussion, we have been asking whether the unemployment rate is sufficient to explain developments in spare capacity in our search for an explanation of why wages growth has been so low. Another consideration for our forecasts and our assessment of the uncertainties around them is whether the participation rate has become more responsive to changes in economic conditions over time.
To elaborate, I will first talk about the cyclical adjustment of the underemployment rate and then turn to the participation rate.
Underemployment
A bit earlier, I noted that there was a strong cyclical element to the share of part-time workers who were underemployed; the share tends to increase when labour demand is weak and the unemployment rate is increasing. This is related to the way employment adjusts to changes in economic conditions. Over the past twenty years or so, full-time and part-time employment have tended to grow at a similar pace during periods of robust economic growth, such as the mid 2000s (Graph 11). However, during slowdowns in growth that lead to an increase in the unemployment rate, shown here in the shaded bars, full-time employment tends to fall and growth in part-time employment actually increases.
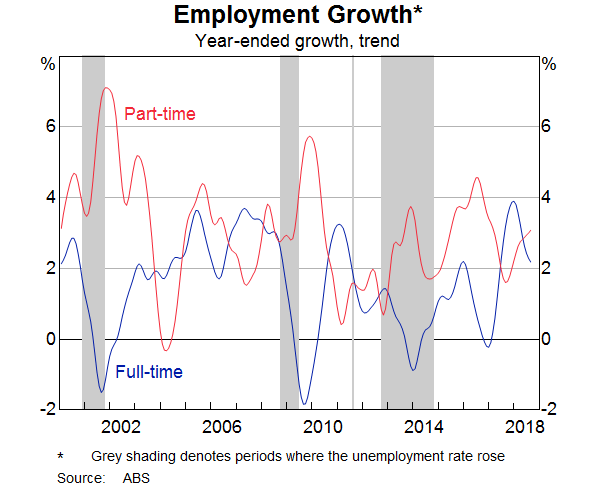
Analysis by some of my colleagues at the RBA has shown that since the late 1990s in Australia, more cyclical adjustment in the labour market has occurred through changing the hours that people work than changing the number of people who are employed.[8] One consequence of this is that during the economic downturns in the 2000s, the unemployment rate rose by less than would have been expected on the basis of historical relationships. The ability of the labour market to adjust in this way is a positive consequence of having more labour market flexibility.
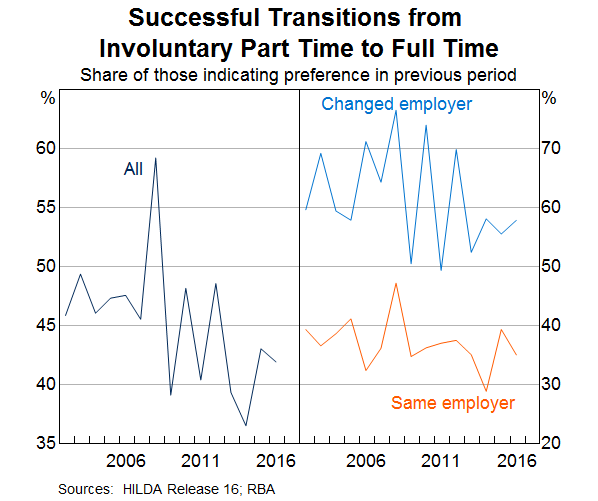
There is also evidence that the dynamic response of the labour market to changes in macroeconomic conditions has changed over the past decade. In particular, since 2009, average growth in part-time employment has been higher than average growth in full-time employment, despite the gradual decline of the unemployment rate. This has been associated with a decline in the probability of transitioning from a part-time to a full-time job, among those that would like to make that transition (Graph 12). On average, part-time workers who would like more hours have gone from having almost a 50 per cent chance of moving into a full-time job over the next year to something closer to a 40 per cent chance. The biggest change seems to be that underemployed people have been less likely to make a successful transition to full-time employment by changing employer than in the past. In 2009, the probability of transitioning from unemployment to employment also fell, but it has subsequently recovered.
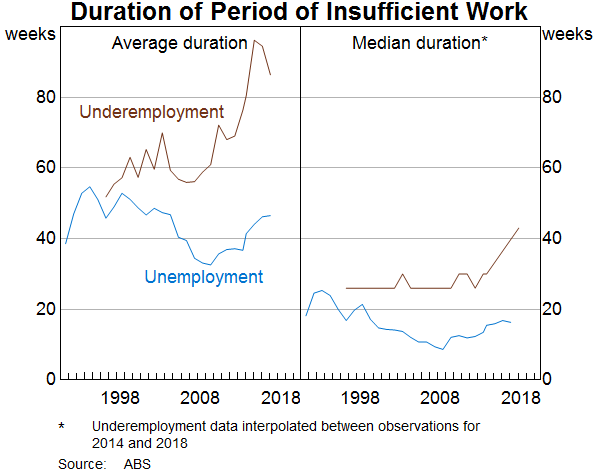
The decline in the probability of successfully transitioning from a part-time to a full-time job has been associated with a large increase in the average duration of underemployment (Graph 13). The average period of underemployment is now around 1½ years, up from around 1 year before 2009. This suggests that an increasing number of part-time workers are caught in a position of not having as much work as they would like for long periods. The average duration of unemployment has also increased since 2009, but to a much lesser extent.
As an aside, it is important to recognise that unemployment and underemployment affect some groups disproportionately. Both unemployment and underemployment are particularly prevalent in the youth labour market (15–24 year olds). Around 18 per cent of the youth labour market are underemployed, while 12 per cent are unemployed. These rates are well above the aggregate rates. While many young people are also studying while they look for a job or more hours, the share of 20–24 year olds working part time but not in study has increased. This is consistent with the fact that the transition from tertiary education to full-time work has slowed over the past decade.[9]
This analysis suggests that there has been some change in the dynamics in the labour market over the past decade. It is hard to tell whether this is just a feature of this cycle, or whether it is something more structural at this stage. From a monetary policy perspective, the immediate question is whether the changes we have seen have any implications for the way we measure spare capacity and understand the relationship between changes in spare capacity and wages growth.
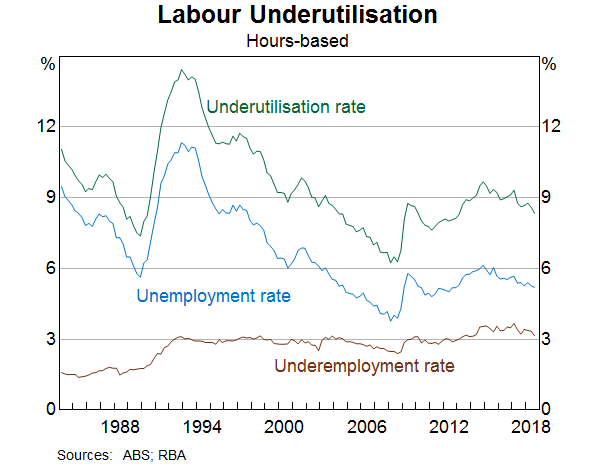
To answer this question, it is important to recognise that underemployed people typically want fewer additional hours of work than unemployed people and therefore each underemployed person represents fewer potential hours worked than an unemployed person. Hours-based measures of unemployment and underemployment weight each person by the number of additional hours they would like (Graph 14).[10] The effects of the economic cycle are apparent in both hours-based measures but in the most recent episode, the hours-based underemployment rate has remained elevated relative to the hours-based unemployment rate, which has gradually declined.
Adding measures of underemployment to wage equations does help to explain the recent episode of low wages growth at the margin. But it is hard to tell whether this is episode specific or an indication that there has been a more permanent change.
More generally, although working some hours is better than working no hours, long periods of underemployment can still have longer-term effects on an individual's labour market outcomes, similar to the well understood effects of long-term unemployment. As a result, large cyclical movements in underemployment could matter not only for assessing spare capacity in the labour market today, but also for assessing spare capacity in the future.
Encouraged workers and marginal attachment
Another important margin of adjustment for the labour market is the participation rate. When labour market conditions are strong, people join the labour force because their employment prospects are better. Strong conditions can also encourage those already employed to delay their decision to leave the labour force or retire. Economists often refer to this adjustment as the encouraged worker effect.
We saw this type of adjustment in the period of strong employment growth over 2017. Employment grew by almost 3½ per cent over the year, which is well above the growth in the working-age population. This was accompanied by a 1 percentage point increase in the participation rate, which is one of the largest changes in the participation rate over a one-year period.
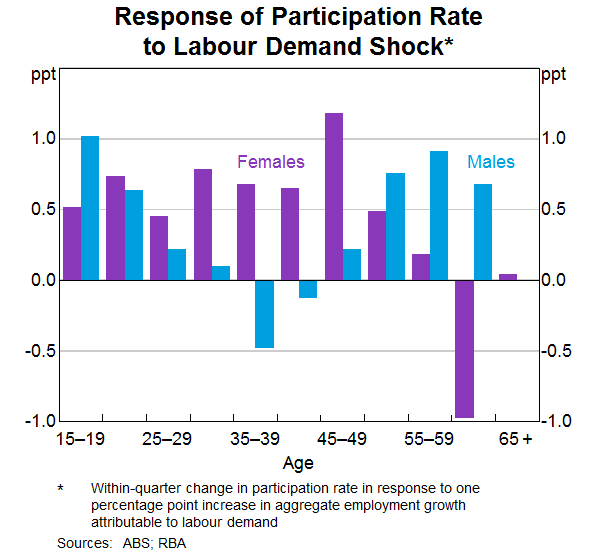
Recent work by staff at the RBA looked at how much the participation rates of different groups change over a quarter following a one per cent increase in labour demand. The results show that the groups who are most likely to increase their participation in stronger economic conditions are younger workers, 25–54 year-old females and older males (Graph 15).[11] This is not a surprising result given the picture of the labour market that has already been painted. For example, young people can defer study or reduce their study load to participate in the labour force when conditions are strong. Indeed, we saw this adjustment occur particularly clearly in some parts of the country in the mining investment boom, during which education attendance rates dropped meaningfully in Western Australia and Queensland relative to the rest of the country.
The estimated sensitivity of the participation choices of different groups is also consistent with evidence from the HILDA survey that suggests that over half of people flowing into the labour force were either studying or involved in childcare duties immediately before entering the labour force.
For a monetary policymaker, any increase in the sensitivity of labour force participation would have implications for how we think about spare capacity and forecast wages growth. If it has become easier for workers to transition in and out of the labour force, ‘marginally attached’ workers may represent a more important source of spare capacity and may be placing more downward pressure on wage outcomes than they did in the past. Although there is some evidence that younger workers and women aged between 25 and 54 years are more responsive to changes in economic conditions than in the past, it is not very convincing. This tentative evidence of increased sensitivity might be related to the fact that the workforce is more flexible, but there are other possible explanations and more work needs to be done before we can say anything more concrete.
More generally, measuring the size of the pool of potential labour market entrants is difficult. Survey data from the ABS has always suggested there is a large group of marginally attached workers who would like a job and would be available to start within four weeks, but are not actively looking (Graph 16). The most recent data suggest that there are close to 1.2 million marginally attached workers. This compares to around 750,000 people who were officially unemployed in the same period because they were actively looking.
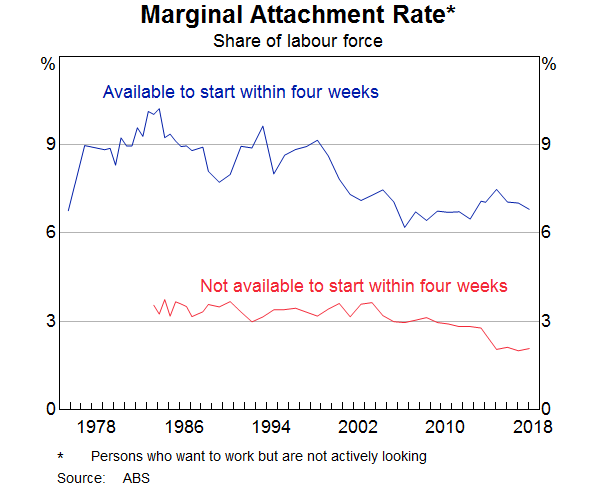
But this graph also shows that the rates of marginal attachment have been fairly stable over time, and, if anything, are lower than they were two decades ago. The fact that we don't see cyclicality in these rates – even though we know there is cyclicality in the participation rate – suggests that these measures are not fully capturing the source of potential labour supply. The HILDA dataset shows that people defined as marginally attached are much more likely to transition to employment than are other people outside the labour force, but actually only account for about half of the movements we see from outside the labour force to employment. This also suggests that only focusing on the marginally attached will miss half of the potential labour supply sitting outside of the traditional scope of the labour force. Net overseas migration is another potential source of additional labour supply.[12]
This all points to the fact that the labour market is more complex than the textbook suggests. We have made considerable progress towards understanding how to measure spare capacity in the labour market and how it changes over a business cycle. But there is more work to do to improve our ability to forecast wages growth, which is a key input into the inflation forecasts and ultimately summarises how much spare capacity there is in the labour market from the monetary policy perspective.
Conclusion
So, what can we say about the future? For a start, I think we can say that technological change will continue to create opportunities to increase the flexibility of work. History suggests that the increase in flexibility to date has allowed many people to combine work with other aspects of their life in ways that are closer to their preferences. It has also meant the way the labour market adjusts to economic slowdowns is less disruptive than in the past because having fewer hours of work during a downturn is better than being unemployed. But there are still people who are not working their preferred hours and there is a lot we don't know about how more access to flexibility is affecting the options individuals have about the way they work.
From the perspective of a monetary policymaker, the unemployment rate continues to be our main measure of spare capacity in the economy, certainly when it comes to understanding how spare capacity affects wages growth. But we need to stay on top of how things are changing because we need to forecast the most likely outcomes for wages and inflation, and it is also important to understand the risks to these forecasts. The fact that we are making decisions with a degree of uncertainty and that the economy keeps changing makes things challenging. However, when I'm asked by students why I love my job, I tell them that this challenge is what makes a career in economic policy making interesting and satisfying.
Endnotes
I would like to thank Angus Moore and Ewan Rankin for their excellent assistance with putting these remarks together. I would also like to thank my colleagues who have done the analytical work underpinning these remarks and who have provided comments along the way. [*]
Heath A (2016), ‘The Changing Nature of the Australian Workforce’, Speech at CEDA – Future Skills: The Education and Training Pipeline, Brisbane, 21 September; Heath A (2017), ‘Skills for the Modern Workforce’, Remarks to the Victorian Career Advisors conference, Melbourne, 1 December. [1]
For further detail on the subject, Marian Baird has a body of work on paid parental leave and other aspects of workplace flexibility. [2]
For a detailed look at the rise in the part-time share of employment, see Cassidy N and S Parsons (2017), ‘The Rising Share of Part-time Employment’, RBA Bulletin, September, pp 19–26. [3]
For more detail on the evolution of labour force outcomes for women, see my speech last year: Heath A (2017), ‘The Louisa Macdonald Oration’, Sydney, 22 May. [4]
Dhillon Z and N Cassidy (2018), ‘Labour Market Outcomes for Younger People’, RBA Bulletin, June, viewed 3 October 2018. [5]
See ‘Overemployment’, an article in the Australian Social Trends June 2011 release, for a snapshot of ABS data on overemployment, which tells a similar story to the HILDA data. [6]
The RBA has an article on unemployment in its ‘Explainers’ series that may be of use to teachers, see ‘Unemployment: Its Measurement and Types’ in the Education section of the RBA website. [7]
Bishop J, L Gustafsson and M Plumb (2016), ‘Jobs or Hours? Cyclical Labour Market Adjustment in Australia’, RBA Research Discussion Paper No 2016-06. [8]
Data from Graduate Carers Australia shows a decline in the share of new graduates entering full-time employment from over 80 per cent in the mid 2000s to around 70 per cent more recently. [9]
For discussion of the hour-based measure of underutilisation, see RBA (2017), ‘Box B: Underemployment and Labour Market Spare Capacity’, Statement on Monetary Policy, February, pp 38–40. [10]
Evans R, A Moore and D Rees (2018), ‘The Cyclical Behaviour of Labour Force Participation’, RBA Bulletin, September, viewed 3 October 2018. [11]
Lowe P (2018), ‘Demographic Change and Recent Monetary Policy’, Address to Anika Foundation Luncheon, Sydney, 8 August. [12]
This document uses unit record data from the Household, Income and Labour Dynamics in Australia (HILDA) Survey. The unit record data from the HILDA Survey was obtained from the Australian Data Archive, which is hosted by The Australian National University. The HILDA Survey was initiated and is funded by the Australian Government Department of Social Services (DSS) and is managed by the Melbourne Institute of Applied Economic and Social Research (Melbourne Institute). The findings and views based on the data, however, are those of the authors and should not be attributed to the Australian Government, DSS, the Melbourne Institute, the Australian Data Archive or The Australian National University and none of those entities bear any responsibility for the analysis or interpretation of the unit record data from the HILDA Survey provided by the authors.