Speech The Evolving Financial Situation
It is getting on for nearly three years since the onset of the financial turmoil that has bedevilled us for much of that time. Thankfully there are signs of a sizeable improvement in many markets in recent months, although I believe it is still premature to declare victory. While the general trend is positive, there are a number of risks still lingering that I will talk about a bit later.
In my talk today I will summarise the state of play in three major parts of the Australian and global financial markets: the credit markets, equity markets and the foreign exchange market. I will also describe the actions the Reserve Bank has taken in response to the evolving turmoil in markets over the past three years – outside of the interest rate decisions taken by the Reserve Bank Board. Reflecting the fact that Australian markets have generally functioned better than those in other developed economies, the need for policy intervention by the Reserve Bank was considerably less than for other central banks. Moreover, most of the actions that the Bank undertook have been completely unwound.
Before that, I will step back and give my quick potted summary of the cause of the financial turmoil. As I have said before, I would attribute a very large role in the financial crisis to a wholesale failure of risk assessment and risk management.
To illustrate this failure of risk assessment, I will use a quote I used in an earlier speech but it bears reiterating. In August 2007, David Viniar, the CFO of Goldman Sachs, said ‘We are seeing things that were 25 standard deviation moves, several days in a row.’
That was in August 2007, in the very early days of the crisis. The month of October 2008 following the collapse of Lehman Brothers delivered significantly more 25 standard deviation events in Viniar's distribution of risks. October 2008 was, hopefully, a once in a lifetime event. As my colleague at the Bank of England Andy Haldane pointed out, with a normal distribution, a 25 standard deviation event actually is already a once in a lifetime event, where the life, in this case, is that of the universe!
Given the extraordinarily low probability of even one 25 standard deviation event occurring, this illustrates that the models and statistical distributions used to assess and manage risk were, in many cases, plain wrong. This applies to models used by investors, issuers and regulators.
Credit markets
Credit markets were where it all began. This was where the failure of risk assessment and management was greatest, although it was also where the realisation first occurred that risks had been badly miscalculated. Indeed, for much of 2007, credit markets were a long way ahead of other markets in seeing the problems which were to come. Other markets, most obviously the equity market, remained generally unaware of what was unfolding in the credit world.
Asset-backed markets were where concerns first arose, particularly securities backed by US sub-prime housing loans. With some of these securities, it is optimistic to refer to them as asset-backed!
In the first half of 2007, great uncertainty arose about the quality and value of these securities and the assets that underpinned them. There was further uncertainty about whose books these assets resided on, generating a marked rise in counterparty risk aversion amongst financial institutions. That is, institutions became less willing to lend to each other, both because of concerns about the financial strength of the counterparty as well as a desire to hoard any available liquidity, should they themselves need it. This was most obviously manifest in a rise in short-term borrowing costs, represented here by the spread between Libor (bank bills in the case of Australia) and the expected policy rate (Graph 1). This spread is probably the best short-hand way of illustrating the fluctuating tensions in financial markets over the past three years.
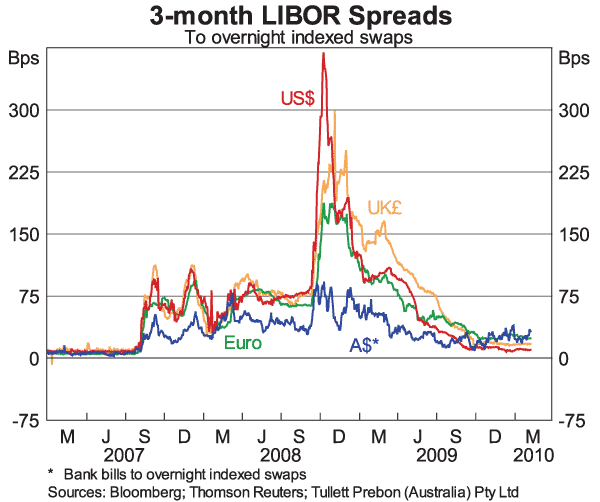
As is apparent in the graph, this spread was generally markedly lower in Australia than in the major financial centres, indicating that these tensions were a lot less in Australia. This reflects the fact that the balance sheets of Australian banks were considerably stronger than those in other countries. They did not have material holdings of, or exposure to, the securities backed by US mortgages. In addition, the quality of the loans on their books, which were almost entirely domestic, was also materially better than in some other banking systems. More generally, the counterparty concerns in the local market were generally much less here than elsewhere.
The Lehman event is also very apparent on the graph. Prior to Lehman, markets were clearly disrupted but there was a sense that the situation was generally manageable. In the period immediately after Lehman, there were fears the system was out of control. There were a few periods where the only market with any significant liquidity was on-the-run US Treasuries. Spreads widened significantly following the Lehman failure from already high levels. Indeed, these spreads are really only indicative as very little trading was occurring in that period in any market. Counterparty concerns were at their zenith with little confidence about who might be next to fall over.
The significant dislocation in financial markets following the Lehman failure, the US money market fund, Reserve, ‘breaking the buck’ and the rescue of AIG, Fannie Mae and Freddie Mac, resulted in large scale interventions by governments around the world. In many advanced economies, schemes to support securities markets were introduced. In the US, these schemes were an alphabet soup of acronyms such as TALF, MMIFF and CPFF. Governments also guaranteed the deposits and debt raisings of their banks.
While Australian markets were dislocated through this period, the dislocation was generally less and shorter lived. Hence the Reserve Bank was not required to intervene to the extent necessary in other countries. I will come back to this shortly.
While the financial situation in Australia was significantly better than many other countries, the Australian government introduced a guarantee on wholesale debt and deposits. With the guarantee in place in many other countries, Australian banks would have been at a significant competitive disadvantage in terms of funding costs had they not had the guarantee. In addition, the guarantee allowed the banks to access another group of investors who had an appetite for sovereign credit but not bank credit.
The Australian banks made fairly extensive use of the government guarantee of their debt. The need to use the guarantee for the most part reflected the high risk aversion of investors and was as much an issue of price as market access. The guarantee allowed the banks to raise funds considerably cheaper than they could without it. (This is evident in the fact that Goldmans issued an unguaranteed bond in the US in early 2009 at an extremely wide spread of more than 400 basis points over Treasuries.) It also allowed the banks to issue at longer maturities. Even in the worst of the crisis, in the last quarter of 2008, the banks were still able to rollover short-term wholesale funding, both on and offshore, without using the guarantee.
As risk aversion has dissipated, and spreads have narrowed, there has been an increase in unguaranteed issuance. For some months now, for the major banks, the cost of issuing unguaranteed debt, particularly at shorter maturities has been no higher, and often lower, than the cost of issuing guaranteed debt once account is taken of the guarantee fee. You can see from Graph 2 that this has led to an increase in unguaranteed issuance and a decline in guaranteed issuance. That is, the price mechanism works.
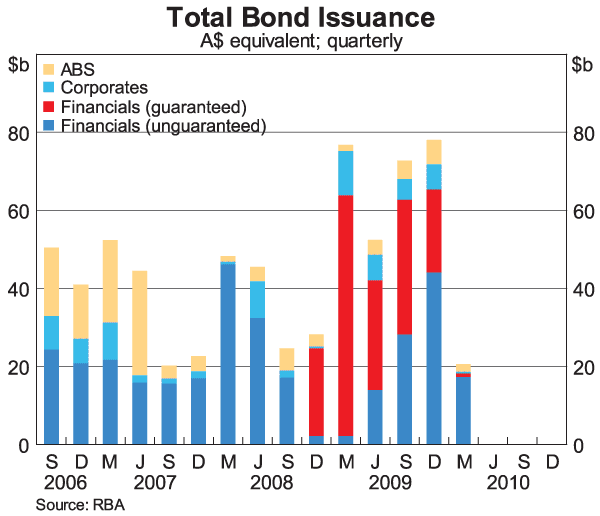
Reflecting the improvement in market conditions and the continued strength of the Australian banking system, the Treasurer has announced that the wholesale guarantee will cease at the end of March.
From Graph 1, it is apparent that spreads narrowed considerably over the second half of 2009. This was true both at shorter maturities shown here, but also at longer maturities. This narrowing demonstrates the considerable improvement in credit market conditions and the abatement of risk aversion. The improving conditions has also been reflected in the increase in issuance.
A further indication of the improvement in conditions, is that in Australia, the banks have been increasing the average maturity of their debt in recent months. They have tended to reduce the share of short-term bills in their funding mix and increase the share of longer maturity bonds, including a number of 7 and 10-year issues.
Securitisation markets have also begun to show some signs of life from the end of last year.[1] There have been sizeable RMBS issues by ME Bank, Bendigo and Adelaide, Westpac and most recently AMP and Bank of Queensland (Graph 3). One reason for this is that the stock of RMBS on issue has declined quite significantly over the past two years reflecting the lack of issuance and the amortisation of the existing issues, so investors have holes in their RMBS portfolios to fill. The current pace of issuance is around that required to maintain the existing stock at its current level (and is not too far short of the share of housing credit that it was earlier this decade). Moreover, the secondary market overhang caused by the portfolio liquidation of a number of SIVs has been largely eliminated. This has seen secondary market spreads tighten significantly.
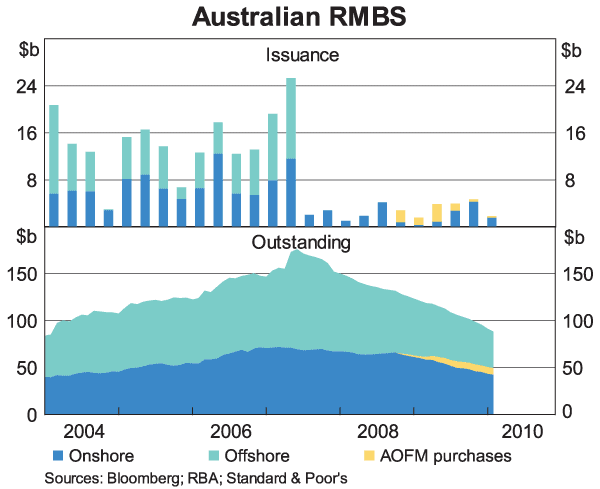
One can think of securitisation as being somewhat akin to a three or four year bond in terms of funding, given the effective life of an RMBS. The spreads on the recent RMBS issues are only a bit higher than those on the recent unguaranteed issues by the major banks of equivalent maturity, and the gap is narrowing. This means that RMBS is again beginning to provide a competitive source of funding, particularly for the regional banks (which pay higher spreads on their debt issues) and non-bank lenders which had both previously depended more on this source of funding.
Equity markets
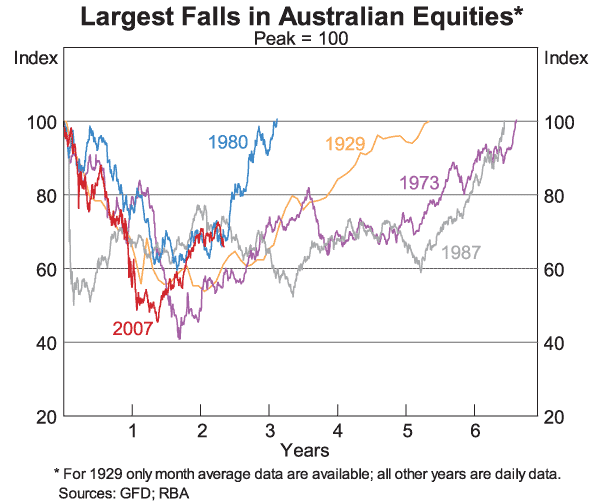
As I said earlier, equity markets took longer to be affected by the financial crisis, continuing to rise through much of the second half of 2007, peaking in November. But for the general public, the equity market was the most obvious manifestation of the crisis. Graph 4 compares the movement in the equity market in this episode with previous large movements. The current episode was one of the most rapid declines, surpassed only by 1987, and it was nearly as deep as the decline in 1973.
The local market moved broadly in line with other global equity markets, notwithstanding the relative outperformance of the Australian economy. Equity markets in many emerging economies generally fell by even more than equity markets in advanced economies, again despite stronger economic outcomes. The best example of this is the Chinese stock market which experienced a peak to trough decline of 70 per cent.
These large declines in equity prices resulted in a very large destruction of household wealth. However, a large portion of that decline in household wealth has been regained since the trough in equity markets in March 2009 because, while the decline was one of the sharpest on record, the rebound has also been relatively rapid. In China, the recovery has been even more rapid with the Chinese equity market rising by over 100 per cent at one point.
One marked feature of the Australian equity market over the crisis was the record amount of equity raisings that occurred in 2009 (Graph 5). Australian companies raised just shy of $100 billion over the course of last year. Equity was raised by non-financial companies as well as financial institutions. Some part of this equity raising reflected businesses turning to equity as a source of funds in the face of tightening in lending standards by banks. Equity has also been used to replace debt issues as they came to maturity.
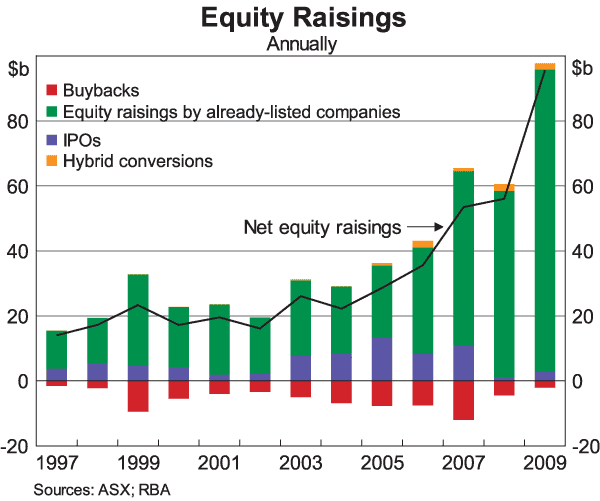
But these equity raisings have generally not been cheap. They often occurred at a sizeable discount to the prevailing stock price. And as I just noted, in most cases, equity prices have risen substantially from the time of the capital raising. Good news for those who subscribed to the capital raising, but not so cheap for the company.
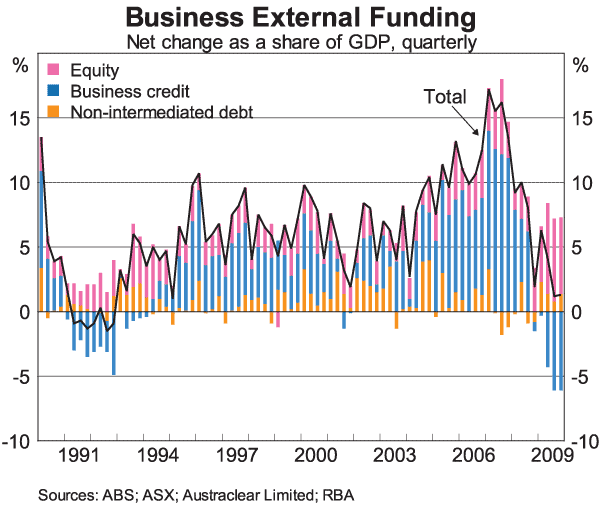
This large amount of equity raising is part of the explanation for the decline in business credit that we have seen. Through much of 2009, total business funding had been growing at a reasonable rate despite negative growth in business credit (Graph 6). Companies had been using their equity raising primarily to pay down debt.[2] That is, businesses turned away from intermediated credit from the banking system to raise funds directly from the market.
Foreign Exchange markets
I gave a speech on the recovery in the foreign exchange market late last year,[3] so I will only give a short recap of the main points now. There has been a very large swing in the Australian dollar over the past 18 months (Graph 7). The exchange rate depreciated by over 30 per cent from its peak in July 2008 to its trough in March 2009 and has subsequently appreciated to be now not much more than 5 per cent below the July 2008 peak on a trade-weighted basis. These swings in the exchange rate have played an important role in buffering the economy from the turmoil in the global economy.
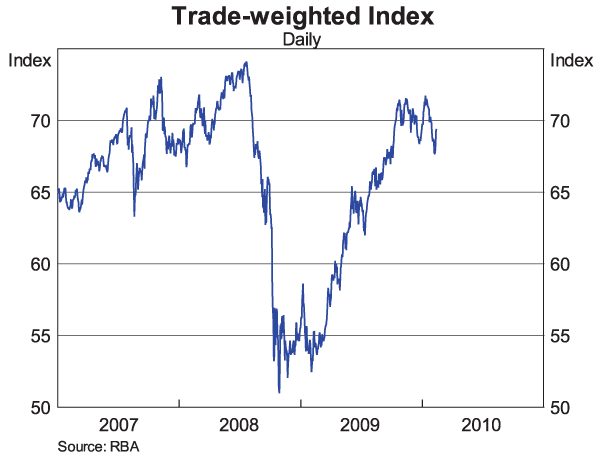
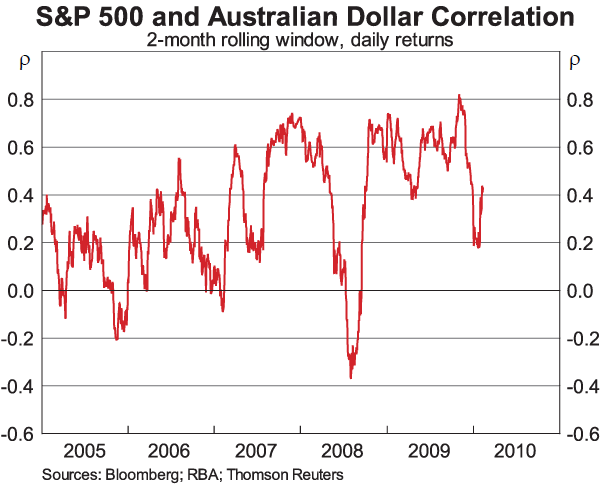
Some of the depreciation in the currency and subsequent appreciation reflected the movements in risk aversion that are also evident in the money market spreads I discussed earlier. Indeed, the Australian dollar was often cited as a barometer of market sentiment. This is evident in Graph 8 which shows the very high correlation between the Australian dollar and equity markets during the crisis (and interestingly this correlation has declined significantly of late). In part this correlation was high because as risk aversion increased, investors retreated to their home markets, repatriating their holdings of foreign assets. In addition, a number of highly leveraged investors were forced to liquidate their portfolios that often included Australian dollar investments, as losses mounted on their other asset holdings. Significant flows were also generated by non-leveraged investors with foreign equity investments, which needed to rapidly adjust the size of their foreign exchange hedges in response to the sharp moves in global equity values.
Notwithstanding the fact that the Australian foreign exchange market is generally very liquid, there were occasions when liquidity became scarce around the times of maximum risk aversion, particularly following Lehman. That marked reduction in liquidity prompted the Reserve Bank to enter the market to mitigate the liquidity shortfall. We were not seeking to maintain any particular level of the exchange rate, indeed as I mentioned earlier, we were quite comfortable with the direction of the exchange rate. Rather we were seeking to redress the market dysfunction that was resulting from the significant lack of liquidity. The reserves used in the foreign exchange intervention have been subsequently repurchased in a way that minimised any impact on the market.
RBA actions
Let me now turn to the actions of the RBA during the crisis, outside of the policy rate decisions. One summary way to compare the actions of the RBA with that of other central banks is to look at movements in their balance sheets. Graph 9 shows that the Reserve Bank provided a sizeable degree of liquidity support to the market following Lehman, but that our balance sheet has since declined as this liquidity support has been unwound. The graph also shows the substantial increase in the balance sheets of the Fed, ECB and Bank of England, which have all yet to decline.
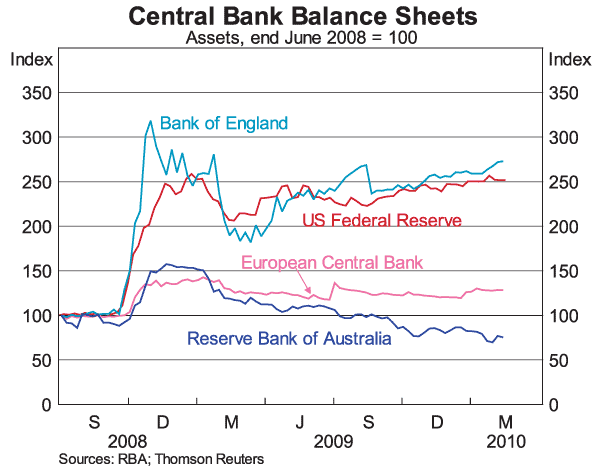
One marked difference between the increase in our balance sheet and that of the Bank of England and the Fed, is that here, the increase resulted predominantly through our regular market operations (although the foreign exchange swap facility with the Fed accounts for a sizeable portion of the rise in our balance sheet, see below). In contrast, the bulk of the increase in the UK and US is from direct purchases of government securities (and mortgage securities in the US) associated with their policy of quantitative easing.
The actions we undertook to provide liquidity to the domestic money market were conducted almost entirely within our pre-existing framework for market operations. We have always dealt with a wide range of counterparties (which are not just banks as is often mistakenly thought), and we have always had the capacity to adjust the term of our operations very quickly. Because we operate in the market every day, it is relatively straightforward for us to assess the degree of tension in the market and respond accordingly. Our operating system is flexible and we availed ourselves of that flexibility through the crisis period. Obviously our life was made easier by the fact that the difficulties we faced were markedly less than those in other countries, but the framework we had established over a number of years did make our task easier.
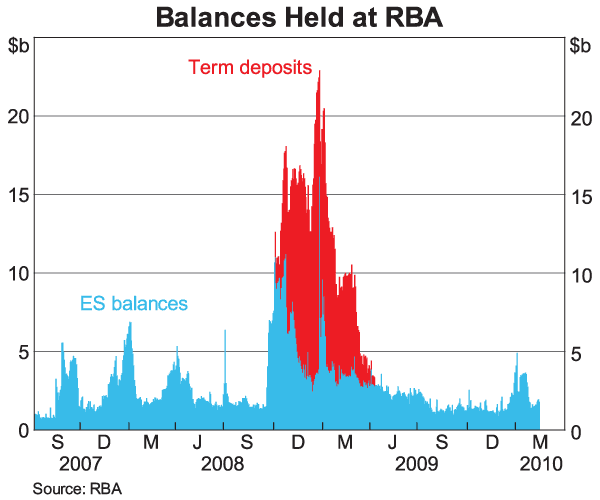
The extent of liquidity we provided can be gauged by looking at the evolution of exchange settlement (ES) balances which are the balances in the accounts that financial institutions hold with us. As counterparty risk rose, banks were more inclined to hold larger precautionary balances with us. To allow us to provide assistance to the debt markets by undertaking more repos without putting undue pressure on the overnight cash market, in late October, we introduced a term deposit facility This was effectively an ES balance held for a week or two, rather than overnight.
Graph 10 shows that balances held at the RBA peaked in late 2008 at the height of global risk aversion. But notwithstanding a recent seasonal increase around the end of the year, ES balances are back to around $1½ billion and banks no longer have any term deposits with us. So that aspect of our liquidity support has been fully unwound.
To provide some certainty to longer term funding, we offered 6 month and 1 year terms for our repos on a daily basis from October 2008. But as demand for these longer terms diminished, we ceased offering these daily, although we are still willing to deal at these longer terms if it is consistent with our liquidity management objectives and the pricing is appropriate.
Another action we took during the crisis was to expand the sphere of collateral eligible for our market operations. We now accept all AAA-rated paper (except highly structured paper). As I have said before, we intend to maintain that wider collateral pool.
Another significant change to our collateral policy we made was to accept so-called self-securitised RMBS from the issuing institution. Our counterparties made extensive use of this, particularly as collateral for our longer-term repos. By the end of December 2008, self-securitised RMBS accounted for just under half of our repo collateral. But as those repos have matured, their share of our collateral has declined to under a quarter.
| Collateral Type | End Jun 2008 Per cent | End Dec 2008 Per cent | End Jan 2010 Per cent |
|---|---|---|---|
| General Collateral | |||
| – CGS | 1.6 | 0.7 | 9.8 |
| – Semis | 7.3 | 1.2 | 26.7 |
| – Supras | 2.8 | 0.8 | 2.9 |
| – Govt Guaranteed ADI paper | 0.0 | 0.0 | 4.6 |
| Private Securities | |||
| – ADI paper | 82.3 | 43.1 | 29.2 |
| – RMBS (self-securitised) | 0.0 | 45.2 | 22.6 |
| – RMBS (other) | 5.3 | 5.3 | 3.3 |
| – ABCP | 0.6 | 3.0 | 0.8 |
| – Other | 0.0 | 0.6 | 0.2 |
| Total value of Repo Book ($b) | 55.1 | 98.9 | 26.2 |
Finally, in October 2008, we, along with a number of other central banks, established a foreign exchange swap facility with the Fed. This facility was introduced to address the global shortage of US dollars (outside the US) which was causing a substantial dislocation in swap markets.[4] Under this facility, we auctioned US dollars, obtained under swap from the Fed for Australian dollars, to our domestic counterparties in exchange for domestic collateral. (We took a larger than normal margin on that collateral to protect us from the exchange rate risk). Usage of this facility peaked at the end of December 2008 and it was last accessed here in April 2009. The facility was formally terminated, along with those of other central banks, on 1 February.
The clear theme here is that the RBA did provide assistance to contribute to the smoother functioning of financial markets through the turbulence, but the assistance we were required to provide was considerably less than in other countries, and importantly, we have been able to unwind it as market conditions have improved.
Lingering risks
As I hope I have made clear, there has been a significant improvement in financial market conditions since their nadir just over a year ago. However, risks remain. I do not see these downside risks in Australian or Asian financial markets but rather in the major North Atlantic markets of the US, Europe and the UK. Indeed, in Asia, the risks are more on the upside. While most of the recent jitters have been associated with sovereign concerns, I think risks stemming from the financial sector are still there.
To some extent, one can characterise much of the past three years as problems originating in the financial sector feeding into the macroeconomy. We are now into the phase where the weakness in the global macroeconomy is feeding back into the financial sector.
In that regard, a significant risk, in my assessment, is that we are still yet to see the full impact of the weakness in the North Atlantic economies on the loans on the books of financial institutions. The bulk of the losses to date by these institutions have been write-downs in the value of securities held on their books. While these write-downs have been absorbed, albeit with some difficulty and with substantial capital raisings, given the size of the output contraction, one would expect that we are not all that far advanced in the adverse credit cycle that normally accompanies recessions. For the North Atlantic economies, this was a big recession which, combined with large falls in both commercial and housing property prices, should result in large loan losses.
Last May, the US authorities released the results of a stress test of their 19 largest financial institutions and concluded that these institutions could survive a scenario not dissimilar to the one we are seeing currently. In some cases, survival was predicated on the raising of additional capital which has subsequently occurred. While one therefore might be reasonably confident of the ability of these institutions to absorb the deterioration in their loan books, my concern is more with the second tier (and beyond) of the US financial system. This lower tier, which is a sizeable share of the US financial sector, has loan portfolios which are very regionally concentrated with a sizeable weighting to commercial property. The experience of previous cycles indicates that the commercial property cycle takes a long time to unfold, and we may have some way yet to travel. These problems in the banking system will almost certainly hinder credit provision in the US, particularly to the SME sector, which doesn't have the direct access to capital markets that larger corporates have.
Even though one might be relatively confident that the major financial institutions have the ability to absorb the loan losses still to come, there may also be a concern that there could be an adverse effect on public confidence, should these institutions report further quarterly losses. The general public might well be surprised that losses are continuing to occur, given the sizeable public sector support that has already been provided.
While these risks are there in the North Atlantic, they are not present in our part of the world. In Asia, bank balance sheets have remained in sound condition throughout and hence are no impediment to credit provision. Indeed, there is a marked contrast between the balance and nature of the risks in Asia and the North Atlantic. While the near-term risks may be on the downside in the US and Europe, they would appear to be on the upside in Asia. The interplay between the contrasting fortunes of these two parts of the world is likely to be the critical factor in determining the evolution of the global economy, and Australia is now more tied into one than the other.
But the above are risks, not the central case. The central case is that financial markets have improved considerably over the past year. This improvement has allowed a sizeable portion of the interventions in financial markets undertaken by central banks over the past three years to be unwound. This is particularly true in Australia, where the measures we undertook were considerably less and have been unwound.
Endnotes
I thank Anna Brown for her assistance with this talk. [*]
I spoke about this at length not long ago, see ‘Whither Securitisation?’, speech given to the Australian Securitisation Conference 2009, 18 November 2009. [1]
My colleague John Broadbent talked about this late last year, see ‘Reconnecting Corporate Australia with Frozen Credit Markets’, speech given to Corporate Finance World Australia 2009, 10 November 2009. [2]
‘The Australian Foreign Exchange Market in the Recovery’, speech given to the Westpac Research and Strategy Forum, 10 December 2009. [3]
Baba N and F. Packer (2009), ‘From turmoil to crisis: dislocations in the FX swap market before and after the failure of Lehman Brothers’, BIS Working Paper no. 285. [4]
