Speech A Comparison of the US and Australian Housing Markets

Guy Debelle
[1]
Assistant Governor (Financial Markets)
Address to the Sub-prime Mortgage Meltdown Symposium
Adelaide –
The unravelling of the sub-prime mortgage market in the United States over the past year has been associated with a major dislocation in financial markets that is still playing out. The developments in the sub-prime mortgage market should really be seen in the context of the broad-based repricing of risk that has occurred since last August. It has been the most obvious manifestation of this to the general public.
For a number of years, concerns had been expressed about the underpricing of risk in a range of financial instruments and the associated search for yield as investors sought higher returns in non-standard financial products as the yield on more standard products such as government bonds was deemed to be inadequate. The ‘search for yield’ and the general underpricing of risk that was prevalent up until last August provided an environment which facilitated the rapid growth of sub-prime lending.
In this paper, I will describe the characteristics of the US mortgage market, focusing on the sub-prime market and then compare it to the Australian mortgage market, where sub-prime comprises a very small share. In part, because the Australian financial system and economy entered the turbulence in strong shape, it has been considerably less affected than those in other countries, most obviously the United States. Nevertheless, there has been some effect domestically and in the final section of the paper I will discuss some of these channels.
1. Characteristics of the US Mortgage Market[2]
It is useful to begin by defining what I mean by sub-prime, which is most easily done by defining prime. Prime mortgages in the US are those that meet the underwriting standards for entry into mortgage pools sponsored by the agencies Freddie Mac and Fannie Mae – so called ‘conforming’ mortgages. Non-prime mortgages are then those which are not prime. Generally they are to borrowers with a higher risk of default often related to the borrower's previously poor credit history. Jumbo loans, which are loans which are larger than the maximum set by the US agencies, are also an important component of non-conforming loans.
In broad terms, the non-prime mortgage market can be categorised into two segments: the highest credit quality segment is referred to as ‘near prime’ or Alt-A, and the remainder is the genuine ‘sub-prime’ category.[3] While Alt-A borrowers typically have only minor credit infringements in their history, other characteristics, such as a large loan, high loan-to-valuation ratios (LVR) or inadequate income documentation, mean they are unable to obtain a prime loan. Sub-prime borrowers typically have a blemished credit history and/or an appreciably impaired capacity to service the proposed loan.
There is no commonly agreed distinction between prime, Alt-A, and sub-prime borrowers based on the widely used Fair, Isaacs and Company (FICO) credit score. Data published by the New York Fed suggests a typical sub-prime FICO score of around 620 and Alt-A score of about 700. Most lenders regard FICO scores below 620 as sub-prime, 620 to 720 as Alt-A, and over 720 as prime. In sum, sub-prime and Alt-A borrowers have lower credit scores and higher LVRs, higher delinquency and foreclosure rates, and consequently pay higher interest rates than prime borrowers (Table 1).
| Sub-prime | Alt-A | Prime | |
|---|---|---|---|
| Interest rate | 8.68 | 6.93 | 5.79 |
| FICO Score | 617 | 704 | 730 |
| LVR | 85 | 81 | 70 |
| Balance ($US '000) | 181 | 299 | 309 |
| Low doc | 30 | 53 | 0 |
| ARM | 59 | 40 | |
| Owner-occupied | 91 | 72 | |
| Delinquency Rate (30 days) | 24.5 | 4.5 | 3.2* |
| Foreclosure Rate | 8.5 | 2.9 | 1.0* |
|
Source: Federal Reserve Bank of New York; Loan Performance; Mortgage Bankers
Association |
|||
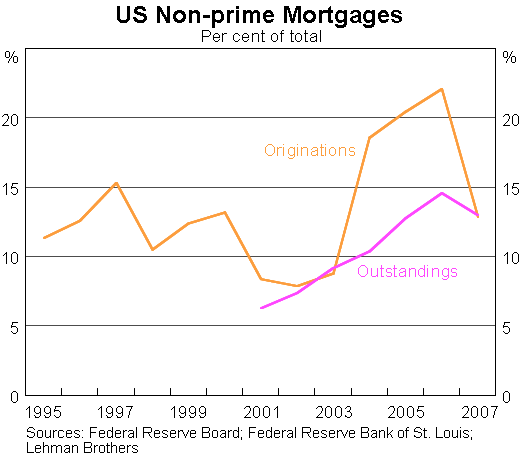
Growth in non-prime mortgage originations first picked up in the mid 1990s. From 2003, the non-prime segment entered a period of exceptional growth (Graph 1). Non-prime originations reached over 20 per cent of total US mortgage originations in 2006, and are now estimated to account for around 13 per cent of mortgage debt outstanding.
One noteworthy feature associated with the expansion of non-prime lending has been the rise in home-ownership rates, particularly amongst minorities, that it has facilitated. This needs to be kept in mind when thinking about the problems that have subsequently resulted. While delinquency rates may be currently around 25 per cent, that does mean that 75 per cent of borrowers have thus far been able to purchase a house, many of whom otherwise probably would not have. Moreover, a number of borrowers refinance out of their sub-prime loans into a prime loan once they have established a suitable repayment history, so that over time there is a sizeable transition of sub-prime borrowers to prime borrowers.
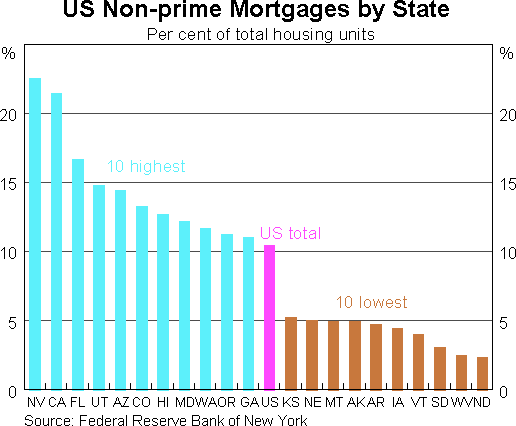
As has been widely discussed, the prevalence of non-prime lending varies significantly across different regions of the US. One important factor driving the geographic distribution of non-prime lending is the fixed national loan size limit on conforming loans: the limit does not account for the large variation in house prices and earning capacity across different regions. High house price states, such as California and Florida, therefore tend to have a greater incidence of non-prime mortgages (Graph 2). This geographic concentration has become problematic as the house price cycle has turned (see below).
1.1 Why did sub-prime lending grow in the US?
The sub-prime market grew as a result of a number of developments on both the supply and demand side of the credit market. Greater availability of data on potential borrowers and new techniques to analyse that data allowed lenders to design products that were, in principle, better tailored to that part of the market. The combination of credit scoring and risk-based pricing allowed borrowers access to housing finance that had previously been unavailable.
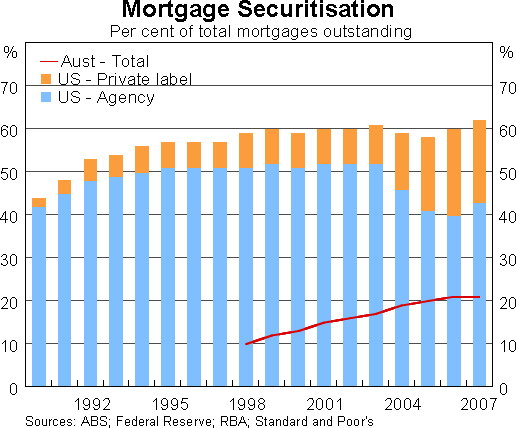
As noted above, agency-backed funding is not available to the non-prime market. A crucial parallel development to the emergence of non-prime lending has been the growth in the ‘private label’ mortgage-backed securities (MBS) market. Private label MBS outstanding have essentially tracked the growth of non-prime mortgages outstanding (Graph 3) indicating securitisation has been the principal funding strategy for non-prime lenders.
In turn, there was a strong investor appetite for such securities which offered a high yield for a highly rated product. This appetite was particularly enhanced by the widespread ‘search for yield’ that was prevalent for the five years or so prior to last August.
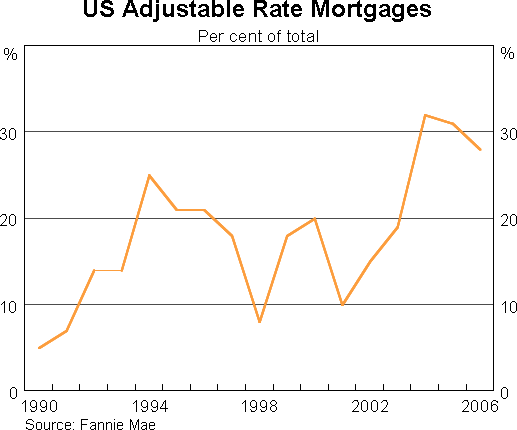
There were also developments in terms of the pricing of these mortgages that facilitated their growth. The traditional prime mortgage product in the US is a fixed-rate 30-year amortizing loan, which imposes minimum interest rate risk on borrowers who can typically refinance with little penalty if interest rates fall. One feature of the expansion of the non‑prime market has been the introduction of a wide range of non-traditional mortgage products including: interest only (IO), negative amortizing loans and adjustable-rate mortgages (ARMs). The latter became increasingly popular in the US from 2003 (Graph 4). They are often referred to by reference to the length of the initial fixed-rate term; for example 2/28 and 5/25 refer to loans that have initial two or five year periods before the interest rate is reset to a variable rate.
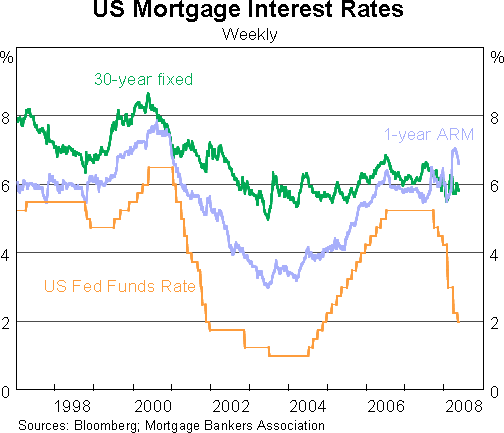
The popularity of ARMs during the period of monetary easing following the economic slowdown in 2001 was partly due to the greater responsiveness of short-term interest rates to the monetary stimulus, compared with rates on long-term fixed-rate mortgages (Graph 5). Low initial rates on ARMs also reflected aggressive pricing by lenders, particularly on non-prime products. The true cost of these products was obscured by the increasing use of larger upfront fees[4] and larger pre-payment penalties designed to prevent migration after the initial interest rates were reset to market benchmarks. The typical effect of these pricing mechanisms was to push out the real servicing burden past the initial few years.
Finally on the demand side, there was a marked change in the attitude of US households to property in recent years. The US has certainly experienced house price cycles in the past, although they tended to be more localised events such as the oil-related boom-bust in Texas property in the mid 1980s, New England in the late 1980s/early 1990s and the tech-related property cycle in California around 2000 (Case, Quigley and Shiller 2003).[5]
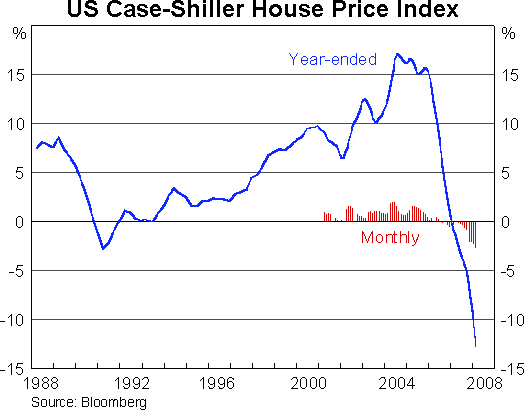
The rapid appreciation in house prices that occurred right across the country in the US from 2003 to 2006 (Graph 6) meant that property was now regarded as a very attractive investment option. A cohort of ‘property flippers’ emerged whose aim was to buy and sell in a short period of time as property prices rose (and definitely sell before they fell). As Federal Reserve Bank of Boston President Rosengren has stated: ‘in retrospect, many borrowers took significant risks that would only be successful in a market with rising housing prices and the ability to refinance as needed’ (Rosengren 2007). By 2007, 17 per cent of all non-prime loans were for investment; the share of Alt-A loans was 28 per cent, while in sub-prime it was 9 per cent.[6]
1.2 What caused the problems?
Now I will turn to the question of why the sub-prime market has experienced such difficulties.
There are at least four factors that can be identified: reset shock, poor assessment of the risks by the lending institution, a decline in underwriting standards and, more recently, the decline in house prices (although this is somewhat endogenous). Notably, the economic slowdown in the US has, by and large, followed the sub-prime crisis rather than been a cause.
As noted above, a significant share of sub-prime mortgages were adjustable-rate mortgages which had ‘teaser’ rates. The teaser rates applied for the initial fixed period of the loan, typically one or two years, and were at a significant discount, often as much as 5 or 6 percentage points below the rate that would apply for the remaining life of the loan. In the case of the investment buyers mentioned above, they would hope to have sold the property before the higher interest rate applied.
The incidence of rate resets reached a peak around mid 2007, being one to two years after the peak in new loans. Using the LoanPerformance data published by the New York Fed, we estimate that the typical reset for sub-prime borrowers has been around 5 percentage points.[7] This reflects both the discount in the initial period of the loan as well as the fact that as the Fed tightened monetary policy, the rate to which the mortgage reset rose.
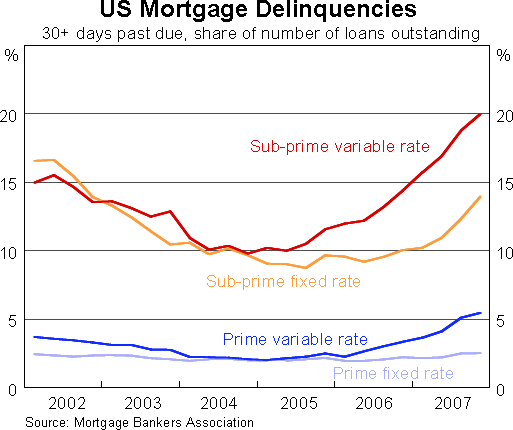
The fact that resets have been an important trigger for the sharp rise in delinquencies is evident in the sharper rise in delinquencies on variable-rate mortgages than on fixed-rate mortgages (Graph 7). The growth in delinquencies on prime variable loans is also noteworthy in Graph 7 but this predominantly reflects higher arrears on Alt-A loans, which are categorised as prime loans in the Mortgage Bankers Association data used here.
With the introduction of more sophisticated pricing techniques over the past decade or so, the mortgage industry recognised that efficiently pricing mortgages needed to account for the embedded options in mortgage products – namely the option to sell and close down the loan, to refinance, or, in the event the mortgage is not serviceable, the option to default. Adequately pricing these loans requires modelling how frequently borrowers will exercise these options – experience suggests that borrowers in the mortgage market exercise options much less than standard ‘rational’ option theory would predict.[8] While historical evidence provided a good guide for modelling the option behaviour of borrowers in the prime market, the short history of the non-prime market severely restricted the ability of lenders trying to model behaviour in this market. In addition, it is likely that lenders did not account for the risk of contagion in housing markets – that weak house price growth would significantly increase the likelihood that borrowers would default. So, while the ‘risk-based’ pricing systems that drove growth in the non-prime market may have been discriminating across borrowers appropriately, it clearly did not adequately price the risk of a systemic shock to the housing market.
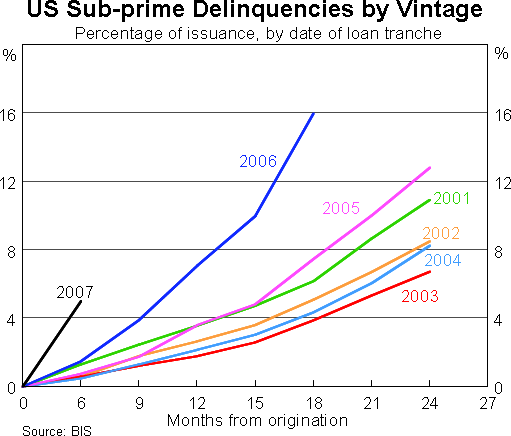
While the above reflected a misplaced assessment by the lender of the borrower's ability to service the loan, the decline in underwriting standards which appeared to accelerate around 2006 reflected a conscious decision on the part of mortgage originators to lend to those who previously had been judged to be unable to service the loan. The decline in lending standards is most easily demonstrated if we look at mortgages by the year they were originated. Loans originated in the latter years of the sub-prime cycle, 2006 and 2007, are showing significantly higher impairment rates at the same stage of their life than earlier vintages (Graph 8).
This marked decline in underwriting standards appears to be related to the origination system that was prevalent in the US system. Those who originated the loan were paid on the volume of loans they were writing. These loans were then sold to another entity, generally an investment bank, who then packaged the loans into a residential mortgage-backed security (RMBS) which was sold to the end-investor. The originators had no long-term incentive, beyond reputation, to ensure that the underwriting standards were adequate. As the flow of new loans showed signs of diminishing in 2005 with the rise in US interest rates, the originators appear to have eased lending standards to maintain the flow.
Graph 8 indicates that the delinquency rate on sub-prime mortgages still probably has some way to rise given that the 2007 and many of the 2006 vintage mortgages have still not reached their interest rate resets.
Falling house prices have also played a role. While rising house prices allowed borrowers who were unable to service their mortgages the possibility of refinancing and using extracted equity to meet payments or selling without any loss to either them or the lender, this is not the case when house prices are falling. Indeed, with the extent of the falls that have been observed in parts of the US,[9] it can make sense for the borrower to walk away from the loan and the house, particularly if they are an investor rather than an owner-occupier. This is even more accentuated by the fact that in a number of US states, there is no recourse for the lender to other assets of the borrower in the event of default (this is not the case in Australia, as discussed below).
This process also becomes a vicious circle with falling house prices engendering more mortgage defaults and foreclosures which in turn puts further downward pressure on house prices. This is particularly the case given the geographic concentration of sub-prime mortgages in cities such as Las Vegas and Detroit, as well as areas of California and Florida.
2. The Australian Mortgage Market
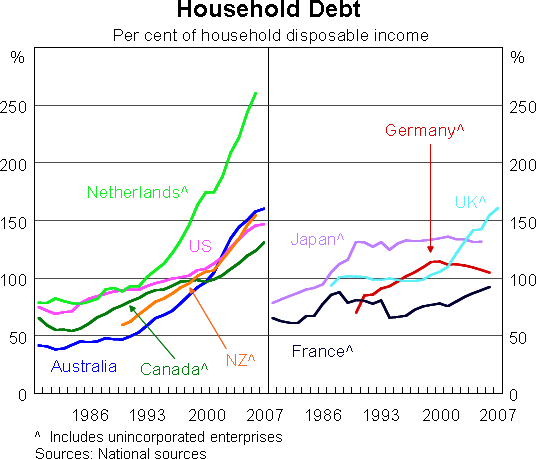
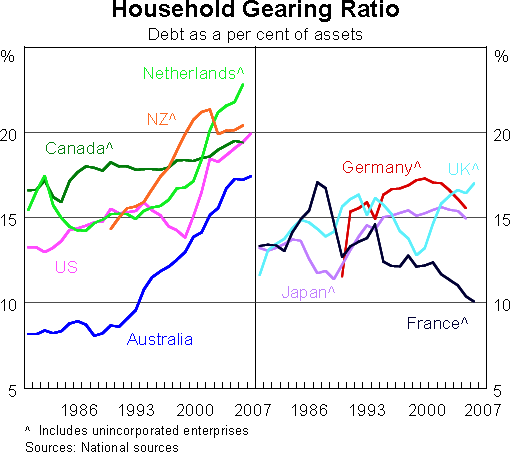
Over the past decade, household debt in Australia has grown at an average annual rate of just under 15 per cent. As a result, the debt-to-disposable income ratio has roughly doubled from 75 per cent to 160 per cent over this period to be broadly the same as that in the US, and high in comparison to other countries (Graph 9). As I discuss in Debelle (2004), debt-to-income ratios are not necessarily the appropriate benchmark to assess relative debt levels as they deflate a stock by a flow. Debt-to-asset ratios are generally preferable (and are used when examining a corporate balance sheet), and on this metric, Australian debt levels are broadly similar to a number of other countries (Graph 10).
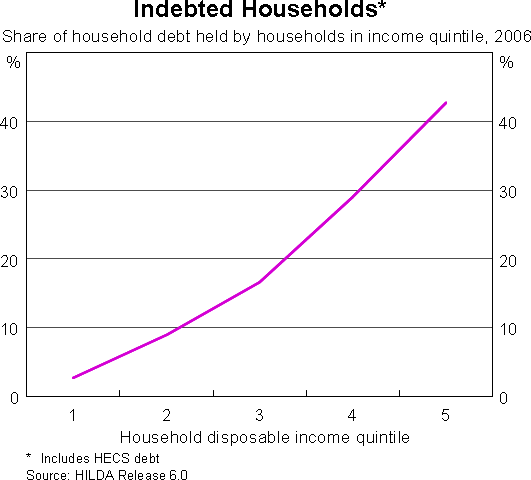
While the aggregate debt-to-income ratios are similar in Australia and the United States, the distribution of debt is quite different. Sub-prime lending makes up a very small share of the Australian mortgage market. The bulk of household debt in Australia tends to be owed by those with the highest incomes who are most able to service their loans (Graph 11). The RBA has published a number of articles looking at the distribution of debt that illustrate this point.[10]
Turning to look at the small sub-prime market in Australia, non-conforming housing loans are the closest equivalent to sub-prime loans in the US, being provided to borrowers who do not satisfy the standard lending criteria of mainstream lenders such as those with impaired or incomplete credit histories. The loans are provided by a few specialist non-deposit taking lenders, with Pepper, Bluestone and Liberty Financial accounting for three-quarters of the market. This is in contrast to the US where sub-prime loans were provided by a wide range of financial institutions.
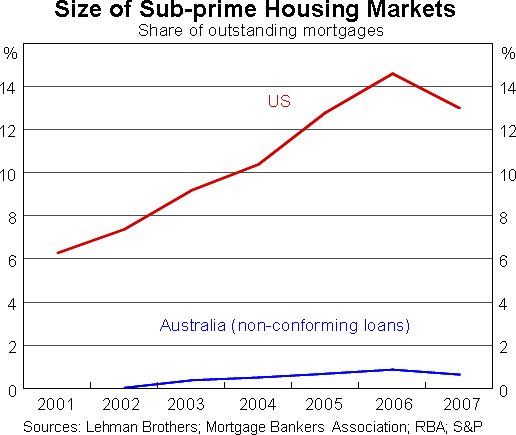
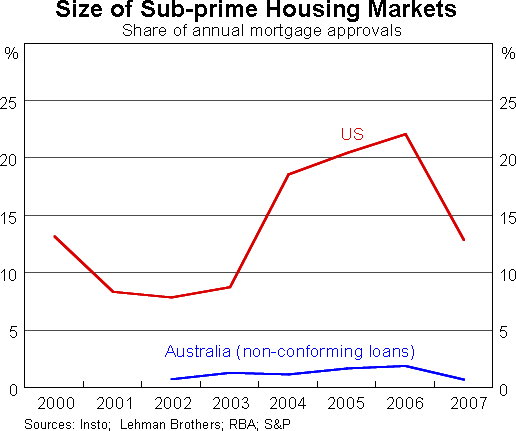
Non-conforming loans in Australia accounted for only about 1 per cent of outstanding loans in 2007, well below the 13 per cent sub-prime share in the US (Graph 12). The share of new loans in Australia that are non-conforming has also been very low over recent years, at about 1 to 2 per cent, significantly below the 20 per cent sub-prime share that such loans reached in the US in 2006 (Graph 13).
As at the end of December 2007, the arrears rate was 4.5 per cent of the number of outstanding non-conforming loans in Australia, above the 0.25 per cent arrears rate on securitised Australian prime loans, but significantly below the equivalent arrears rate on sub-prime loans in the US (Graph 14). Partly as a result of the lower arrears rate on the Australian non-conforming loans, ‘buy-and-hold’ investors have suffered very few losses on securities backed by the Australian non-conforming loans.
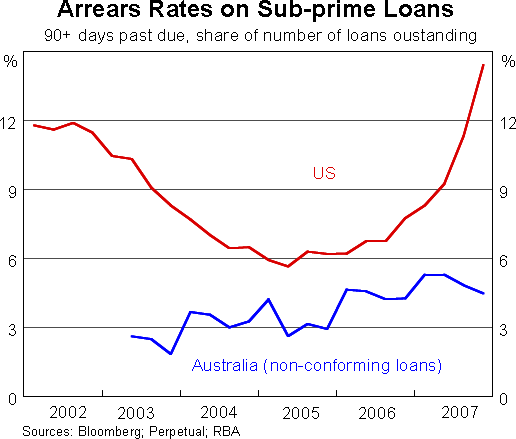
The lower arrears rate on Australian non-conforming loans compared to US sub-prime loans reflects differences in the loans' structural features.
- Australian non-conforming loans have a less risky structure than US sub-prime loans. The average loan-to-valuation ratio on newly approved Australian non-conforming loans is around 75 per cent, which is lower than the average 85 per cent LVR on US sub-prime loans. There is a significant inverse relationship between LVRs and delinquency rates.
- Australian non-conforming loans do not usually feature low introductory interest rate periods (teaser rates) or high-risk repayment options (such as negative amortization periods).
- Australian lenders typically retain the lowest rated tranches of their residential mortgage-backed securities or place them with closely associated entities.
- The Australian legal system, which gives a lender recourse to all of the borrower's assets in addition to the house, provides the borrower with a stronger incentive to repay their loan.
The lower arrears rate also reflects the strength of the Australian economy, particularly the low unemployment rate and the strong rate of household income growth.
3. Effects of the Recent Turmoil on the Australian Economy
The Australian mortgage market has not been subject to the same stresses as the US mortgage market because of both the very small size of the sub-prime market and the fact that the local sub-prime market has not suffered from the same flaws as the US equivalent.
Nevertheless, the Australian financial system has seen some fallout from the problems in the US. There has been very little in the form of direct exposure. The Australian banking system had very small holdings of instruments with exposure to the sub-prime market, either mortgages or collateralised debt obligations (CDOs). A small number of local hedge funds had some concentrated exposure, most notably Basis Capital and Absolute Capital. In addition, a number of local councils held CDOs with sub-prime exposure. But overall, the balance sheets of Australian financial institutions remain very strong.
As I mentioned at the beginning, however, the sub-prime crisis should really be seen in the context of a general repricing of risk in financial markets and this has had a more noticeable impact on the Australian financial system.
As risk has been repriced, the cost of borrowing has risen in intermediated markets so that Australian financial institutions (in line with all global institutions) have found it more costly to raise funds to finance their lending. However, Australian banks have generally not found their access to capital markets, both domestic and offshore, noticeably curtailed. While they have had to pay more for the funding, they have been able to raise the funding necessary to fund their targeted rate of balance sheet expansion. Moreover, this balance sheet expansion has mostly reflected new lending rather than the bringing onto the balance sheet of previously off-balance sheet exposures. This stands in stark contrast to some other global banks who have found it difficult to raise funds to meet their re-financing of off-balance sheet exposures.
Lenders have passed on their higher funding costs to borrowers, both households and businesses. As a result of the turmoil the average rate on a standard variable rate mortgage has increased by 40 basis points more than might otherwise have been the case, while the standard business borrowing rate has increased by between 30 and 60 basis points. The average rate on non-conforming loans in Australia has risen by around 130 basis points because of the turmoil to 12 per cent, to be around 320 basis points higher than the average rate for standard prime home loans. This increased cost of borrowing has been the primary channel by which the Australian economy has been affected by the global credit market turmoil.
The local securitisation market has also been temporarily dislocated. In part, this has resulted from the liquidation of a number of structured investment vehicles (SIVs) who had invested in fixed income products, particularly RMBS. As these SIVs were forced to unwind their positions, they sold their profitable Australian RMBS along with their loss-making US RMBS and CDOs. This resulted in an excess supply of RMBS in the local market at the same time as demand was reduced by the absence of the SIVs themselves. The resultant decline in the price has discouraged local buyers, despite their recognition that the price was very attractive and the product was very sound, because of concerns about recording mark-to-market losses should the price fall even further. The pricing in the secondary market, as well as the excess supply, effectively ruled out any new primary issuance.
The absence of the securitisation market has had a particularly significant effect on those institutions most reliant on it, which includes a number of the non-conforming lenders. These lenders have curtailed their flow of new lending and, in some cases, have temporarily suspended lending at all, but this decline has been met by other institutions so that the overall supply of housing credit has not been materially affected.
In recent weeks there are signs that this process might be drawing to a close with secondary market activity improving and indications that a number of primary issues will be coming to the market shortly.
4. Conclusion
While household debt levels in Australia and the US are broadly comparable, the composition and distribution of the debt is not. The sub-prime market is markedly smaller in Australia than it is in the US. Moreover, a number of features of the US sub-prime market which have contributed to its current problems are not present in Australia, including large teaser rates, a marked decline in lending standards, and an originate and distribute model where the originator has a reduced incentive to care about the quality of the loan written. As a result, arrears rates are significantly different in the two countries.
While the Australian financial system has had minimal direct exposure to the US sub-prime market, it has been affected by the global credit turmoil, particularly in the form of higher borrowing costs. However, the strength of the Australian banking system relative to those in a number of other countries, particularly the US, and the strength of the domestic economy more generally, has meant that the impact of the global turmoil has been relatively muted.
5. References
Ashcraft A and T Schuermann (2008), ‘Understanding the Securitization of Subprime Mortgage Credit’, Federal Reserve Bank of New York Staff Reports, No 318.
Battellino R (2007), ‘Some Observations on Financial Trends’, Address to Finsia-Melbourne Centre for Financial Studies, 12th Banking and Finance Conference, Melbourne, 25 September.
Bernanke B (2008), ‘Mortgage Delinquencies and Foreclosures’, speech at the Columbia Business School's 32nd Annual Dinner, New York, 5 May.
Case KE, JM Quigley and RJ Shiller (2003), ‘Home-buyers, Housing and the Macroeconomy’, in A Richards and T Robinson (eds), Asset Prices and Monetary Policy, Proceedings of a Conference, Reserve Bank of Australia, Sydney, pp 149–188.
Debelle G (2004), ‘Macroeconomic Implications of Rising Household Debt’, BIS Working Papers No 153.
Gerardi K, AH Shapiro and PS Willen (2007), ‘Subprime Outcomes: Risky Mortgages, Homeownership Experiences, and Foreclosures’, Federal Reserve Bank of Boston Working Papers No 07-15.
Green RK and SM Wachter (2007), ‘The Housing Finance Revolution’, paper presented at ‘Housing, Housing Finance, and Monetary Policy’, a symposium sponsored by the Federal Reserve Bank of Kansas City, Jackson Hole, 30 August–1 September.
Greenlaw D, J Hatzius, AK Kashyap and HS Shin (2008), ‘Leveraged Losses: Lessons from the Mortgage Market Meltdown’, paper presented at the US Monetary Policy Forum, conference is co-sponsored by the Initiative on Global Markets at the University of Chicago Graduate School of Business and the Rosenberg Institute for Global Finance at the Brandeis International Business School, New York, 29 February.
Rosengren ES, (2007), ‘Subprime Mortgage Problems: Research, Opportunities, and Policy Considerations’, speech at the Massachusetts Institute for a New Commonwealth (MassINC), Boston, 3 December.
Endnotes
I thank Patrick D'Arcy and Arlene Wong for their help with this paper. [1]
More detailed analyses can be found in Ashcraft and Schuermann (2008), Greenlaw, Hatzius, Kashyap and Shin (2008), and Geradi, Shapiro and Willen (2007), as well as recent speeches by Federal Reserve officials including Bernanke (2008). [2]
Strictly Alt-A refers to mortgage-backed securities referencing near-prime mortgage pools, but it has become common practice to refer to near-prime mortgages as Alt-A. We follow this practice here. [3]
Such fees are sometimes called ‘points’. [4]
From my own experience of living in the US in the 1990s, it was clear then that house prices were not the topic of popular conversation that they have been in Australia. Certainly there was almost no discussion of buying an investment property. When I returned to live in the US for a period in 2003, that had clearly changed. Property was the topic du jour. [5]
These data are available on the New York Federal Reserve website. [6]
The LoanPerfomance data on the New York Fed website (based on a sample of securitised sub-prime loans) provide the average initial interest rate (8.02 per cent) and the average current interest rate (9.04 per cent), and the share of loans reset (20 per cent as at December 2007). From these we back-out an estimate of the average post-reset interest rate (13.12 per cent). [7]
See Green and Wachter (2007) for a discussion of option pricing in mortgage markets. [8]
A recent speech by Chairman Bernanke (2008) has a very visual summary of the extent of house price falls across counties in the US. [9]
See for example, Battellino (2007), and Box B in the RBA's March 2007 Financial Stability Review. [10]