RDP 2024-08: Modelling Reserve Demand with Deposits and the Cost of Collateral 7. Results
November 2024
- Download the Paper 1.32MB
I estimate reserve demand using the following equation:
where the repo rate is measured in basis points, is an error term and remaining parameters are to be estimated. The estimation is done using an instrumental variable (IV) approach using ln(Reserves – OMO Repo + foreign deposits) as an instrument for the log of reserves in the first stage. The first stage has an adjusted R-squared of 0.99 and its F-statistic is significantly greater than 10 – suggesting a strong instrument. Table 1 presents results for Equation (9) as a build – column 1 shows the estimation when only reserves are included in the regression, then deposits and the indicator of collateral cost are added. Column 4 shows the regression output when estimated using OLS.
The estimated coefficients have expected signs. The coefficient on reserves implies that a doubling in the supply of reserves results in repo rates decreasing by approximately 5 basis points. The coefficient on deposits indicates that for a 10 per cent increase in deposits, repo rates increase by approximately 4 basis points. The inclusion of deposits increases the adjusted R-squared substantively.
| Reserves only | Reserves and deposits | Full model – IV | Full model – OLS | |
|---|---|---|---|---|
| Constant | 19.04 (13.32) |
−400.50*** (36.52) |
−377.30*** (32.18) |
−379.20*** (31.34) |
| ln(Reserves) | −2.40 (2.01 |
−6.33*** (0.86) |
−4.78*** (0.99) |
−4.91*** (0.97) |
| ln(Deposits) | 55.91*** (4.72) |
52.01*** (4.32) |
52.33*** (4.17) |
|
| Specials | −0.05** (0.02) |
−0.05** (0.02) |
||
| Observations | 46 | 46 | 46 | 46 |
| AIC | 266.8 | 196.1 | 190.5 | 190.5 |
| Adjusted R2 | 0.04 | 0.80 | 0.82 | 0.82 |
| Estimation | IV | IV | IV | OLS |
| Notes: *, ** and *** denote statistical significance at the 1, 5 and 10 per cent levels, respectively. HAC standard errors in parentheses. | ||||
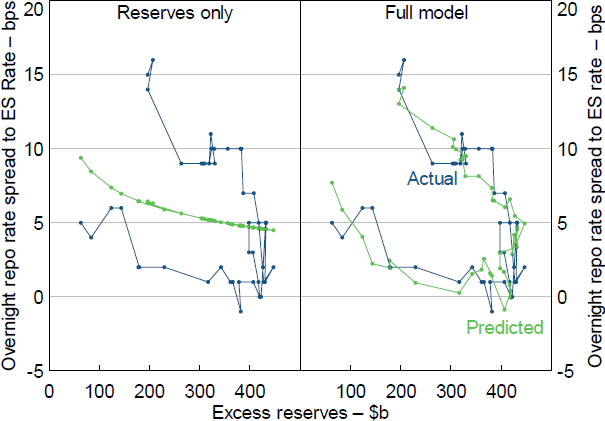
The simple model of reserve demand (Reserves only, Table 1) cannot explain the recent rise in repo rates (Figure 12, left panel). In contrast, the model including deposits and collateral cost (Full model – IV, Table 1) is able to explain the recent rise in repo rates (Figure 12, right panel). This suggests the demand curve for reserves has shifted to the right and that the shift can be explained by an increase in deposits.

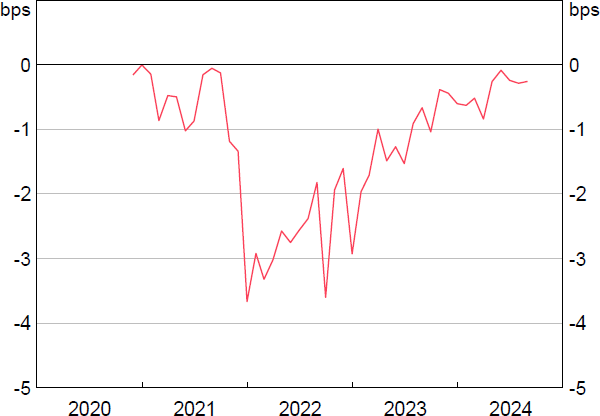
Including the cost of collateral materially improves model fit and passes the log likelihood test at a 1 per cent significance level. The coefficient on specials indicates that repo rates tend to decline when there is a decline in the supply of collateral – a 10 percentage point increase in repo volume which is special is associated with GC repo rates declining by 0.5 basis points. These estimates imply the cost of collateral was worth 4 basis points at its peak (Figure 13). Before the end of 2021 and in the most recent period, where collateral has not been in short supply, the value of collateral has been small – mostly less than 1 basis point. This contrasts with Lopez-Salido and Vissing-Jørgensen (2024) who estimate non-time-varying collateral dynamics to be worth approximately 3 basis points in the US repo market.

The inclusion of collateral cost decreases the coefficient on reserves (in absolute). A large part of the increase in reserves over the period was driven by the RBA's bond purchases which, in addition to increasing reserves, reduced the quantity of collateral available to the market – increasing the cost of collateral. When collateral cost is not accounted for in the regression, the coefficient on reserves is likely biased upward (in absolute) as it includes the effect of collateral cost on repo rates.
The difference in coefficients estimated using IV and OLS are small because the amount of full-allotment OMO repo and foreign client deposit movements over the estimation period has been relatively low and stable compared to the level of reserves. In other words, the sample period contains few shocks to demand which influence the quantity of reserves. Despite this, I prefer the IV estimates over OLS despite their slightly weaker precision, as even a small bias in the slope of the demand curve can have large impacts on the level of reserves which I qualify as ‘ample’.