RDP 2024-01: Do Monetary Policy and Economic Conditions Impact Innovation? Evidence from Australian Administrative Data Appendix A: Data Description
February 2024
- Download the Paper 1.23MB
Our survey measure of innovation is based on the definition of innovation:
An innovation is a new or improved product or process (or combination thereof) that differs significantly from the unit's previous products or processes and that has been made available to potential users (product) or brought into use by the unit (process). (OECD and Eurostat 2018, p 20)
This measure has been used in studies in Australia (DIIS 2016; Hendrickson et al 2018; Majeed and Breunig 2023) and overseas (OECD and Eurostat 2018), and has been shown to have a strong link with productivity.
| Mean | Median | Share | |
|---|---|---|---|
| Employment (FTE) | 293 | 14 | |
| Sales growth (%) | 6 | 3 | |
| Age of firms (years) | 25 | 18 | |
| Share of firms innovating (%) | 52 | ||
| Share of firms > five years old (%) | 81 | ||
| Share of firms where finance access hampers innovation (%) | 15 | ||
| Share of SMEs (%) | 78 | ||
| No of observations (ˋ000s) | 103 | ||
|
Sources: ABS; Authors' calculations. |
|||
| Mean | Median | Share | Mean | Median | Share | ||
|---|---|---|---|---|---|---|---|
| SMEs | Large firms | ||||||
| Employment (FTE) | 22 | 8 | 1,246 | 569 | |||
| Sales growth (%) | 6 | 3 | 8 | 4 | |||
| Age of firms (years) | 21 | 15 | 44 | 31 | |||
| Share of firms innovating (%) | 48 | 63 | |||||
| Share of firms > five years old (%) | 78 | 90 | |||||
| Share of firms where finance access hampers innovation (%) | 17 | 8 | |||||
| No of observations (ˋ000s) | 80 | 20 | |||||
| Exporters | Non-exporters | ||||||
| Employment (FTE) | 624 | 79 | 143 | 9 | |||
| Sales growth (%) | 5 | 3 | 7 | 3 | |||
| Age of firms (years) | 34 | 24 | 22 | 15 | |||
| Share of firms innovating (%) | 62 | 47 | |||||
| Share of firms > five years old (%) | 89 | 79 | |||||
| Share of firms where finance access hampers innovation (%) | 14 | 16 | |||||
| No of observations (ˋ000s) | 32 | 70 | |||||
| Foreign owned | Domestically owned | ||||||
| Employment (FTE) | 906 | 355 | 136 | 10 | |||
| Sales growth (%) | 6 | 4 | 6 | 3 | |||
| Age of firms (years) | 35 | 23 | 23 | 16 | |||
| Share of firms innovating (%) | 60 | 50 | |||||
| Share of firms > five years old (%) | 85 | 81 | |||||
| Share of firms where finance access hampers innovation (%) | 10 | 17 | |||||
| No of observations (ˋ000s) | 21 | 81 | |||||
|
Sources: ABS; Authors' calculations. |
|||||||

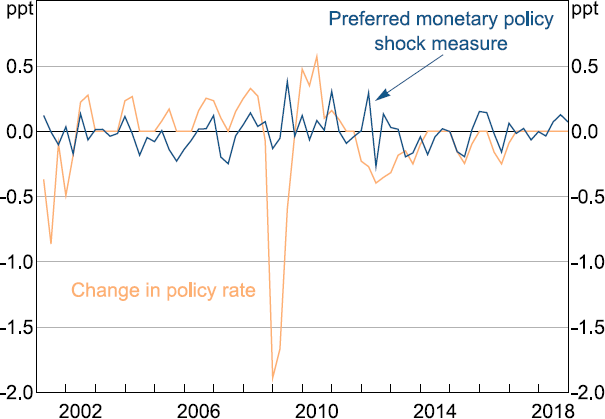
Sources: Authors' calculations; Beckers (2020); RBA.