RDP 2020-06: Consumer Payment Behaviour in Australia: Evidence from the 2019 Consumer Payments Survey 5. Payment Cards
September 2020
- Download the Paper 1,620KB
5.1 Credit and Debit Cards
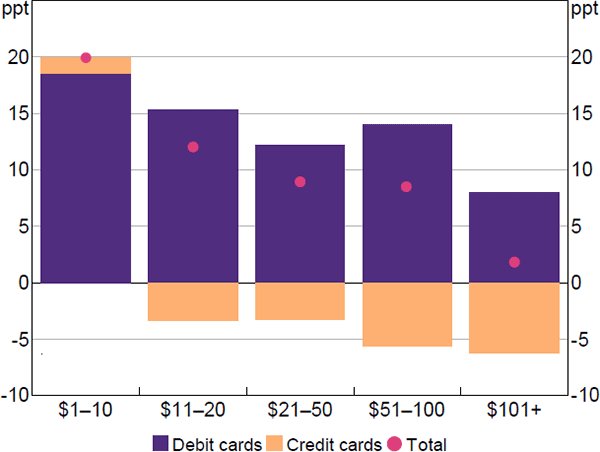
The vast majority of Australians have a payment card. In the 2019 CPS, 99 per cent of respondents reported that they held at least one debit and/or credit card, with half reporting that they held both types of card.[18] Australian consumers are increasingly using these cards instead of cash to make payments; between 2016 and 2019, the share of payments (by number) made using debit and credit cards increased by a further 10 percentage points, to 63 per cent.[19] While cards were used more frequently for transactions of all sizes than they were in the 2016 survey, the recent increase in relative card use was most pronounced for lower-value transactions. For example, the share of payments of $10 or less made using cards increased by 20 percentage points between 2016 and 2019 (Figure 14).
Source: RBA calculations, based on data from Ipsos and Roy Morgan Research
The rising popularity of cards reflects both changing consumer preferences and widespread acceptance of electronic payments by merchants. In terms of acceptance, a recent Reserve Bank survey found that 98 per cent of merchants accepted card payments (Delaney et al 2020, Box B). This high rate of acceptance is likely to partly reflect reductions in merchant acceptance fees over time, which in turn has been associated with Reserve Bank interchange and surcharging regulation (Occhiutto 2020).
When choosing to pay with a card, Australian consumers have increasingly been using debit cards, which allow people to make payments from funds in their deposit account. The share of all payments made using debit cards increased by a further 14 percentage points between 2016 and 2019 to 44 per cent. As a result, debit cards were the single most frequently used payment method by Australian consumers in 2019, overtaking cash. In 2019, debit cards also became the most frequently used payment method when measured by the value (rather than the number) of transactions, overtaking credit cards. Debit cards accounted for 36 per cent of the value of payments recorded in the diary week, compared to 25 per cent for credit cards. The increase in the frequency of debit card use was particularly significant for lower-value transactions and in-person payments. Participants in the 2019 CPS made 40 per cent of their in-person payments of $10 or less using a debit card, compared to 21 per cent in 2016.
In contrast, respondents used credit cards slightly less frequently than they did three years ago, with the share of credit card payments declining by 3 percentage points by both number and value between 2016 and 2019. Credit cards were used less frequently for transactions of most sizes, including for higher-value payments of $100 or more for which the share fell by 6 percentage points from the previous survey.
The decline in the popularity of credit cards compared to debit cards is consistent with changes in consumers' perceptions of the benefits of holding a credit card. Between 2016 and 2019, the proportion of credit card holders who perceived that they were ‘better off’ from having a credit card fell to 26 per cent (from 40 per cent) while an increasing share (19 per cent) said that credit card ownership left them ‘worse off’ (Figure 15).[20] Respondents who believed that credit cards left them worse off were significantly less likely to use them for purchases, making only 16 per cent of their payments with a credit card on average (versus 33 per cent for all credit card holders). In contrast, people who said they were better off by holding a credit card made half of all of their payments using a credit card. The change in respondents’ perceptions of the costs and benefits of holding a credit card is likely to partly reflect a reduction in the generosity of credit card rewards programs as well as changing attitudes towards accumulating this type of personal debt, particularly among younger consumers. Another factor has been the introduction in the mid 2000s of international scheme debit cards, which provide much of the same payment functionality as credit cards (e.g. the ability to make contactless and online payments). More recently, it is possible that the emergence of alternative ways of funding consumer purchases – such as buy now, pay later services – may have also played a role by providing an alternative way of smoothing spending for some consumers (see below).
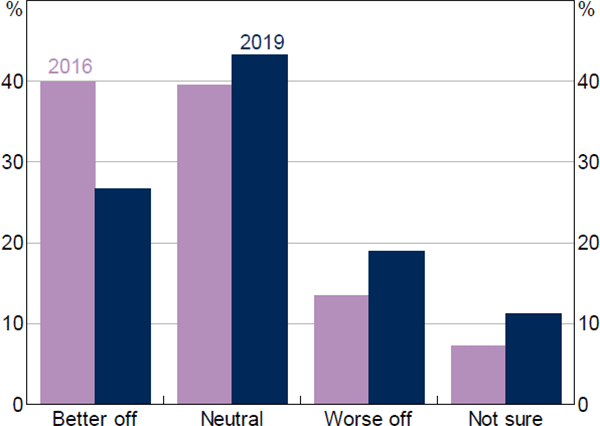
Note: Share of respondents answering the question ‘Considering both the monetary and non-monetary features of your card (e.g. annual fee, rewards, the interest you pay, the interest-free period, fraud protection, widespread acceptance, convenience, insurance, concierge services) ... Overall, how do you see the benefits and costs of owning your [credit] card?’
Source: RBA calculations, based on data from Ipsos and Roy Morgan Research
The rising popularity of debit cards relative to credit cards recorded in the CPS is consistent with aggregate data from the Reserve Bank's monthly RPS. The RPS show that the number of credit card accounts has been falling since 2018 and growth in debit card transactions has outpaced that of credit cards since the mid 2000s (Figure 16). These data also show the significant effect of the COVID-19 pandemic on consumer spending, with a sharp fall in transactions between February and April 2020.
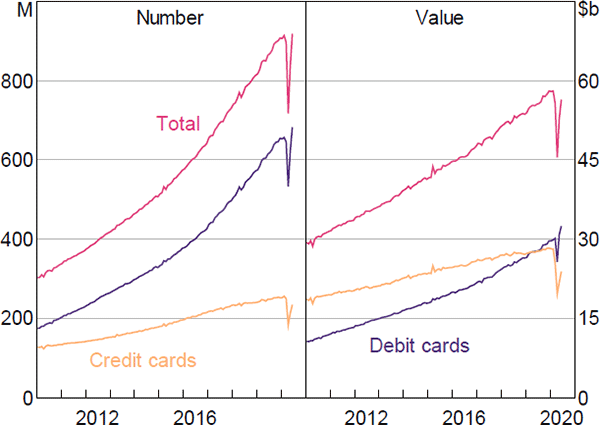
Notes: Includes all transactions made using Australian-issued cards, excludes transactions made on foreign-issued cards; changes in reporting methodology in May 2018
Source: RBA
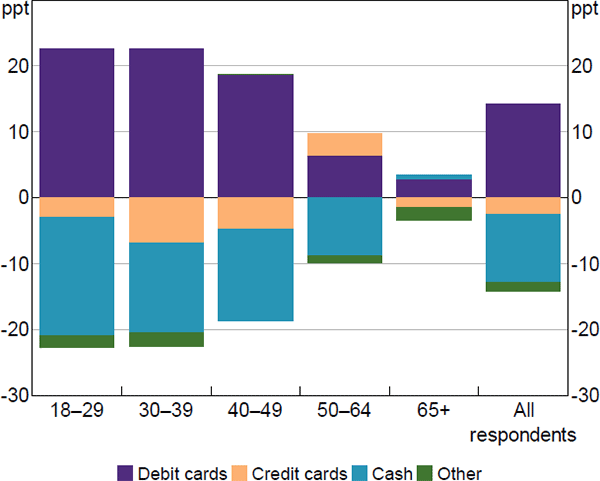
While consumers of all ages used debit cards more frequently than they did in the previous survey, the recent increase has been most pronounced among younger consumers. The share of payments made using debit cards by consumers aged under 40 increased by 23 percentage points between the 2016 and 2019 surveys (Figure 17). These respondents are increasingly using debit cards instead of cash and, to a lesser extent, credit cards for their everyday transactions.
As a result, consumers aged under 30 made just under 70 per cent of their payments using debit cards (Figure 18). While this partly reflects the fact that consumers in this age group are less likely than those in other age cohorts to hold a credit card, younger people that did own a credit card still made over half of their payments using a debit card.[21] In contrast, consumers aged 65 and over made around 20 per cent of their payments with a debit card, with relatively little difference in debit card use between those who held a credit card and those who did not.
Source: RBA calculations, based on data from Ipsos and Roy Morgan Research
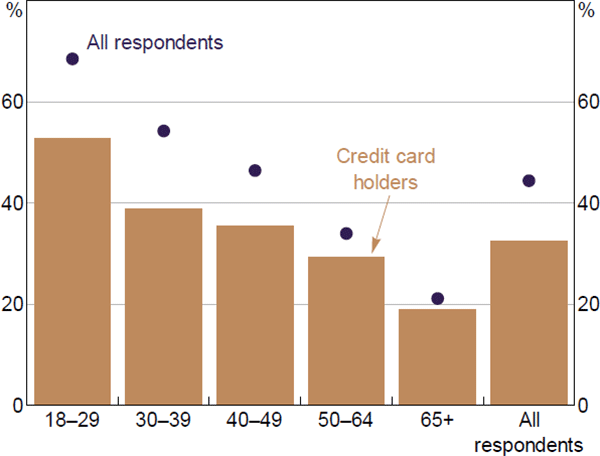
Source: RBA calculations, based on data from Roy Morgan Research
The share of payments made using cards increased across most broad merchant categories, and cards are now the most commonly used method of payment at many businesses (Table 4). As noted above, there has been a significant shift to contactless card payments from cash at smaller (non-supermarket) food retailers, such as cafés, pubs and takeaway food outlets. Between 2016 and 2019, the share of card payments at these businesses increased by 19 percentage points (to 62 per cent) as acceptance of cards for low-value payments has become common. The use of cards also continued to increase at supermarkets, with cards accounting for nearly three quarters of supermarket payments. Supermarkets were among the first businesses to introduce contactless card terminals in Australia in the early 2010s, so the recent increase in card use is likely to mostly reflect consumer preferences as well as greater use of self-service checkouts.
| 2007 | 2010 | 2013 | 2016 | 2019 | ||||||||||
|---|---|---|---|---|---|---|---|---|---|---|---|---|---|---|
| Cash | Card | Cash | Card | Cash | Card | Cash | Card | Cash | Card | |||||
| Payment value ($) | ||||||||||||||
| 1–10 | 95 | 4 | 91 | 7 | 78 | 18 | 62 | 32 | 45 | 52 | ||||
| 11–20 | 77 | 21 | 71 | 26 | 56 | 39 | 42 | 52 | 31 | 64 | ||||
| 21–50 | 55 | 40 | 50 | 43 | 37 | 54 | 28 | 61 | 22 | 70 | ||||
| 51–100 | 36 | 54 | 29 | 59 | 23 | 63 | 18 | 65 | 13 | 74 | ||||
| 101–500 | 30 | 51 | 20 | 53 | 14 | 59 | 14 | 62 | 10 | 64 | ||||
| 501+ | 19 | 49 | 14 | 41 | 7 | 51 | 11 | 50 | 3 | 52 | ||||
| Broad merchant categories | ||||||||||||||
| Supermarket | 60 | 39 | 54 | 46 | 38 | 59 | 31 | 63 | 24 | 74 | ||||
| Food retail | 90 | 10 | 85 | 14 | 72 | 27 | 55 | 43 | 36 | 62 | ||||
| Goods retail | 62 | 35 | 56 | 40 | 40 | 48 | 30 | 55 | 23 | 67 | ||||
| Transport(b) | 82 | 15 | 73 | 17 | 58 | 34 | 37 | 49 | 20 | 71 | ||||
| Petrol/service station | 45 | 51 | 43 | 54 | 31 | 66 | 29 | 67 | 23 | 76 | ||||
| Leisure/entertainment | 85 | 12 | 75 | 19 | 49 | 36 | 46 | 37 | 33 | 50 | ||||
| Holiday | 25 | 65 | 21 | 69 | 4 | 74 | 2 | 79 | 4 | 81 | ||||
| Bills(c) | 37 | 28 | 16 | 22 | 12 | 33 | 12 | 35 | 7 | 29 | ||||
| Services | 51 | 27 | 56 | 33 | 50 | 38 | 35 | 46 | 26 | 48 | ||||
| Other | 63 | 25 | 55 | 30 | 40 | 41 | 38 | 47 | 27 | 56 | ||||
|
Notes: (a) Excludes payments over $9,999, transfers (payments to family and friends) and automatic payments; cash and card percentages do not sum to 100 due to the use of other payment methods Source: RBA calculations, based on data from Colmar Brunton, Ipsos and Roy Morgan Research |
||||||||||||||
Overall, consumers appear to increasingly value convenience when making their day-to-day payments. When asked what influences their choice of payment method, 23 per cent of respondents said that ‘whatever I have with me’ was the most important factor for in-person payments, compared to 14 per cent in 2016 (Figure 19). For an increasing share of consumers, it appears that cards are more convenient than cash (which needs to be physically withdrawn from bank accounts – for example, by visiting an ATM – or cash holdings). Consumers were also more likely to nominate factors associated with debit rather than credit products. Between 2016 and 2019 more consumers nominated a preference for using own funds as their most important factor, while fewer nominated rewards points.
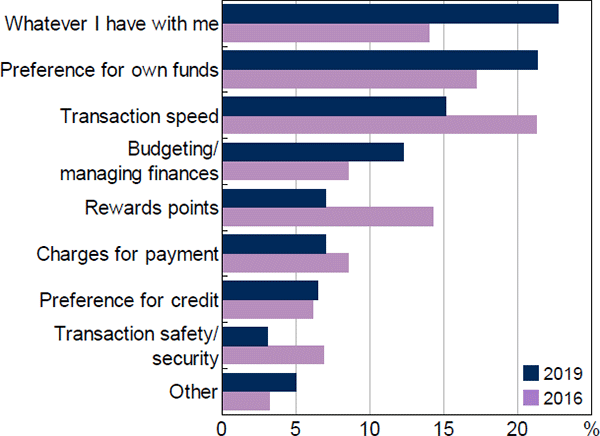
Source: RBA calculations, based on data from Ipsos and Roy Morgan Research
5.2 Contactless Card Payments and Mobile Wallets
The way in which consumers use their cards has changed significantly over the past decade or so. Most in-person card payments are now made using contactless functionality rather than by inserting the card into the terminal (and then entering a PIN), and consumers are increasingly storing their card details in mobile wallets.[22]
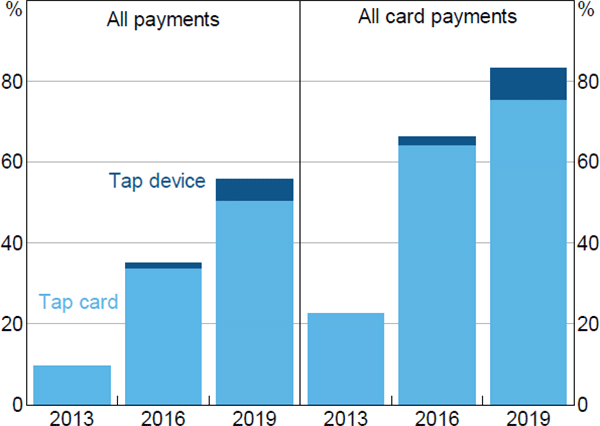
Contactless transactions – initiated by tapping either a physical card or mobile device – accounted for all of the growth of card payments at the point of sale relative to the previous survey. Around 50 per cent of in-person payments were made using a physical (plastic) card with contactless functionality in 2019, and a further 5 per cent using payment-enabled mobile devices (compared to a combined total of 35 per cent three years earlier) (Figue 20, left panel). The share of payments made using contactless functionality is likely to have further increased since the CPS was conducted in late 2019 because of changes in behaviour associated with COVID-19 by both consumers and merchants. Payment providers have facilitated a move to contactless transactions by (temporarily) increasing the transaction limit below which a PIN is not required for a contactless card payment from $100 to $200.
Source: RBA calculations, based on data from Colmar Brunton, Ipsos and Roy Morgan Research
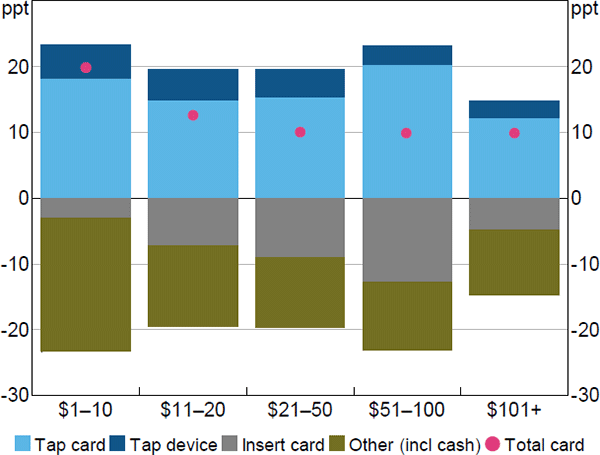
As noted, one of the implications of the widespread adoption of contactless functionality by consumers and merchants is that it has facilitated the use of cards for relatively low-value transactions. For example, the share of in-person payments of $10 or less made by tapping a card or device increased by a further 23 percentage points between 2016 and 2019, to 48 per cent (Figure 21). For payments of this size, consumers generally substituted from cash to contactless cards. Contactless payments are, however, generally displacing cash and ‘insert card’ options across a range of transaction sizes.
While most contactless payments were initiated by tapping a physical (plastic) credit or debit card on the card terminal at checkout, the use of mobile devices to make contactless payments has increased sharply from a low base. These payments are made by tapping or waving a smartphone or other payment-enabled mobile device (e.g. watch, ring or other ‘wearable’) in front of a card terminal, rather than using a physical card. Contactless device payments accounted for 8 per cent of in-person card payments in 2019, which was a notable increase from 1 per cent in 2016 (Figure 20, right panel). The increased adoption of contactless mobile payments is consistent with the wider availability of this payment option for consumers (e.g. via their financial institution's mobile banking app or a third-party provider), consumers' greater awareness of this payment method and widespread merchant acceptance of cards more generally. At the time of the 2016 survey, the ability to make mobile payments was still a relatively new feature of the retail payments system, whereas it is now a more common product offering across card issuers.[23] The availability of a range of devices equipped with mobile payment functionality has also increased in recent years.[24] Consistent with broader trends, it has become increasingly common for debit cards to be used for contactless mobile payments, with two-thirds of these payments using a debit card in 2019, compared with one-quarter in 2016.
Source: RBA calculations, based on data from Ipsos and Roy Morgan Research
The growth in mobile payments was driven by increased use among consumers aged under 40. Whereas around 10 per cent of all respondents in 2019 made at least one contactless mobile payment during the diary week, nearly 20 per cent of people under 40 recorded at least one such payment (Figure 22). These younger consumers who had adopted mobile payments made just over one-half of their in-person payments using this method, with users in most other age groups also making a significant share of their in-person payments this way (Figure 22).
The strong growth in mobile payments seen in the latest survey is likely to continue. When asked if they had card details stored in a mobile wallet, around 20 per cent of respondents said they did, with around 40 per cent of those aged under 40 reporting that they held card details in this way (Figure 23). While most mobile wallet users stored only one card in their wallets, a sizeable minority had stored more than one card. Moreover, nearly 90 per cent of CPS respondents indicated that they were aware of the ability to make tap-and-go payments via a payments-enabled mobile device (see Section 8.1). Some banks have recently been promoting the use of mobile payments in response to COVID-19.
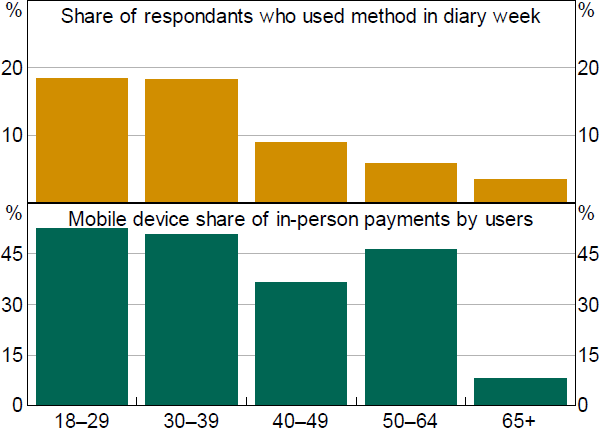
Source: RBA calculations, based on data from Roy Morgan Research
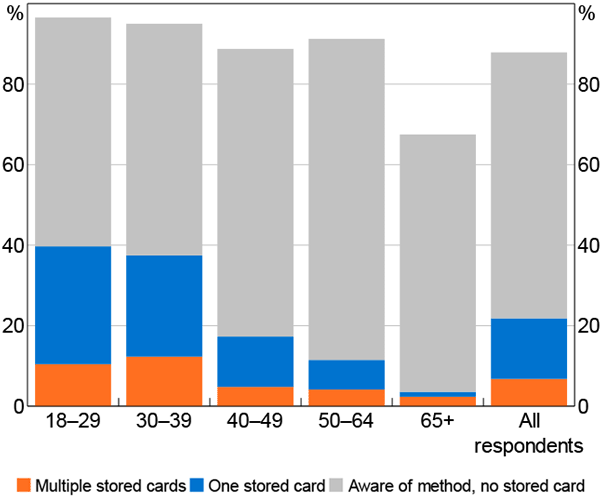
Source: RBA calculations, based on data from Roy Morgan Research
5.3 Surcharging of Card Transactions
The Reserve Bank's rules on surcharging allow businesses to recover the cost of accepting different card payments but prevent them from surcharging excessively.[25] To recover their costs, a merchant may apply an additional fee, or surcharge, for accepting particular card payments. Changes to the surcharging rules took effect for large merchants from September 2016 (and for small merchants in September 2017), which resulted in reductions in surcharges levied by merchants in some industries where concerns had been raised about excessive surcharges on some lower-value transactions. Most notably, the domestic airline industry moved from fixed-fee surcharges to a percentage-based surcharge with a fee cap, which had the effect of reducing the dollar value of surcharges on relatively cheap domestic flights.
The survey provided mixed evidence on developments in the frequency and size of surcharges which may reflect the small number of surcharges recorded and potential reporting issues.[26] CPS participants reported that a surcharge was paid on 4 per cent of card transactions on average in 2019 (Table 5). When measured as a percentage of the transaction value, the median surcharge was 1.5 per cent, which was 50 basis points higher than three years earlier, although in value terms, the median surcharge declined from 80¢ to 60¢. The reduction in the median surcharge amount is consistent with increased use of cards for lower-value purchases between 2016 and 2019.
A number of factors were associated with whether a surcharge was paid by consumers. These included the type of card used, the environment in which the payment was made (e.g. online or in-person) and the propensity to switch to a non-surcharged payment method (or merchant) when faced with a surcharge. The CPS indicated that surcharges were more often paid on credit card payments (5 per cent of transactions) than on debit cards (3 per cent), which is consistent with credit cards tending to be more expensive for merchants to accept than debit cards and therefore more likely to be surcharged (Occhiutto 2020). Consumers who held a credit card that offered rewards points – which tend to be relatively expensive for merchants to accept – were also more likely to have paid a card surcharge than those who owned a non-rewards credit card.
Consistent with previous survey waves, it was more common for respondents to have paid a surcharge for online card payments (8 per cent) than in-person payments (3 per cent). This difference could partly be because consumers are more likely to have a ready alternative to cards for in-person payments, that is, cash. Online transactions are also sometimes more expensive for merchants to accept.
| Per cent of card payments where a surcharge was paid | |
|---|---|
| All card payments | 3.9 |
| Credit cards | 5.0 |
| Debit cards | 3.4 |
| Reward cardholder status | |
| Owns a rewards card | 5.7 |
| Does not own a rewards card | 2.9 |
| By payment channel | |
| In-person | 3.2 |
| Online | 8.4 |
|
Note: Excludes payments over $9,999, transfers (payments to family and friends) and automatic payments Source: RBA calculations, based on data from Roy Morgan Research |
|
The 2019 CPS also asked respondents about their typical response when they know that a merchant levies a surcharge on some payment methods. Around 50 per cent of respondents indicated that faced with a surcharge they would instead choose a non-surcharged method to make the payment. This indicates that there is typically scope for merchants to encourage consumers to switch to a different, lower-cost payment method by applying a surcharge on certain payments. A further 21 per cent of respondents said they would pay a surcharge to use their preferred payment method and around 25 per cent would avoid shopping at that merchant (Figure 24). The possibility of losing business is likely to help explain why many merchants choose not to apply a surcharge on card payments.
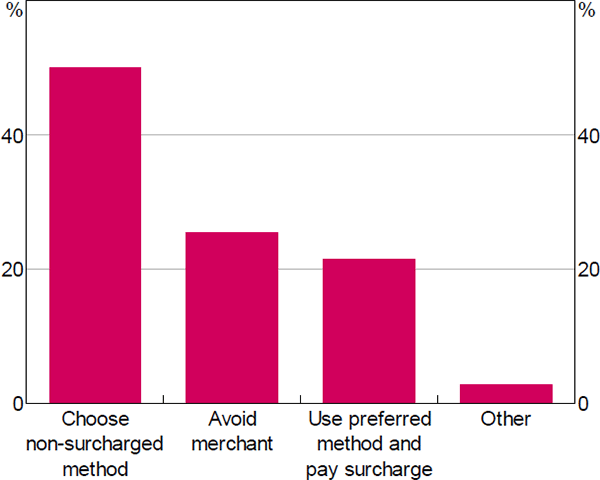
Source: RBA calculations, based on data from Roy Morgan Research
Footnotes
In response to COVID-19, the banking industry announced in April 2020 that banks would send debit cards to Australian account holders who did not have a linked debit card (e.g. passbook holders). In the 2019 CPS, 95 per cent of respondents reported that they had a debit card. [18]
Note that ‘card payments’ in this paper generally refer to transactions where respondents reported that they directly used a physical (plastic) debit or credit card or a card stored in a mobile wallet. Where payment cards are used indirectly, such as using a linked card via PayPal or a buy now, pay later service, the payment is captured in data for that payment method rather than as a card payment. For comparability with previous surveys, prepaid/gift cards are not included in the figures cited for debit and credit card payments; these cards were used for less than 1 per cent of the number of payments in the 2019 CPS. [19]
The question asked of credit card holders was: ‘Considering both the monetary and non-monetary features of your card (e.g. annual fee, rewards, the interest you pay, the interest-free period, fraud protection, widespread acceptance, convenience, insurance, concierge services) ... Overall, how do you see the benefits and costs of owning your [credit] card?’; Doyle (2018) explores the real (rather than perceived) financial impact of credit card ownership and use. [20]
Of respondents aged under 30, 32 per cent owned a credit card versus 63 per cent of respondents aged over 30. [21]
A mobile wallet is an application on mobile devices like smartphones that stores card details and allows in-person payments to be made by using the near field communication (NFC) functionality of the mobile device by tapping the device on or near a compatible terminal. Mobile wallets can sometimes also be used to make online payments. [22]
In the past few years, many card issuers have allowed their cards to be used in the mobile wallet applications provided by Apple, Samsung and Google, for example. [23]
Examples include watches, rings, clothing and coffee cups. [24]
These rules are enforced by the Australian Competition and Consumer Commission. See Dark et al (2018) for a discussion of surcharging regulations in Australia. [25]
See Section 4.4 in Doyle et al (2017) for a discussion of the 2016 CPS results on surcharging. [26]