RDP 2017-04: How Australians Pay: Evidence from the 2016 Consumer Payments Survey 7. Other Types of Payments
July 2017
7.1 Online Payments
The latest CPS showed that the share of payments made online was about the same in 2016 as it was three years earlier.[28] However, these online purchases are increasingly being made by mobile phone, with around one-fifth of online retail payments made using a mobile phone in 2016, compared with 6 per cent in 2013 (Table 7).
| 2007 | 2010 | 2013 | 2016 | |
|---|---|---|---|---|
| Online payments as a per cent of total payments | ||||
| Number | 3 | 7 | 13 | 13 |
| Value | 13 | 26 | 36 | 39 |
| Per cent of number of online payments by channel(a) | ||||
| PC/tablet | na | na | 94 | 80 |
| Mobile phone | na | na | 6 | 20 |
|
Notes: Excludes payments over $9,999, transfers (payments to family and
friends) and automatic payments Source: RBA calculations, based on data from Colmar Brunton, Ipsos and Roy Morgan Research |
||||
Growth in the use of mobile phones to make online purchases was more pronounced at certain types of merchants than others. Notable examples include food retailers and transport services, which may be associated with increased use of mobile apps – which allow in-app payments – in these sectors.
Cards accounted for about 40 per cent of the number of online payments in 2016 – a similar share to that recorded in 2013. Debit cards and credit cards were used evenly, but credit cards tended to be used for larger purchases. The share of payments using PayPal increased to 25 per cent of online payments, from 19 per cent in 2013 and 10 per cent in 2010.[29] Between 2013 and 2016, growth in the use of PayPal was mostly driven by online purchases made on mobile phones. BPAY and internet banking transactions accounted for the bulk of remaining online payments.
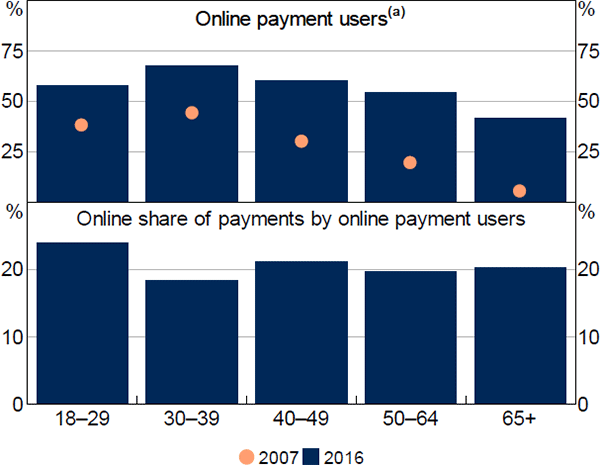
The share of participants that made at least one online payment during the survey week has doubled since 2007, to 56 per cent in 2016. Online payments continue to be made most frequently by younger respondents, although consumers of all ages appear to be adopting online payments (Figure 23, top panel). For example, around 40 per cent of respondents aged 65 and over used online payments in the 2016 diary week, compared with 5 per cent in 2007. As with contactless cards, older respondents who had adopted online payments made a similar share of their payments online as consumers in other age groups (Figure 23, bottom panel).

Note: (a) Share of respondents who made at least one payment online during the week of the survey
Source: RBA calculations, based on data from Ipsos and Roy Morgan Research
7.2 Automatic Payments
Respondents were asked to record details about the automatic payments they made during the week in the post-survey questionnaire. These payments include electronic ‘pay anyone’ or BPAY payments that are withdrawn from a savings or credit card account at regular intervals, and can be set up through internet banking. They also include direct debits, where an individual gives prior authorisation to a merchant for payments to be automatically deducted from their savings or credit card account.
Around two-thirds of respondents had at least one automatic payment arrangement – a similar share to that recorded in previous surveys.[30] These arrangements are a convenient way for people to pay recurring bills (e.g. rent, phone and utility bills) or make regular debt repayments (e.g. mortgage or credit card repayments). Together, bill payments and debt repayments accounted for three-quarters of all automatic payments recorded by respondents. Accordingly, the median value of automatic payments ($66) was higher than the median value of non-recurring payments ($23).
The latest CPS also indicates that people are using automatic payments more frequently than they did in 2013. Automatic payments accounted for 16 per cent of the value of respondents' total expenditure during the week, compared with 11 per cent in 2013. Between 2013 and 2016, the share of bill payments (by number) made automatically increased by 17 percentage points to 40 per cent (Table 8). The increased use of automatic payments (particularly for bill payments) may reflect consumers becoming more familiar with this means of payment (and online payments more generally) and valuing the convenience that it offers for recurring payments.[31]
| Number | Value | ||||
|---|---|---|---|---|---|
| 2013 | 2016 | 2013 | 2016 | ||
| Automatic | 23 | 40 | 20 | 26 | |
| Non-automatic | |||||
| BPAY | 28 | 21 | 25 | 24 | |
| Debit, credit/charge cards | 26 | 21 | 28 | 27 | |
| Bank transfer | 9 | 7 | 13 | 14 | |
| Other(a) | 14 | 10 | 13 | 9 | |
| Total | 100 | 100 | 100 | 100 | |
|
Notes: Excludes payments over $9,999 Source: RBA calculations, based on data from Colmar Brunton and Ipsos |
|||||
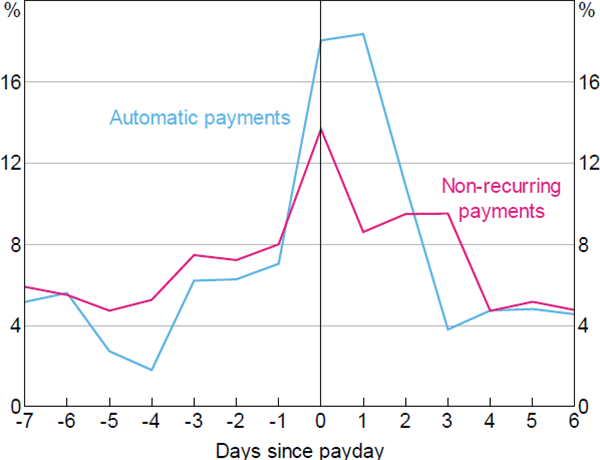
The 2016 CPS, for the first time, also asked respondents who receive regular income payments from employment or other sources (e.g. a pension) to record the date of their most recent payday and how often they get paid (i.e. weekly, fortnightly or monthly). Combining this information with data on the transaction date of payments made by respondents provides an insight into how people organise the timing of their payments. Like other studies that find a response of spending to the arrival of anticipated income, the CPS shows that people tend to spend more on their payday and the day or two after, relative to their average level of daily spending (Figure 24). However, this increase in spending was more pronounced for automatic payments than for nonrecurring spending. That is, people tend to organise their automatic payments to coincide with the receipt of regular income.[32]

Notes: Payments under $1,000; respondents who have a weekly or fortnightly payday
Source: RBA calculations, based on data from Ipsos
7.3 Person-to-person Payments
Person-to-person payments to family and friends (transfers) have remained stable as a share of total consumer payments since 2013, accounting for about 2 per cent of total payments by number, and 6 per cent by value. A higher share of person-to-person payments was, however, made using mobile phones in 2016 (Table 9). Despite this, the majority of these payments were still made face-to-face, and cash continued to be the most common way of making in-person payments. About half of person-to-person cash payments were made by respondents with children at home, suggesting that many of these payments were likely to be ‘pocket money’ payments to children.
| 2013 | 2016 | |
|---|---|---|
| Per cent of number of person-to-person payments by channel | ||
| Face-to-face | 58 | 50 |
| PC/tablet | 31 | 32 |
| Mobile phone | 10 | 18 |
| Telephone/mail | 1 | 1 |
| Per cent of number of person-to-person payments by method | ||
| Cash | 55 | 50 |
| Bank transfer | 35 | 47 |
| Other(a) | 11 | 4 |
|
Notes: Excludes payments over $9,999; percentages may not add to 100 due to
rounding Source: RBA calculations, based on data from Colmar Brunton and Ipsos |
||
Looking ahead, the NPP, which is due to be launched around the end of 2017, is likely to provide additional convenient electronic alternatives for making person-to-person payments. When in full operation, the NPP will offer some of the characteristics of cash that are valued for person-to-person payments, including being able to make a payment immediately.[33] Accordingly, it would not be surprising if the share of person-to-person payments made in cash declines further in coming years. However, certain types of transfers, such as pocket money payments to children, could remain a ‘sticky’ use for cash partly because relatively few electronic payment methods are available to younger children.
Footnotes
If automatic payments (which are typically set up using the internet) are included, the share of total payments made online increased from 16 per cent to 19 per cent between 2013 and 2016. Automatic payments are discussed in Section 7.2. [28]
As a share of all (online and in-person) payments, PayPal increased from 2.5 per cent to 3.4 per cent of the number of payments between 2013 and 2016. [29]
Changes between 2013 and 2016 are likely to reflect both the trend towards increased use of automatic payments and a change in how the question was asked. In 2016, respondents were specifically asked to record both direct debits and recurring ‘pay anyone’ transactions. In 2013, they were asked only about direct debits. [30]
In addition, some billers (e.g. energy retailers and insurers) now offer discounts for paying by direct debit. [31]
This result is consistent with Gelman et al (2014), who use a high-frequency payments database for consumers in the United States. They find that 40 per cent of the excess sensitivity of total spending to the receipt of regular income can be explained by the coincident timing of regular income and recurring (automatic) payments. [32]
The NPP will allow individuals and businesses to make account-to-account funds payments in real time, at any time of the day or night, seven days a week. [33]