Financial Stability Review – October 2017 2. Household and Business Finances
The key domestic risks in the Australian financial system continue to stem from household borrowing. Household indebtedness, most of which is mortgage borrowing, is high and gradually rising against a backdrop of low interest rates and weak income growth. While some households have taken advantage of low interest rates to make excess mortgage payments, others have increased their borrowing. Higher interest rates, or falls in income, could see some highly indebted households struggle to service their debt and so curtail their spending. Recent regulatory actions have been taken to build the resilience of authorised deposit-taking institutions (ADIs) and borrowers to ensure that borrowers could service their mortgage with higher mortgage rates. These actions include limiting the growth of interest-only lending and emphasising that banks should also limit other forms of higher-risk lending. These measures have already seen significant declines in the share of interest-only lending. Since their introduction, there has been some moderation in housing market conditions.
Strong demand for housing over recent years has contributed to a large increase in apartment construction. Substantial additions to the stock of apartments in particular locations raise the possibility of price falls as the new stock is absorbed. To date the adjustment has been orderly with the rate of price decline slowing in Brisbane and prices falling a little in inner-city Melbourne. While there have been some reports of settlement delays, there is little evidence of settlements actually failing. In Brisbane, however, apartment market conditions are relatively weak, with declining prices and no growth in rents.
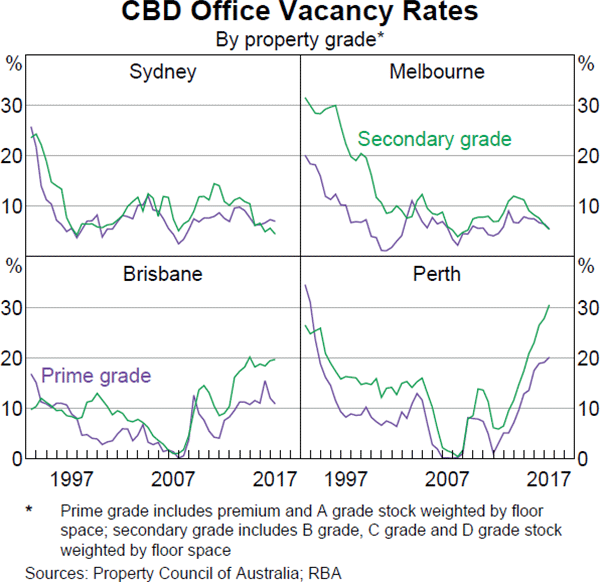
The Bank is continuing to closely monitor conditions in non-residential commercial property markets. Growth in commercial property prices in Sydney and Melbourne continues to exceed that in rents, and office vacancies are elevated in the cities with greater exposure to the mining sector, especially in Perth. In other parts of the business sector, conditions remain generally favourable, with corporate profitability relatively high and gearing at relatively low levels. However, the economic slowdown in mining-exposed areas has seen business failure rates in Western Australia and Queensland rise to above those of the other Australian states, although they are still at a generally low level.
Household Sector
Mortgage and housing markets
A core area of focus has been trends in household borrowing, with most of that borrowing for the purpose of housing. Regulators have responded to the build-up of risk associated with household mortgage lending with a sequence of measures. These have aimed to increase household and banking sector resilience by improving the quality, and balancing the composition, of housing sector lending. In particular, there has been greater regulatory focus on ADIs' lending standards, prompting lenders to strengthen a range of serviceability standards, such as interest-rate buffers to assess serviceability, the assessment of minimum living expenses and discounting less stable income sources. The Australian Prudential Regulation Authority (APRA) is continuing its focus on serviceability standards, resulting in many new borrowers now having greater buffers against income losses or higher interest rates.
APRA announced further regulatory actions on 31 March, after discussions by the Council of Financial Regulators. For all ADIs, a 30 per cent cap on interest-only loans as a share of loan originations was imposed, and the 10 per cent benchmark on investor credit growth, imposed in December 2014, was reaffirmed. Deposit requirements were raised by strengthening prudential expectations regarding banks' limits on high-LVR interest-only loans and increasing scrutiny of serviceability assessments.
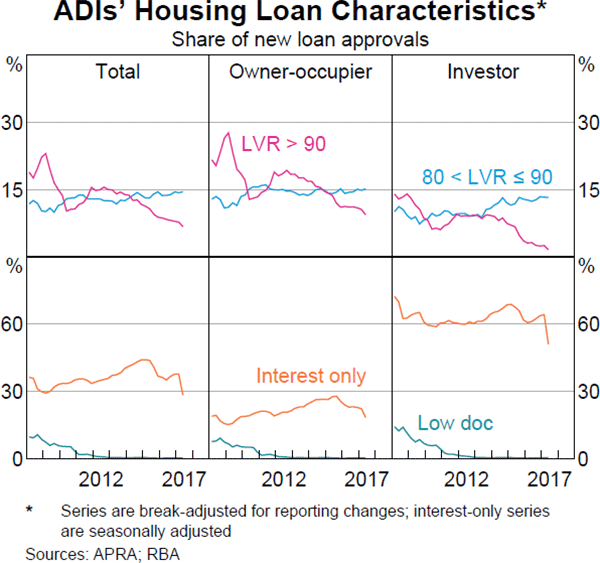
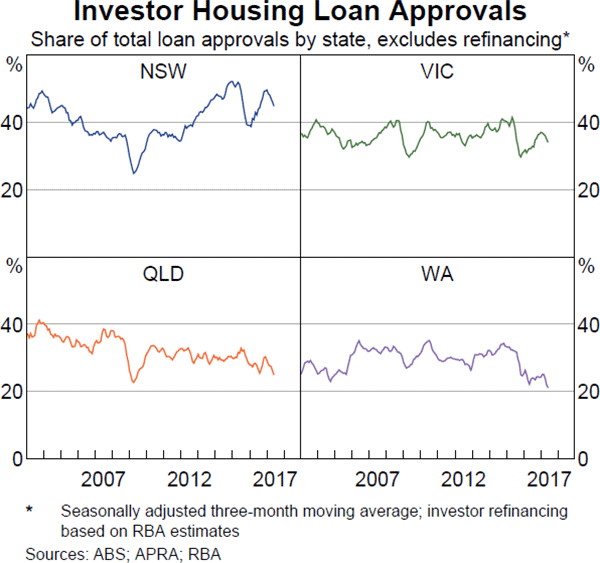
ADIs have changed their lending conditions in response to the latest APRA measures. ADIs have increased interest rates on investor and interest-only loans, and allowed existing interest-only borrowers to switch to principal-and-interest (P&I) loans at no cost. Lenders have also lowered maximum LVRs on interest-only loans, both for owner-occupiers and investors. Interest-only loans as a share of new approvals fell sharply in the June quarter, and the outstanding stock of these loans has declined (Graph 2.1). The combination of a renewed focus on the 10 per cent benchmark on investor lending and the cap on interest-only loans (which are more commonly used by investors) has contributed to the recent significant moderation in investor credit growth across all states (Graph 2.2).
While these regulatory measures should help make household and bank balance sheets more resilient, they will constrain some types of (potential) borrowers. In particular, some households will not be able to borrow as much as previously, though their smaller loan will be more manageable.[1] In addition, some households may find it more difficult to obtain finance for apartments purchased off the plan some time earlier, which could, in particular, affect some apartment markets such as Brisbane that are adjusting to large increases in supply.
Some borrowers, including investors, could experience increased financial stress as a result of higher repayments from either switching to a P&I loan, or higher interest rates if they retain an interest-only loan (for a discussion of the characteristics of investors and their borrowing, see ‘Box B: Households' Investment Property Exposures: Insights from Tax Data’). However, most borrowers should be able to absorb these changes given progressive improvements in lending standards since the financial crisis. For loans taken out over more recent years, the initial serviceability assessment would have been rigorously based on the higher repayments required after the interest-only period and also include a larger buffer against interest rate rises. Further, given the decline in interest rates over recent years, most households with older loans would have initially borrowed at rates that were higher than current interest rates.
Housing market conditions appear to have eased in recent months. In Sydney and Melbourne, housing price growth has slowed and auction clearance rates have fallen (Graph 2.3). A range of factors have contributed to the slowing, including increased housing supply, higher interest rates for some borrowers, and an apparent reduction in demand from foreign buyers. In Melbourne, these factors appear to have offset the impact of strong migration flows into Victoria, both from overseas and interstate.
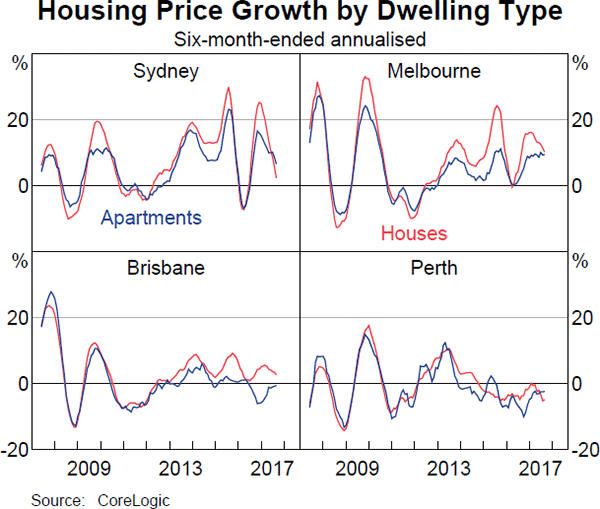
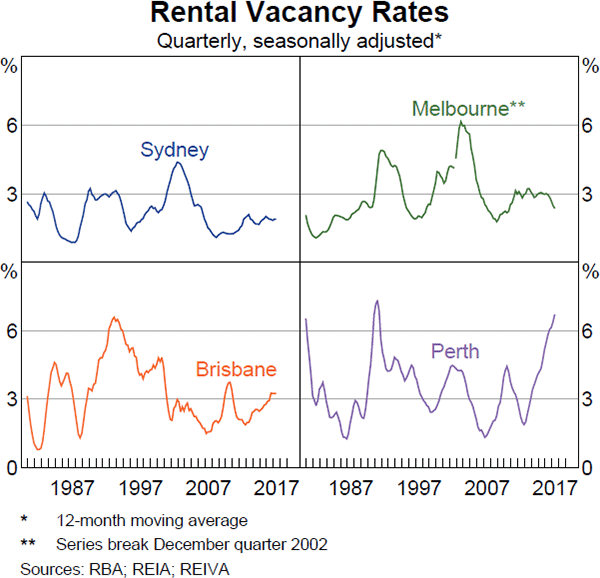
Nationally, apartment prices have continued to record weaker price growth than detached housing, consistent with the increased relative supply of apartments. Some concerns remain about the process of absorbing the substantial increase in new apartments in Brisbane. Brisbane apartment prices continue to fall, although the rate of decline has slowed, and apartment prices in inner-city Melbourne have been falling. Weak conditions in Western Australia and a significant increase in new apartment building in Brisbane have increased the potential for further localised housing price corrections. In Perth, the vacancy rate is the highest in 25 years and more than double the average of other capital cities (Graph 2.4). The constraints on mortgage finance could compound the weakness in some localised property markets.
Households' financial position
While most indicators of household financial stress remain fairly benign, there are some concerns. The aggregate debt-to-income ratio is high (Graph 2.5). Households with high debt burdens could be vulnerable to financial stress if they experience large declines in income (see ‘Box C: Large Falls in Household Income’). At the same time household net wealth has been rising, and has been growing of late at an above-average pace, driven primarily by housing and superannuation assets.
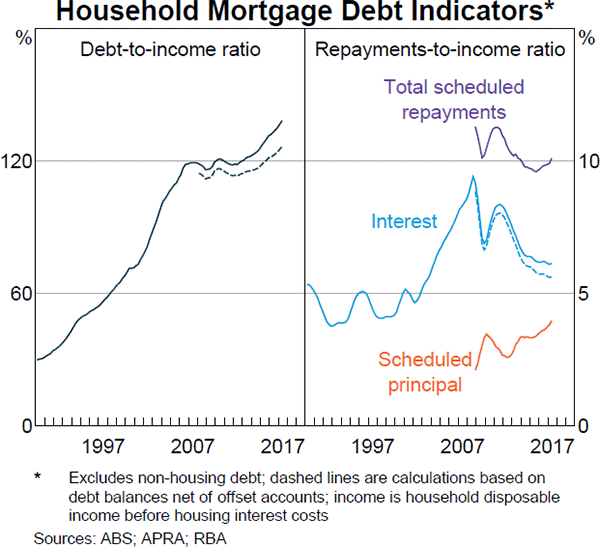
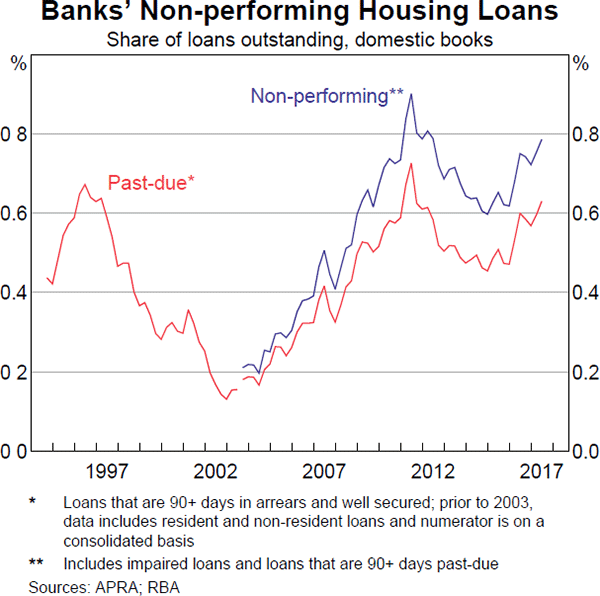
Improvements in lending standards over recent years should have increased household resilience and low mortgage rates have contained debt-serviceability metrics. In line with these developments, Census data suggest that the share of indebted owner-occupier households making mortgage payments at or above 30 per cent of gross income declined from 28 per cent in 2011 to around 20 per cent in 2016 (around ½ million households). However, the Census data overstate debt-servicing requirements as they include households' voluntary prepayments. Other indicators of repayment stress such as the ‘50/40’ measure of the share of households in the lowest 40 per cent of income earners making total mortgage payments – required and prepayments – above 50 per cent of their income, show a similar trend (Graph 2.6). The overall share of non-performing housing loans has also declined between 2011 and 2016 and remains low at around 0.8 per cent, although it is rising somewhat of late primarily due to trends in the more mining-exposed areas (Graph 2.7; see also ‘The Australian Financial System’ chapter). The recently released 2015/16 Household Expenditure Survey shows that the number of households experiencing financial stress has steadily fallen since 2003/04.
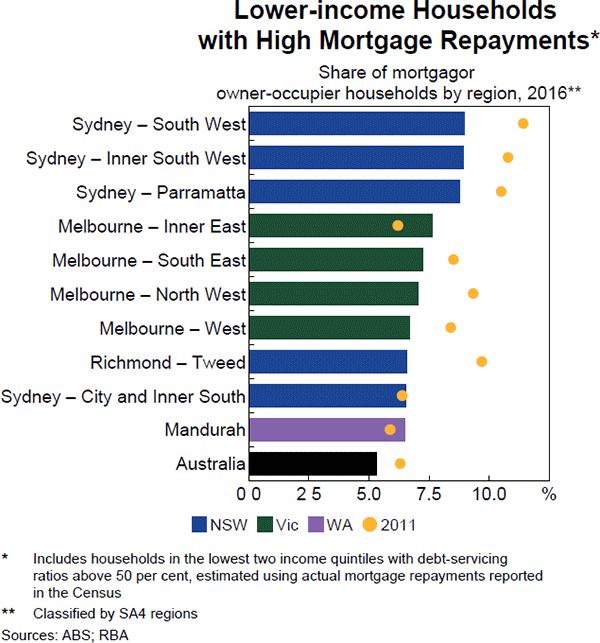
Further, although aggregate measures of household financial stress are little changed over the past year, conditions vary across states and regions. Recent ABS estimates suggest that the share of households making high mortgage repayments (both required and excess payments into offset and redraw accounts), while lower than in 2011, remains relatively high in some parts of Sydney and Melbourne. And weak economic conditions, underemployment and falling housing prices present ongoing challenges to households in some regions with greater exposure to mining activity. The rate of personal administrations in Western Australia rose further over the first half of 2017 and remains elevated in Queensland, and applications for property possessions have increased over recent years in Western Australia.
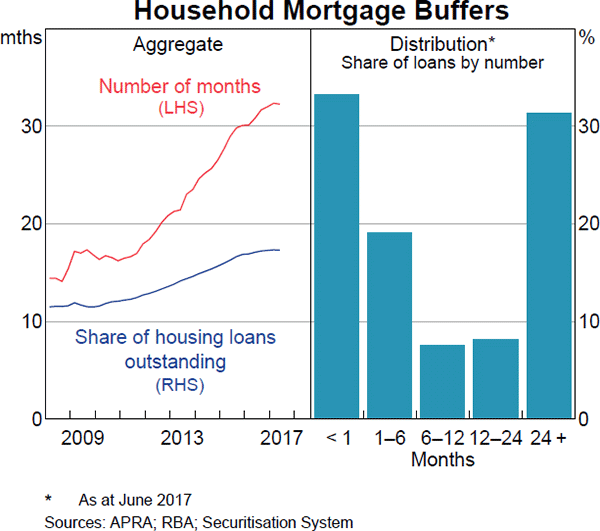
Prepayments are an important dynamic in the Australian mortgage market as they allow households to build a financial buffer to cushion mortgage rate rises or income falls. Aggregate mortgage buffers – balances in offset accounts and redraw facilities – remain around 17 per cent of outstanding loan balances, or over 2½ years of scheduled repayments at current interest rates (Graph 2.8; left-hand side). These aggregates, however, mask substantial variation; about one-third of mortgages have less than one months' buffer (Graph 2.8; right-hand side). Not all of these are vulnerable given some borrowers have fixed rate mortgages that restrict prepayments, and some are investor mortgages where there are incentives to not pay down tax deductible debt. This leaves a smaller share of potentially vulnerable borrowers with new mortgages who have yet to accumulate prepayments, and borrowers who may not be able to afford prepayments. Partial data suggest that the share of households with only small buffers has declined in recent years, in part due to declines in mortgage rates. Households with small buffers also tend to be lower-income or lower-wealth households, which could make them more vulnerable to financial stress.
Commercial Property
Residential development
Recent Reviews have highlighted the potential risks posed by the large pipeline of apartment construction in some areas. So far, the areas where new apartments have represented a larger proportionate addition to supply, particularly in pockets of inner-city Melbourne and in Brisbane, have not experienced significant disruption (Graph 2.9). In inner-city Melbourne, strong population growth has helped to absorb the new supply, with vacancy rates declining and apartment prices only falling a little (Graph 2.10). In Brisbane, for some lower-quality apartments, valuations at settlement have declined relative to the purchase price. In contrast, valuations for high-quality apartments, or those mostly marketed to owner-occupiers, continue to be realised at or above the purchase price. In Sydney there are reports of small declines in prices in a few apartment development projects.
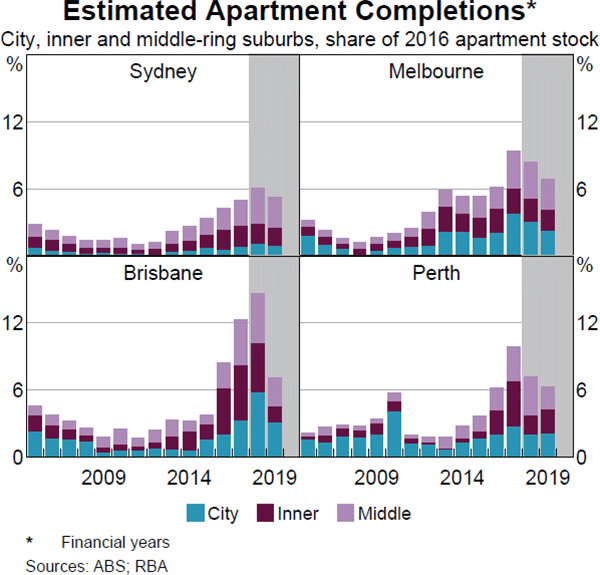
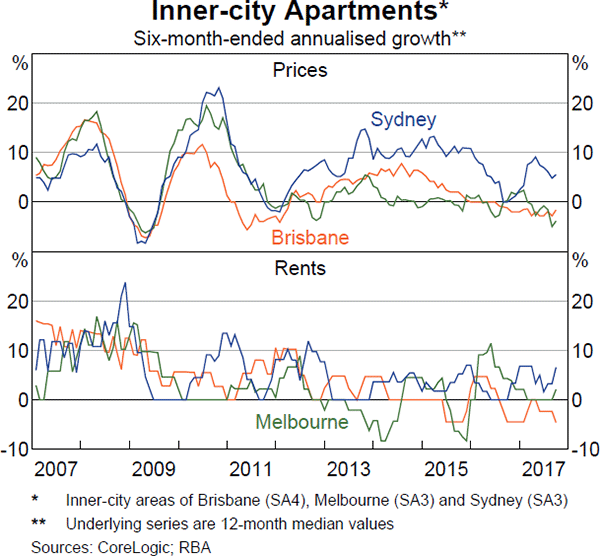
To date, the adjustment in the Brisbane apartment market has not resulted in significant stress. Settlement failures appear to have remained in line with historical norms, although the peak of new supply is yet to come. Some developers, however, report that tighter financing conditions are contributing to delays in the settlement of off-the-plan purchases, as valuations below the purchase price reduce the amount banks will lend. In liaison, industry participants and banks express confidence that the Brisbane market will continue to absorb the new supply despite tighter financing conditions for buyers. Continued weakness in rents, and so rental income, remains a debt-servicing risk for investors.
Developers' access to bank finance for new projects has tightened over the past year, particularly in areas where a large volume of new supply has yet to come on line. As a result, some developers have turned to non-bank lenders for finance, which liaison indicates is generally more expensive than bank financing. Building approvals for new projects in Brisbane and Melbourne have fallen from their recent highs. In Perth, builders and developers face weak demand for new dwellings. Several small to medium builders – including those involved in commercial or multi-unit developments – have filed for bankruptcy in Perth and Brisbane, and market analysts anticipate more failures in coming months.
Other commercial property
As in many other countries, strong demand for commercial property has seen prices rise and yields fall (Graph 2.11). Despite this, yields on commercial property in Australia remain high internationally, attracting foreign and domestic investors. But if these higher commercial valuations are not sustained, say because of a marked increase in global long-term interest rates, highly leveraged investors close to the maximum LVR covenants on bank debt could become vulnerable to breaching loan covenants. Typically, they could then be required to provide additional equity to reduce the LVR below the maximum, potentially triggering sales and further price falls.
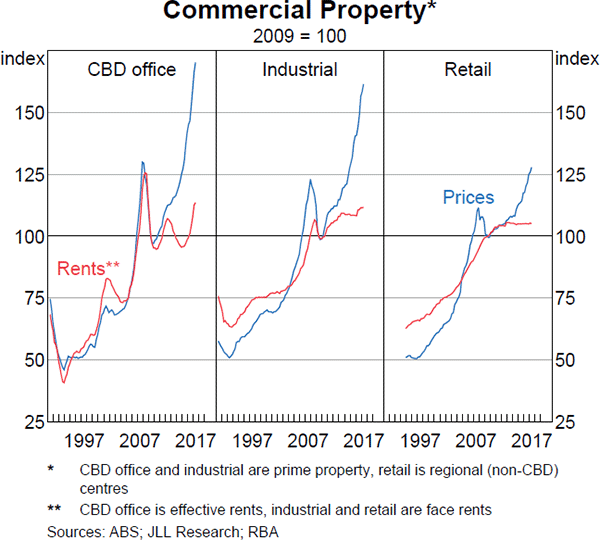
Conditions in commercial property markets vary significantly by state and property type. Investor demand remains strongest in Sydney and Melbourne where the prices of office and industrial properties have risen substantially. In contrast, Brisbane office prices have remained flat, while prices in Perth have edged lower and conditions remain difficult. In Brisbane, Perth and Adelaide, elevated office vacancy rates and falling rents have seen tenants relocate into better quality office space. This continues to place pressure on secondary-grade markets where the outlook remains weak (Graph 2.12).
Conditions in retail property markets across Australia have been relatively subdued. Rents have been flat and price growth has lagged that of other commercial property segments. Liaison with industry suggests that strong competition in the retail sector, particularly from online and new entrants, is compressing retailers' margins, constraining their ability to accommodate rent increases. In liaison, banks have also expressed concern over the outlook for the retail sector due to this increased competition, as well as changing consumer preferences and the failures of some well-known retailers. Banks are closely monitoring segments such as clothing and footwear but to date have seen failures around the long-run average, with low loan losses in their retail portfolios. Despite the concerns expressed, both foreign and major banks have continued to grow their exposures to new retail properties by providing funding to new developments (Graph 2.13). New developments and refurbishments have an increased emphasis on entertainment, hospitality and services. This has cushioned the impact on retail property from online retailers, but the expanded available floor space has still put downward pressure on rents.
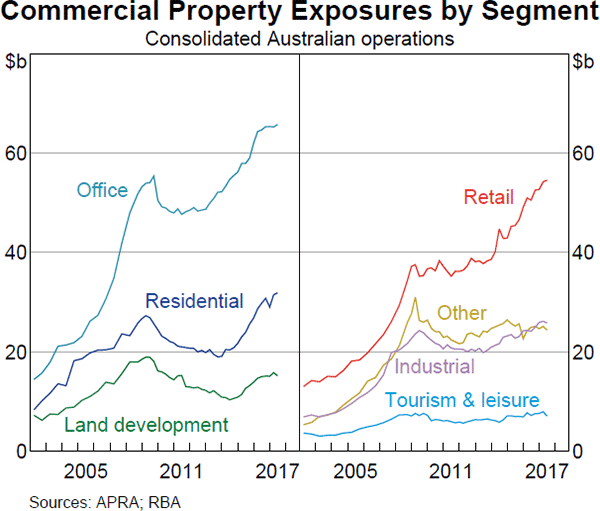
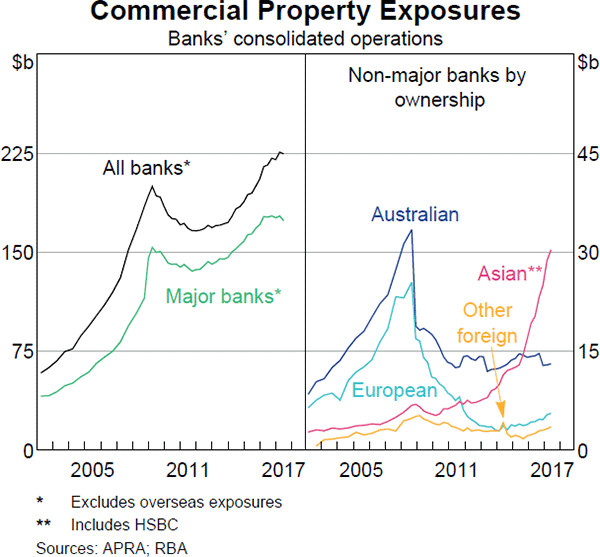
Following APRA's 2016 review of commercial property lending, banks have continued to tighten their commercial property lending standards and assess their portfolio allocations. Australian banks have slowed the growth of their overall commercial property exposures, pulling back on lending to all asset types except for retail and residential development. In contrast, Asian banks' exposures to commercial property have continued to grow strongly (Graph 2.14).
Business Sector
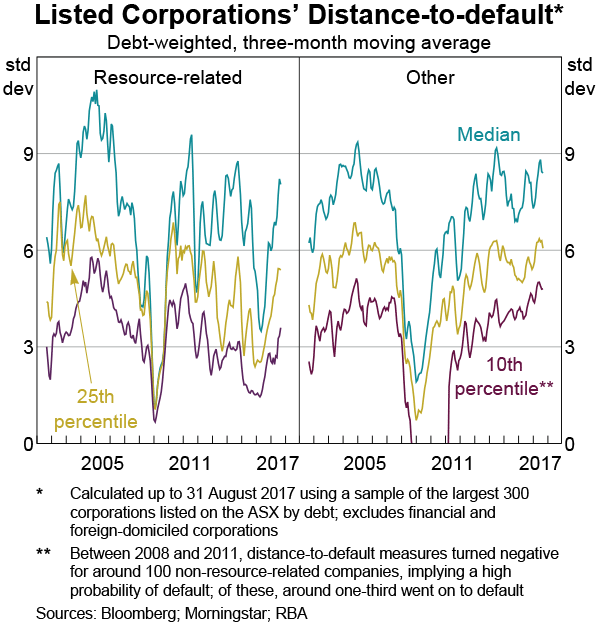
Outside of the mining-exposed states, businesses' finances generally remain in good shape. Survey measures of business conditions are above their long-run averages and business loan performance continues to improve. Non-resource-related listed companies appear well placed to meet their financial obligations, supported by a rise in profits in the June 2017 half (compared with the previous June half). The gearing ratio of these listed corporations was broadly unchanged compared with the previous period; debt-servicing ratios continued to decline, reflecting higher profits and a decline in interest expenses; and market measures of default risk declined over the period (Graph 2.15; Graph 2.16). Smaller businesses have also seen profits rise and their aggregate debt-servicing ratio has remained at a low level.
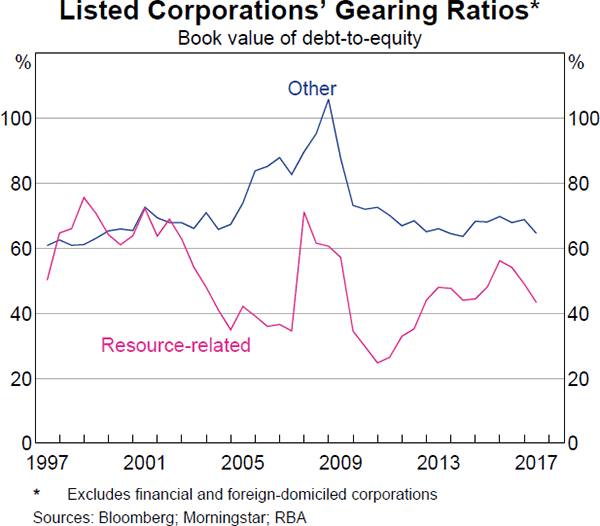
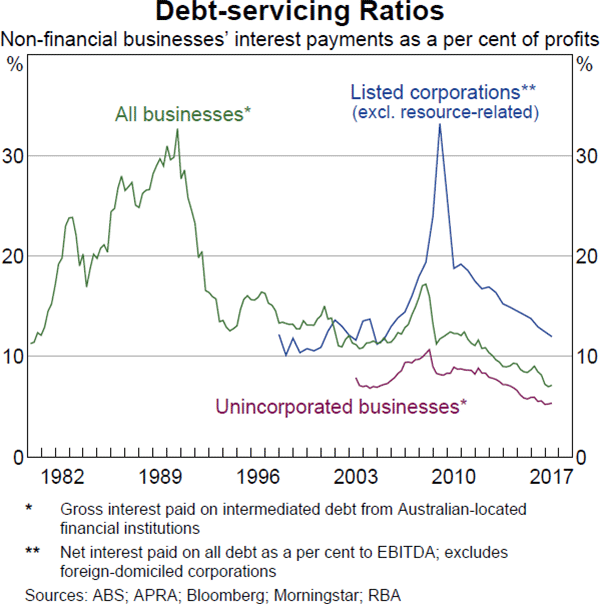
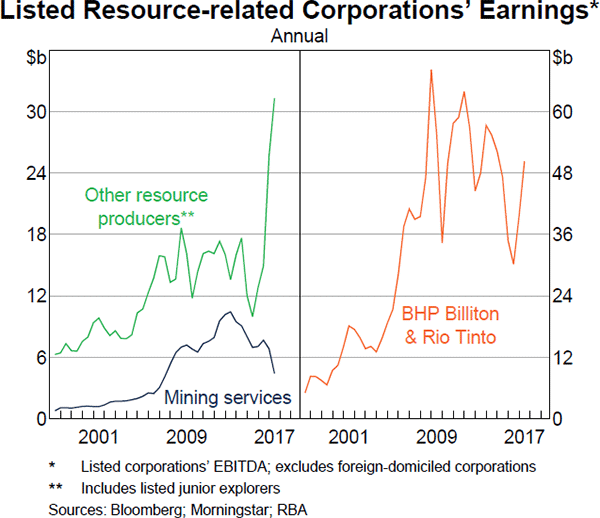
For the resources sector, higher commodity prices have also underpinned improved conditions. Listed resource companies appear in sound financial health and market-based default risk measures declined further over the past six months (Graph 2.17). Higher commodity prices supported by ongoing cost reductions drove a rise in profits over the June half compared with the same period last year (Graph 2.18). Many listed resource-related companies have used this to further reduce their debt. For listed mining services corporations, however, earnings remain under pressure given the focus on cost reduction by resource producers.
In Queensland and Western Australia, the challenging conditions faced by non-resource-related businesses are reflected in indicators of financial distress. Business failures rose to record highs in Western Australia over the June quarter and remain elevated in Queensland (Graph 2.19).
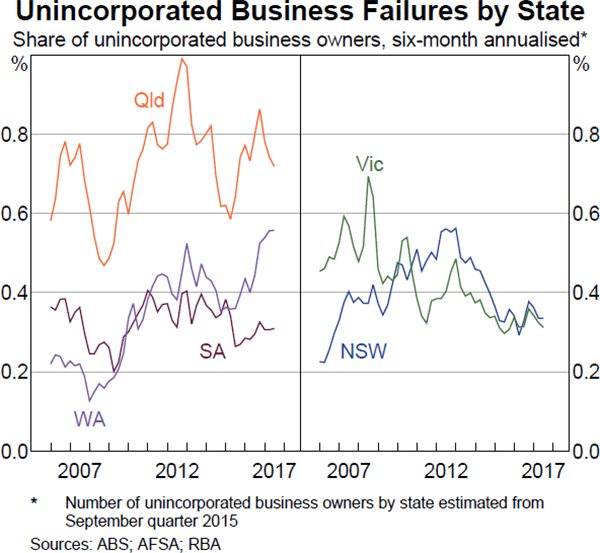
Recent liaison with industry suggests overall conditions are improving in Western Australia despite stress in some industries, namely residential construction and retail, amid tighter lending conditions and weak consumer confidence.
Footnote
See also Simon J and Stone T (2017), ‘The Property Ladder after the Financial Crisis: The First Step Is a Stretch but Those Who Make It Are Doing OK’, RBA Research Discussion Paper No 2017-05. [1]