RBA Annual Conference – 1999 Capital Flows to East Asia: The Facts Gordon de Brouwer
1. Introduction
With the passing of time, we now have a clearer story of what happened to capital flows in east Asia during the financial crisis. This paper briefly summarises the available data, drawing primarily on material published by the Bank for International Settlements (BIS) and the International Monetary Fund (IMF). It focuses first on the size and volatility of capital flows to and from emerging markets, and Asia in particular, and then examines the distribution of international bank lending by sector and country during the crisis. The paper concludes by assessing prospects for the return of capital inflows to Asia.
2. The Size and Volatility of Capital Flows
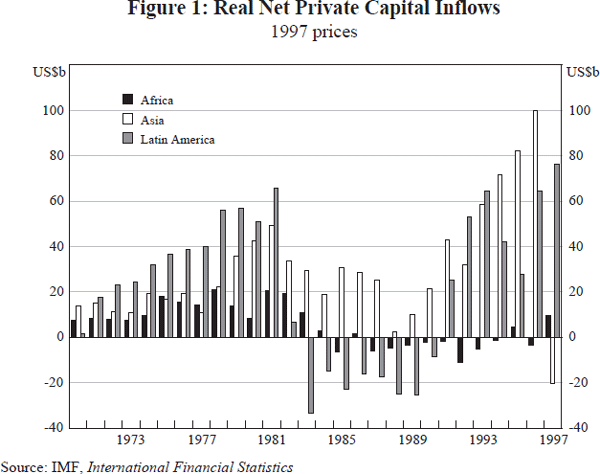
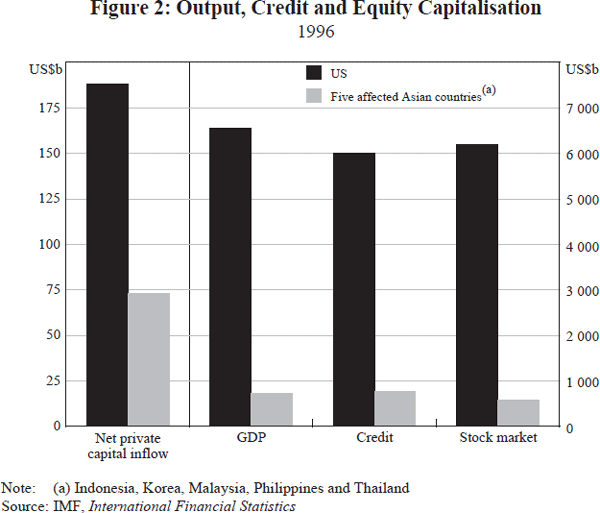
Measured either in current or constant US dollars, net private capital inflows to Asia in the mid 1990s were unprecedented in terms of the size of the flow to emerging markets in the postwar period (Figure 1 and Table 1).[1] Most notably, the mid-1990s inflows to Asia were larger, in both nominal and real terms, than the recycled petrodollar inflows to Latin America in the late 1970s and early 1980s.[2] The flows to Asia were also large relative to the size of the recipient economies: while capital inflows in 1996 to the five affected Asian countries – Indonesia, Korea, Malaysia, the Philippines and Thailand – were less than half the size of flows into the United States, these countries' combined economies, credit systems and share markets were but a tenth of the size of those of the United States (Grenville 1998) (Figure 2).
| 1977–82 | 1983–89 | 1990–94 | 1995 | 1996 | 1997 | 1998 | |
|---|---|---|---|---|---|---|---|
| Total private capital flows | 30.5 | 8.8 | 125.1 | 193.3 | 212.1 | 149.2 | 64.3 |
| By type: | |||||||
| – Net FDI | 11.2 | 13.3 | 44.9 | 96.7 | 115.0 | 140.0 | 131.0 |
| – Net portfolio investment | −10.5 | 6.5 | 64.9 | 41.2 | 80.8 | 66.8 | 36.7 |
| – Bank loans and other | 29.8 | −11.0 | 15.2 | 55.4 | 16.3 | −57.6 | −103.5 |
| By region: | |||||||
| – Asia | 15.8 | 16.7 | 39.1 | 95.1 | 100.5 | 3.2 | −55.1 |
| – Latin America | 26.3 | −16.6 | 40.8 | 38.3 | 82.0 | 87.3 | 69.0 |
| – Other | −11.6 | 8.7 | 45.2 | 59.9 | 29.7 | 58.7 | 50.4 |
|
Sources: IMF 1995 for 1977–89 data; IMF 1999 for 1990s data |
|||||||
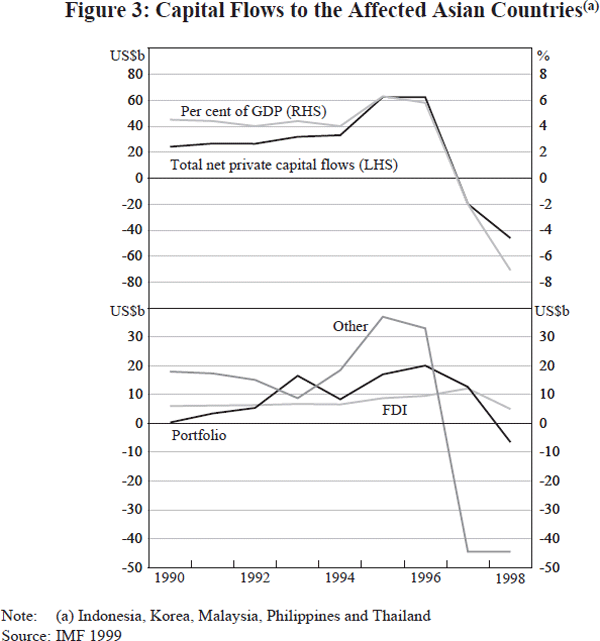
Capital flows to emerging markets have also been highly volatile: the flows to Latin America of two decades ago were abruptly reversed in the early 1980s, and the flows to Asia similarly so in 1997. In the 1990s, foreign direct investment (FDI) to emerging markets remained the most stable source of capital inflows, even at the peak of the financial crisis, while bank loans were the most volatile and underwent the most violent reversal (Table 1).
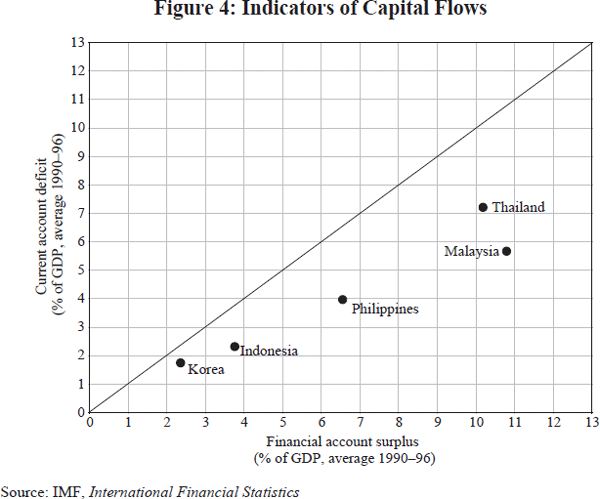
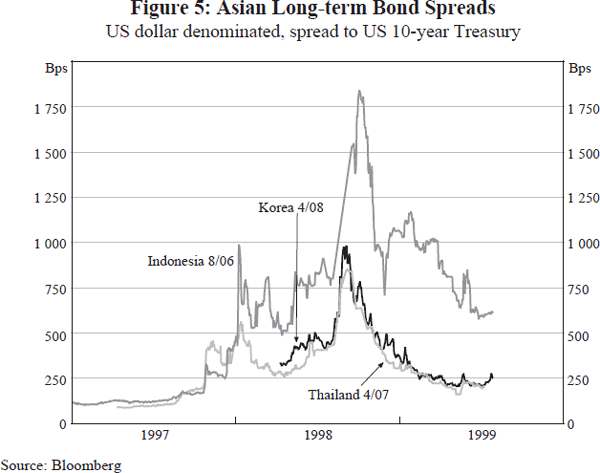
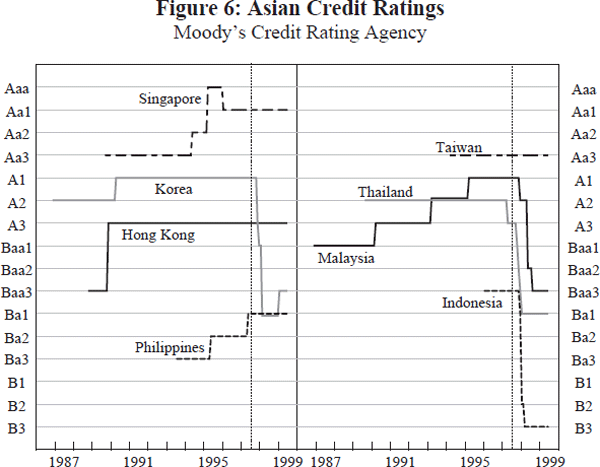
This was especially the case in Asia (Figure 3). Capital flows flipped from an inflow of over US$100 billion in 1996 to outflows of over US$55 billion in 1998 (Table 1). The reversal of capital flows is consistent with the abrupt change from current account deficit to surplus, as shown in Grenville and Gruen (this volume), although it is worth noting that capital inflows to emerging east Asia in the first half of the 1990s were substantially larger than these countries' current account deficits since their central banks were acquiring reserves – Figure 4 shows that the surpluses on the financial account (i.e. FDI, portfolio investment and loans) were consistently larger than the deficits on the current account in this period. For the five affected countries, total capital inflows peaked at over US$60 billion in both 1995 and 1996, equivalent to over 6 per cent of their combined national income (and appreciably higher in some individual cases); outflows in 1998 amounted to more than 7 per cent of combined GDP. The flip in capital flows was concentrated in a sharp reversal of bank loans (and other), which turned from inflows of around US$35 billion in 1995 and 1996 to outflows of US$45 billion in 1997 and 1998. The violence of the reversal in capital flows was reflected in the widening of the risk premium on emerging market securities (Figure 5) and the subsequent downgrade of credit ratings (Figure 6).
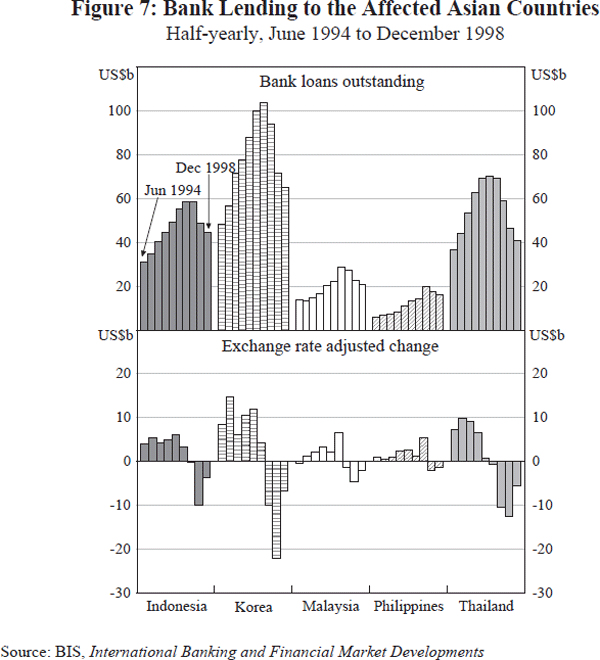
The BIS provides a detailed breakdown of the shift in bank lending. Figure 7 shows banks' consolidated lending to the five affected countries for each six-month period from 1994 to 1998: the top panel shows bank loans outstanding; the bottom panel shows the exchange rate adjusted change. The fall in bank lending – i.e. loan repayment – is most striking in Indonesia, Korea and Thailand. Table 2 provides detail on banks' unconsolidated assets in selected Asian economies (and in this case loans account for about 90 per cent of assets). Banks' unconsolidated assets in the affected countries rose about US$60 billion in the year to June 1997, but fell by almost US$110 billion in the next year and a half to December 1998. Assets in Thailand were the first to contract, spreading to Indonesia and Korea in the last quarter of 1997. Despite the loan roll-over agreement in late December 1997, banks' assets in Korea contracted markedly in the March quarter of 1998, partly reflecting the reversal of repurchase agreements with Korean banks. Repayment of loans continued throughout 1998, except for China, the Philippines, and Taiwan. Net debt issues also declined, although less markedly (Table 3).
| 1997 | 1998 | Outstandings | ||||||||
|---|---|---|---|---|---|---|---|---|---|---|
| Mar | June | Sep | Dec | Mar | June | Sep | Dec | Dec 1998 | ||
| Indonesia | 1.8 | 2.8 | 3.3 | −2.1 | −5.0 | −3.9 | −2.1 | −1.6 | 50.5 | |
| Korea | 4.3 | 4.8 | −1.9 | −11.5 | −16.4 | −4.2 | −4.6 | −4.9 | 74.6 | |
| Malaysia | 5.3 | 1.8 | 0.2 | −3.7 | −2.8 | −1.5 | −1.1 | −0.7 | 23.2 | |
| Philippines | 1.6 | 1.9 | −0.8 | 0.5 | −0.8 | 0.8 | −2.0 | 1.7 | 16.3 | |
| Thailand | 0.5 | −0.3 | −10.5 | −7.2 | −8.5 | −5.3 | −4.8 | −5.4 | 56.6 | |
| Affected-5 | 13.5 | 11.0 | −9.7 | −24.0 | −33.5 | −14.1 | −14.6 | −10.9 | 221.2 | |
| China | 2.4 | 4.2 | 5.2 | −0.3 | 0.3 | −3.3 | −6.2 | 1.0 | 82.7 | |
| Taiwan | 1.9 | 0.5 | −0.3 | −2.3 | −0.4 | 0.3 | −1.3 | 2.0 | 23.2 | |
| Total | 17.8 | 15.7 | −4.8 | −26.6 | −33.6 | −17.1 | −22.1 | −7.9 | 327.1 | |
|
Note: (a) Exchange rate adjusted Source: BIS, International Banking and Financial Market Developments |
||||||||||
| 1997 | 1998 | 1999 | Outstandings | |||||||||
|---|---|---|---|---|---|---|---|---|---|---|---|---|
| Mar | June | Sep | Dec | Mar | June | Sep | Dec | Mar | Mar 1999 | |||
| Indonesia | 1.0 | 0.9 | 2.1 | 2.0 | −0.3 | 1.0 | −0.2 | −0.3 | −0.6 | 16.5 | ||
| Korea | 2.3 | 2.3 | 4.3 | 0.2 | −0.9 | 3.5 | −0.4 | −0.7 | −1.1 | 51.7 | ||
| Malaysia | 0.2 | 1.8 | 0.7 | 0.4 | −0.5 | 0.0 | −0.2 | 0.0 | 0.3 | 13.1 | ||
| Philippines | 1.1 | 1.1 | 1.2 | −0.1 | 0.0 | 0.7 | −0.4 | −0.5 | 1.1 | 11.9 | ||
| Thailand | 0.6 | 0.9 | 0.5 | 0.0 | −0.4 | 0.1 | −0.1 | 0.1 | 0.5 | 14.7 | ||
| Affected-5 | 5.2 | 7.0 | 8.8 | 2.5 | −2.1 | 5.3 | −1.3 | −1.4 | 0.2 | 107.9 | ||
| China | 0.5 | 2.2 | 0.6 | 0.2 | 0.3 | −0.3 | −0.9 | 0.6 | −0.4 | 17.0 | ||
| Taiwan | 0.7 | 0.7 | 0.7 | 0.6 | 0.3 | 0.6 | −0.1 | −0.1 | 0.0 | 7.4 | ||
| Total | 6.4 | 9.9 | 10.1 | 3.3 | −1.5 | 5.6 | −2.3 | −0.9 | −0.2 | 132.3 | ||
|
Note: (a) Money market instruments, bonds and notes by nationality of issuer Source: BIS, International Banking and Financial Market Developments |
||||||||||||
3. The Distribution of Capital Flows by Sector and Country
Seventy-five per cent of the fall in bank lending to Asia has been in lending to other banks, even though interbank lending only accounted for 45 per cent of total bank lending at the peak of inflows in mid 1997 (Table 4). With the exception of Korea, most cross-border bank lending to Asia is concentrated in the non-bank private sector rather than the bank sector (Table 5). Even in Korea's case, however, the effect was disproportionate: about 65 per cent of cross-border lending to Korea in mid 1997 was to banks, but 80 per cent of the subsequent fall in loans was to banks. The concentration of outflows in the interbank market reflects that market's liquidity and short maturity profile. Table 5 also provides some information about the changing maturity of bank lending. Before the crisis, short-term (less than one year) debt generally exceeded long-term debt in east Asia, notably in Korea where over 70 per cent of bank claims at June 1996 were due in one year. The BIS data indicate that the maturity profile has changed most in Korea, where only 45 per cent of bank claims are now short-term.
| On Asia | On Indonesia | On Korea | On Malaysia | On Thailand | ||||||||||
|---|---|---|---|---|---|---|---|---|---|---|---|---|---|---|
| Total | To banks | Total | To banks | Total | To banks | Total | To banks | Total | To banks | |||||
| June 96 | 337.9 | 147.3 | 49.3 | 10.1 | 88.0 | 57.9 | 20.1 | 5.6 | 69.4 | 28.0 | ||||
| Dec 96 | 367.0 | 158.9 | 55.5 | 11.8 | 100.0 | 65.9 | 22.2 | 6.5 | 70.1 | 25.9 | ||||
| June 97 | 390.5 | 172.4 | 58.7 | 12.4 | 104.2 | 68.0 | 28.1 | 10.5 | 69.4 | 26.1 | ||||
| Dec 97 | 381.3 | 155.4 | 58.4 | 11.7 | 94.2 | 56.0 | 27.5 | 9.9 | 58.9 | 17.8 | ||||
| June 98 | 320.2 | 118.6 | 48.5 | 6.6 | 71.9 | 40.8 | 22.8 | 7.1 | 46.4 | 12.0 | ||||
| Dec 98 | 297.9 | 103.3 | 44.8 | 5.2 | 65.3 | 37.2 | 20.8 | 5.8 | 40.8 | 8.8 | ||||
|
Source: BIS, International Banking and Financial Market Developments |
||||||||||||||
| Position in regard to: | Total US$ billion | By maturity Per cent total | By sector Per cent total | |||||
|---|---|---|---|---|---|---|---|---|
| To 1 year | More than one year | Banks | Public sector | Non-bank private sector | ||||
| Indonesia | mid 96 | 49.3 | 60.0 | 35.8 | 20.5 | 13.3 | 66.2 | |
| mid 97 | 58.7 | 59.0 | 35.0 | 21.1 | 11.1 | 67.7 | ||
| mid 98 | 48.4 | 54.1 | 42.6 | 13.7 | 15.6 | 70.6 | ||
| end 98 | 44.8 | 52.6 | 43.7 | 11.5 | 14.9 | 73.6 | ||
| Korea | mid 96 | 88.0 | 70.8 | 19.2 | 65.7 | 6.7 | 27.4 | |
| mid 97 | 104.2 | 68.0 | 19.7 | 65.3 | 4.2 | 30.4 | ||
| mid 98 | 71.9 | 45.4 | 39.2 | 56.7 | 6.7 | 36.5 | ||
| end 98 | 65.3 | 45.3 | 38.0 | 56.9 | 8.4 | 34.7 | ||
| Malaysia | mid 96 | 20.1 | 49.7 | 41.1 | 28.1 | 11.4 | 60.5 | |
| mid 97 | 28.8 | 56.4 | 30.8 | 36.4 | 6.4 | 57.1 | ||
| mid 98 | 22.8 | 48.6 | 41.6 | 31.2 | 6.6 | 62.1 | ||
| end 98 | 20.8 | 44.5 | 44.1 | 27.6 | 8.7 | 63.6 | ||
| Philippines | mid 96 | 10.8 | 55.1 | 39.3 | 32.0 | 25.4 | 42.6 | |
| mid 97 | 14.1 | 58.8 | 30.7 | 38.9 | 13.1 | 48.0 | ||
| mid 98 | 17.5 | 56.4 | 37.2 | 45.8 | 12.6 | 42.1 | ||
| end 98 | 16.2 | 53.7 | 41.5 | 37.1 | 12.8 | 50.1 | ||
| Thailand | mid 96 | 69.4 | 68.9 | 27.4 | 40.3 | 3.1 | 56.4 | |
| mid 97 | 69.4 | 65.7 | 30.4 | 37.6 | 2.8 | 59.5 | ||
| mid 98 | 46.3 | 59.1 | 36.6 | 25.9 | 4.3 | 69.8 | ||
| end 98 | 40.7 | 58.2 | 37.3 | 21.7 | 4.7 | 73.6 | ||
|
Sources: BIS, International Banking and Financial Market Developments and The Maturity, Sectoral and Nationality Distribution of International Bank Lending |
||||||||
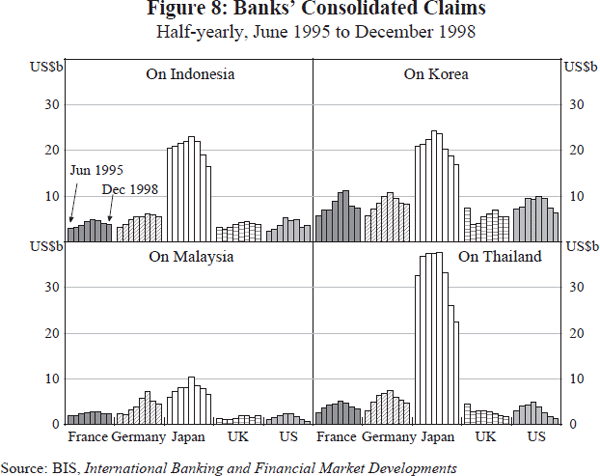
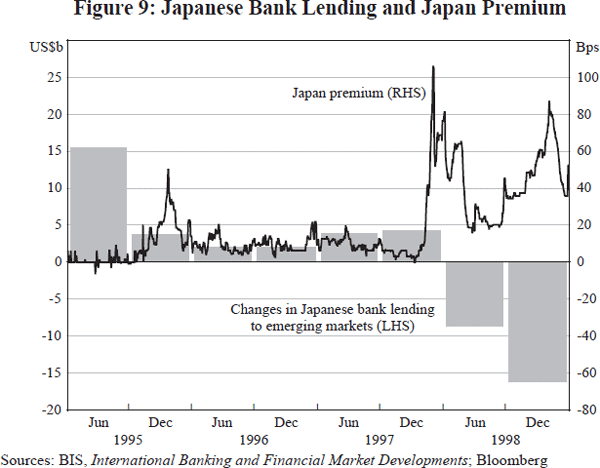
According to the BIS, consolidated claims by banks on Asia fell 25 per cent from a peak of US$390 billion in June 1997 to US$298 billion in December 1998. Japan is the principal creditor to the rest of east Asia, with Japanese banks accounting for over 30 per cent of claims on the region at the height of inflows. But Japanese banks were also the biggest repatriators of funds during the crisis, withdrawing US$38 billion in the six quarters to December 1998, accounting for more than 40 per cent of loan repayments from the region. Figure 8 shows bank claims of the five key lending countries – France, Germany, Japan, the United Kingdom and the United States – on four of the affected Asian countries from June 1995 to December 1998. Obviously, Japan is the principal lender in all cases. Both the loan concentration and the loan reversal are greatest in the case of Thailand.[3] The more concentrated the fund supply, the greater the reversal.[4] One driving factor behind the sharp contraction in Japanese banks' exposure was weakness in the Japanese banking system, with the withdrawal of Japanese funds from emerging markets coincident with the rise in the Japan premium (Figure 9).[5]
4. Looking Forward
The paper has focused on documenting the extraordinary reversal of capital inflows to emerging east Asia in the past few years. It is worth keeping in mind, however, that volatility in capital flows is unlikely to have come to an end: the outflows were preceded by inflows and they will most likely also be followed by inflows. As shown in Figure 1, the pattern of capital movement to emerging markets over the past 30 years or so has been one of ebb and flow, rather than stasis. The issue is how strongly and quickly capital inflows will return.
On the one hand, possible impediments to inflows come from increased risk aversion by governments and markets. Regional governments may pursue risk-averse policies to reduce international exposure, such as limiting current account deficits or imposing capital controls of various degrees of stringency. More generally, markets also have become more risk averse, with spreads on corporate and emerging market bonds still wider than a few years ago.
On the other hand, there are also powerful forces at work which presage a return to robust inflows to the region. With global inflation benign, world interest rates relatively low and the recent soaring returns on major industrial-country share markets (possibly) slowing, capital will return to emerging markets in search of better yield. Moreover, investment portfolios in the major economies are still extremely overweight their own domestic securities – the so-called ‘international diversification puzzle’[6] – and the continued expansion of international markets should therefore generate even greater international diversification into emerging markets. The Asian region is well placed to take advantage of this since its prospects are fundamentally favourable. While the Latin American debt crisis scared off new capital for over a decade, this was against a backdrop of a century of economic instability. East Asia's economic history is different, and many of the fundamental strengths recognised in Asia before the financial crisis (like high thrift and a strong work ethic) remain in place.
Footnotes
In Figure 1, net private capital inflows are measured as aggregate capital and financial accounts, including net errors and omissions but excluding reserve assets, use of IMF credit and exceptional financing. Flows in constant 1997 US dollar prices are obtained by deflating the nominal series by the US GDP deflator based at 1997. [1]
The inflows to east Asia were driven by a mix of push-pull factors, including the pursuit of perceived large profit opportunities in a globally low interest rate environment, the diversion of Japanese investment offshore, the expansion of institutional investors and country funds, the development of regional ratings, and the easing of local capital controls (Grenville 1998; de Brouwer 1999). [2]
The data may overstate the reduction in Japanese banks' exposure to Thailand. Some proportion of Japanese bank loans is to Thai-Japanese joint ventures or to subsidiaries of Japanese companies operating in Thailand. As direct loans were withdrawn, loans were reportedly made by Japanese banks to the head office company in Japan, which in turn directed funds to the joint venture or subsidiary in Thailand. This will appear as a reduction in loans and an increase in FDI in the financial account of the balance of payments. [3]
This parallels Brazil's experience in late 1998 and early 1999 with rolling over interbank loans: some of the countries with the largest exposures relative to the size of their banking sectors – like the Netherlands and Spain – were also the ones with the lowest roll-over rates. [4]
The Japan premium is the additional cost Japanese banks face in borrowing short-term funds relative to other banks. The premium shown in Figure 9 is for 3-month US dollar LIBOR. [5]
French and Poterba (1991) present evidence that portfolio allocations are excessively weighted towards domestic assets. Baxter and Jermann (1997) argue that the divergence between optimally diversified and observed portfolios is even greater once account is taken of the correlation between returns on human capital and domestic physical capital, implying that investors should hold a substantial short position in domestic marketable assets and a long position in foreign marketable assets to offset their human-capital risk. [6]
References
Baxter, M and UJ Jermann (1997), ‘The International Diversification Puzzle Is Worse Than You Think’, American Economic Review, 87(1), pp. 170–180.
de Brouwer, GJ (1999), Financial Integration in East Asia, Cambridge University Press, Cambridge.
French, KR and JM Poterba (1991), ‘Investor Diversification and International Equity Markets’, American Economic Review, 81(2), pp. 222–226.
Grenville, SA (1998), ‘Capital Flows and Crises’, Reserve Bank of Australia Bulletin, December, pp. 16–31.
Grenville, SA and D Gruen (1999), ‘Capital Flows and Exchange Rates’, this volume.
IMF (1995), International Capital Markets – Developments, Prospects and Policy Issues, Washington, DC, August.
IMF (1999), International Capital Markets – Developments, Prospects and Policy Issues, Washington, DC, August.