RBA Annual Conference – 1991 The Lessons for Monetary Policy Ian Macfarlane[1]
1. Introduction
Towards the end of 1990, when we were putting together the Reserve Bank submission for the Martin Committee, we set out a list of what economists expected to be the result of deregulation, and a list of what actually transpired. Broadly speaking, our conclusion was that most things had turned out approximately as expected, but there were two major exceptions. The two things that greatly exceeded expectations were the growth of credit and the fall in credit standards. As far as I know, no-one had predicted a rapid growth of credit as a likely outcome. The fall in credit standards, on the other hand, was not a total surprise. The proponents of financial deregulation knew that banks would be involved in greater risk when competition was intensified, but they would have been surprised by the extent of the loan losses that were subsequently incurred.
The aim of this paper is to explore some implications for monetary policy of the deregulation of financial intermediaries. Although there are a number of major structural changes that occurred in the early 1980s, including the floating of the exchange rate and the introduction of the tender system for selling government securities, they do not pertain specifically to financial intermediaries, and I do not intend to say much about these because they have been covered in depth elsewhere.[2] The two changes that this paper will be mainly concerned with are the lifting of interest rate ceilings on banks in 1980 and the entry of foreign banks in 1985. Thus, the major part of this paper will be devoted to analysing the implications for monetary policy of deregulatory changes that were designed principally to increase competition among financial intermediaries.
The rapid growth in credit between 1983 and mid 1989 has to be the centrepoint of any discussion of monetary policy, so the first section will spell out a few pertinent facts on the growth of credit. Not much will be said about the growth of other monetary aggregates because this has been covered elsewhere.[3] The second and third sections will then analyse two competing explanations for the rapid growth in credit. The first concentrates on the fall in credit standards, and the second on the role of monetary policy.
2. The Growth of Credit
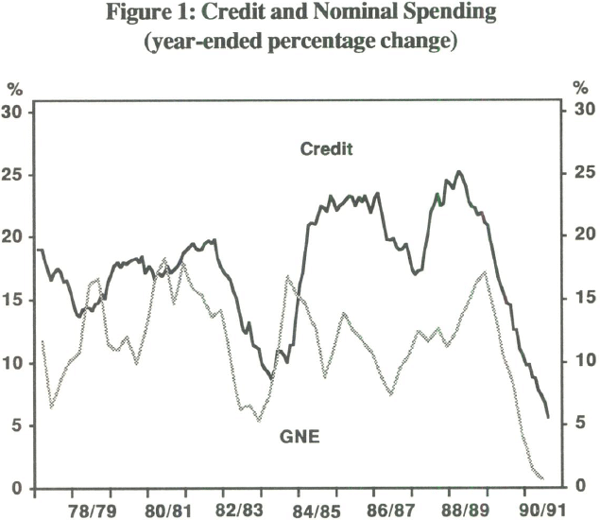
Credit growth picked up sharply from about the end of 1983; it grew quickly for over five years, averaging over 20 per cent per annum between end 1983 and the middle of 1989. Figure 1 shows that the growth of credit usually exceeds the growth of nominal spending, but the gap was unusually large during this period.
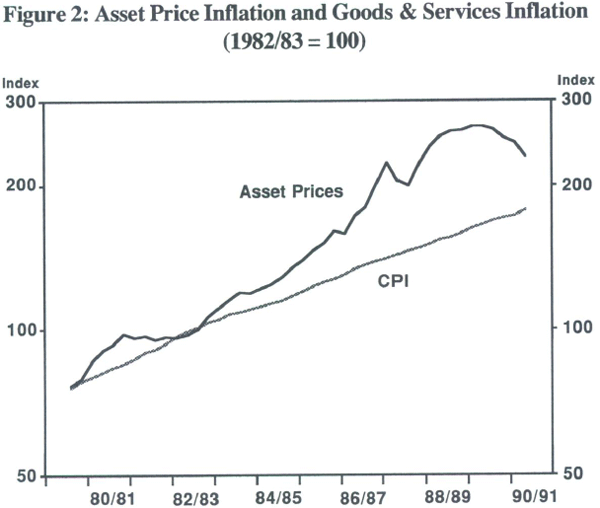
The faster growth in credit was not associated with a speed up in inflation or in nominal spending; both grew less rapidly in the period since end 1983 than they did in the equivalent period before end 1983. However, asset prices rose strongly from about 1983 to mid 1989 (Figure 2). The first phase of the asset price rise was dominated by the stock market, and the second phase in 1988 and 1989 by residential and commercial property.
Most of the increase in credit was directed to the business sector (Figure 3). As a proportion of GDP, credit provided to business doubled over the decade, while personal and housing lending rose only marginally. The debt to equity ratio of listed companies at book value approximately doubled between 1983 and 1989.
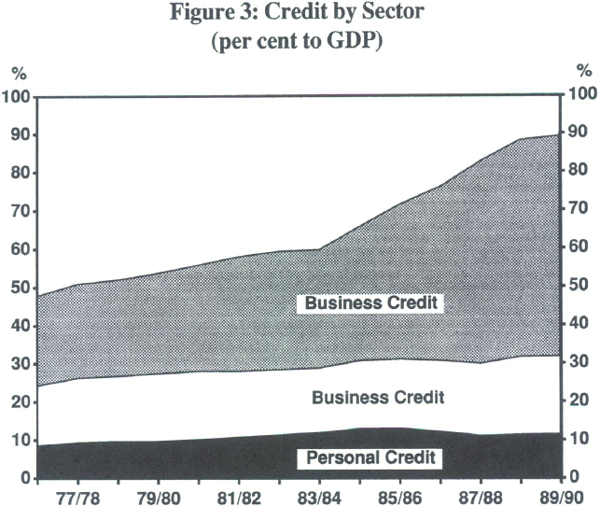
The fact that the increase in credit was directed almost exclusively to the business sector, seems to have been a peculiarly Australian characteristic. Table 1 compares the composition of credit growth in Australia with the United States and the United Kingdom, two countries that also experienced strong credit growth during the 1980s. In the United States, lending for housing was the fastest growing category of lending, while in the United Kingdom, all three categories of lending more than doubled as a percentage of GDP over the decade. For each country, it is possible to attribute a share of the total growth of credit to each sector. For Australia, business credit accounts for 91 per cent of the total increase, compared with a little over 40 per cent for the United States and the United Kingdom.
| Business | Housing | Personal | Total | ||
|---|---|---|---|---|---|
| Australia | 1980 | 26 | 18 | 10 | 54 |
| 1990 | 58 | 20 | 12 | 90 | |
| United States | 1980 | 52 | 40 | 14 | 106 |
| 1990 | 64 | 54 | 15 | 133 | |
| United Kingdom | 1980 | 18 | 20 | 3 | 40 |
| 1990 | 42 | 48 | 8 | 97 | |
| Source: Stevens (1991) | |||||
3. Reduced Credit Standards
Giving prominence to a fall in credit standards may seem an unusual way to start a discussion of why credit grew so quickly, but I think that is only because it uses unfamiliar terminology. A fall in credit standards can be thought of as any shift in preferences that causes borrowers or lenders to take on more risk. That is, for a given level of real interest rates, it represents an outward shift in the demand for credit or in the supply of credit. The simplest examples of a fall in credit standards could occur because:
- borrowers wish to run their businesses with higher leverage and hence, other things being equal, higher risk;
- lenders desire to increase the size of their balance sheets; they therefore have to expand into areas that they would previously not have entered.
It is assumed in these discussions of credit standards that lenders face a range of borrowers who could be ranked on a spectrum from very low risk to very high risk. The only way that the rate of lending can be increased is if lenders are prepared to move some way towards the riskier end of this spectrum. A fall in credit standards is not meant in a pejorative sense. Indeed, some fall was hoped for following deregulation as a correction to what was regarded as excessively conservative lending practices in the regulated era.
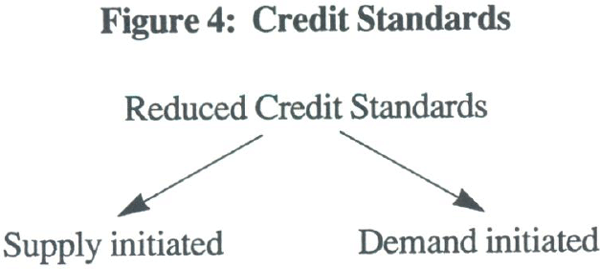
An important issue is whether this movement towards faster credit growth and lower credit standards was mainly initiated by the borrowers or the lenders. Of course, it does not have to be one or the other – it can be a combination of the two – although it is convenient to think of the two influences as being logically separate (see Figure 4). I have already covered this subject at length in two previous papers,[4] so the material will be organised differently on this occasion. Specifically, I will set out the main argument used by the proponents of the view that the surge in credit was principally due to the increased supply of financial intermediaries, and then explain why I think it is only part of the story.
(a) Supply-Initiated Reductions in Credit Standards
Between 1983 and 1988, the number of banking groups operating in Australia went up from 15 to 34, and the number of merchant banks from 48 to 111. Not only did the numbers increase, but the financial resources at their disposal also increased; the amount of capital devoted to banking rose from $4.5 billion in 1983 to $20 billion in 1988. At the same time as the resources devoted to financial intermediation were rising, banks' ability to compete with each other and with non-bank financial institutions was greatly increased by the removal of interest rate ceilings. Also, the incentive for domestic banks to compete was increased because they knew well before 1985 that their market would be opened up to foreign competition.
On this view of the world, it is a simple matter to explain the large increase in credit – more banks and more competition means more lending. In the process, as each bank sought to gain (or protect) its share, total credit growth had to rise, and this could only occur if banks were prepared to move further along the risk spectrum (which they were). With the benefit of hindsight, proponents of this view ask how anyone could have imagined it was possible to treble the resources in the banking sector, yet still expect credit to grow at the same rate as if nothing had changed. At its extreme, this view regards financial deregulation as having been a mistake, and some of its proponents would like to turn the clock back.
The popular version of the supply explanation thus blames all excesses on the banks. They are seen as the villains who foisted credit onto an unwilling and unprepared public. While there is clearly some truth in this version of recent events, it misleads as much as it illuminates. The next sections attempt to explain why any explanation of the rapid credit growth would have to give a lot of weight to other factors, in particular, the attitudes of borrowers and the economic environment.
(b) Demand-Initiated Reductions in Credit Standards
While it is no doubt possible to find some cases which fit this stereotype of banks pushing credit onto unwilling borrowers, they represent the minority. Banks were usually not the main initiating agents. It is hard to believe that banks had to twist the arm of a Bond or a Skase (or any of the more established businesses that wanted to gear up) to get them to borrow. The criticism should be that banks were too accommodating rather than too aggressive.
A slightly more moderate version of the foregoing argument is to attribute the fault to banks' naivety in acquiescing to the schemes of entrepreneurs. While some are certainly guilty of that, again it is only part of the story. If we look at the dozen companies that made the biggest contribution to the aggregate rise in corporate leverage in Australia between 1983 and 1988, Bond and Skase are represented, but they are not the majority. A number of companies in this list are long-established producers of staple products, with some decidedly “blue-chip”.[5] Also, if banks are to be blamed for their gullibility, the blame should be shared with the rest of the investment community; the stock market showed its approval of what banks were doing by pushing up their share prices.
It was not just the entrepreneurs who wanted to gear up. A wide cross-section of Australian business (and business in other countries) was convinced that the road to increased wealth was through geared asset acquisition, and some who were in doubt felt compelled to engage in it anyhow as defence against takeover. This strategy became the orthodoxy of the decade. In some cases, it depended on little more than optimism that asset prices would keep on rising; in other cases, it depended on detailed calculations of the tax advantages of debt in an inflationary environment. Either way, it seemed to have equal attraction to the street-smart gambler and the business school MBA. Rob Ferguson asked the question, “Why did businesses gear up in the face of the increasing real cost of money?”. His answer was, “To some extent, it may have been a habit established when it was wise to do so in the 1970s … (but also) there were excellent rewards for entrepreneurs who geared to acquire sleepy companies. … At its extreme, this became a euphemism for infinite leverage. Then debt-free, full tax-paying corporates became worth almost twice their stock market value, as their new owners were able to offset their tax liability by leverage and tax sheltering techniques.”[6]
The above describes a predominant influence during 1984 to 1987, when highly-leveraged takeovers were a major influence on the growth of credit. Similar influences lay behind the commercial property boom of 1987 to 1989. While the quote from Ferguson (correctly) gives much weight to tax considerations in explaining business motivation, an economist would recognise the equally-important role played by inflationary expectations. Continued inflation was expected to underpin the rise in asset prices, and to erode the real servicing costs of debt. The 10-year period that contains the highest average rate of inflation in Australia this century is the period from 1973 to 1983, where it averaged 11.6 per cent. This was the period immediately before the sharp growth of credit. It is hardly surprising that inflation would figure prominently in business strategies of the time.
The other surprising thing is that these business strategies persisted in the face of very high real interest rates. This is a subject taken up in the next section on monetary policy. At this stage, I only want to point out that although the high real interest rates will win in the end, in the meantime they can often cause adverse effects. They can for a time encourage speculative activity at the expense of more conservative investments (see Appendix 1).
As a counter to the supply argument, it would be possible to construct an explanation of the credit surge entirely in terms of increased demand. If business wanted to borrow more, asset prices were rising and cash flow healthy, banks would increase their lending. Even if no new banks or other financial intermediaries were added to the industry, the existing banks could compete to provide the supply of credit. If their capital base became inadequate, they could raise more as long as the stock market looked on them favourably. I do not wish to put forward this view as the sole explanation, but merely to point out that it is possible to explain a surge in credit and a fall in credit standards purely in terms of an increasing demand for debt. Appendix 2 examines one market where it is possible to distinguish between demand and supply factors. It concludes that in this case – the market for investment housing loans – it was an increase in demand following a tax change that caused the sharp rise in lending.
Other factors which would cause one to doubt an explanation based primarily on increased supply include:
- the fact that most of the increased credit was concentrated in the business sector is more consistent with the business desire for higher gearing than with a pure supply explanation. Similarly, why was Western Australia so heavily represented in the credit boom, but not Queensland? Were there more new banks starting up in Western Australia? It is difficult to explain these compositional characteristics by supply factors;
- many of the businesses that were most keen to borrow could not be satisfied from domestic sources of supply and had to turn to overseas banks and overseas bond holders;
- the increase in capital did not come in in one step and then lead to increased lending later on. It came in, or was raised locally, in a number of steps because there seemed to be increasing lending opportunities. Australian capital markets were generally happy to subscribe bank capital as it was seen to be a profitable investment. Bank share prices doubled in the three years to September 1987 despite substantial new issues. The increased capital is, therefore, as much a response to the increased demand for credit as it is a cause.
(c) The Economic Environment
The above discussion has proceeded without any account of the economic environment of the mid to late 1980s. While it is possible that a supply or demand-initiated fall in credit standards, in themselves, could have been sufficient to lead to a major surge in credit growth and asset prices, it was more likely to happen in some economic environments than others. It is now apparent that the mid to late 1980s was a period that was particularly conducive to such behaviour.
- The world economy recovered strongly from the 1981/82 recession and economic activity remained buoyant for about eight years, the longest post-war expansion.
- Asset prices around the world rose strongly for much of this period. For example, between 1983 and the 1987 share market crash, equity prices rose by 98, 173 and 147 per cent in the United States, Japan and the United Kingdom, respectively. The comparable figure for Australia was 192 per cent.
- In Australia, equity prices received a substantial boost in the early 1980s from the cyclical recovery in profits, and the structural increase in the profit share of GDP resulting from the fall in real unit labour costs under the Accord. Thus, the first couple of years of strong growth in share prices was attributable to real rather than financial factors.
4. Monetary Policy
(a) General Aspects
A totally different argument advanced for the strong growth of credit in the mid to late 1980s is that it was due to monetary policy being too loose. This is an argument that is usually advanced by people who approve of deregulation and are reluctant to attribute the credit excesses to it.[7] In this sense, it is the opposite to the previous argument, which is usually advanced by opponents of deregulation, who are only too happy to attribute all the excesses to it.
The argument usually says that the monetary authorities were unwilling to run, or too slow to recognise the need for, tighter policy. The main defence against this charge is to point out that from quite early in the piece when it became apparent that credit was growing quickly, the monetary authorities did the only thing that was open to them – they increased its price. It is true that the tighter monetary policy of 1985 and 1986 owes more to the desire to resist an excessive fall in the Australian dollar, than to the desire to reduce the growth in credit, but for whatever reason, interest rates were increased substantially from the middle of the decade. As a result, real interest rates were higher on average during the second half of the 1980s than they had been at any time since the war, and were higher than in any major OECD country (see Table 2). The interest rate in this table is the rate on 90-day bank bills. This understates the rates facing corporate borrowers; if the calculation was re-done using banks' lending rates for prime customers, the real rate of interest would have averaged 9 per cent over this five-year period, for non-prime customers it would have exceeded 10 per cent.
| 1978–83 | 1984–89 | |
|---|---|---|
| Australia | 3.0 | 7.1 |
| Austria | 2.9 | 2.8 |
| Belgium | 5.5 | 5.5 |
| Canada | 2.8 | 5.5 |
| Denmark | 4.6 | 4.9 |
| France | 0.6 | 4.7 |
| Germany | 3.2 | 3.7 |
| Ireland | −0.9 | 6.0 |
| Italy | 0.0 | 5.4 |
| Japan | 2.8 | 3.6 |
| Netherlands | 3.7 | 4.7 |
| New Zealand | −0.1 | 6.7 |
| Norway | 1.6 | 6.5 |
| Sweden | 0.4 | 5.1 |
| Switzerland | −0.1 | 1.7 |
| United Kingdom | 1.0 | 5.3 |
| United States | 1.6 | 3.6 |
| Source: Bullock and Rider (1991) | ||
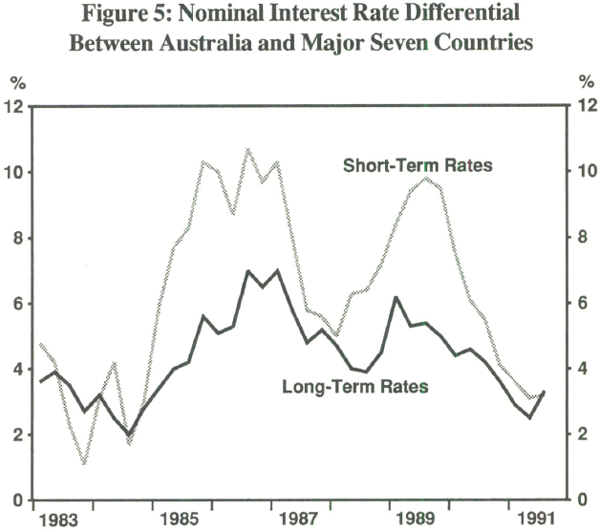
An alternative way of looking at the stance of monetary policy in Australia compared with other countries is to look at the degree of inversity of the yield curve. Figure 5 compares the differential between Australia and the major seven countries (G7) for short-term and long-term interest rates between 1983 and 1989. It shows that throughout the period our short and long rates were higher than in G7 countries, which is not surprising since our inflation rate was higher. It also shows that the average differential was a lot higher at the short end (7.6 per cent) than at the long end (4.7 per cent). In other words, our yield curve was on average nearly 3 per cent more inverse than in G7 countries. This is what should be expected in a country trying to contain then reduce inflation; it is not, however, a characteristic of a country running relatively easy monetary policy.
A variation on the “monetary policy was too easy” argument is to concede that monetary policy did the right thing by raising the price of credit, but to argue that it should also have found a way of restricting its availability.[8] This is not a legitimate argument, because it fails to understand the logic of a deregulated system. The only way that monetary policy can influence the availability of credit in a deregulated system is through its price – there are no options left for augmenting this with physical controls on its availability. Logically, the only way that could occur is to go back and re-introduce some form of regulation.[9]
A related argument to this is that monetary policy should have targeted the money base.[10] This does not amount to much more than a throw-away line unless its proponents can explain how to overcome all the difficulties and impracticalities associated with their suggestion. The procedure is not used by any major country, so if Australia is guilty of not using it, so are the central banks of all other OECD countries. Furthermore, to the extent that this monetary policy procedure affects the economy and credit, it still does it through raising interest rates. The proposal hence boils down to no more than the proposition that interest rates should have been much higher over the period in question. That is a legitimate point of view, but not one that would find as many adherents when stated in a straightforward form.
As stated above, the average level of real interest rates during the period of strong credit growth was extremely high. The high interest rates in 1988/89 are still fresh in people's memories, but they tend to forget that they were also very high in the mid 1980s. In fact, the peak in short-term rates occurred in November 1985. Despite monetary policy that was tight enough at that time to reduce the growth of domestic demand to zero in 1986, credit growth remained strong; at its low-point, it was still growing at 17 per cent. We will never know how high interest rates may have had to go, and how long they may have had to remain there, to achieve a low growth rate for credit during this period. Real interest rates of 10 per cent or so and nominal interest rates to borrowers of over 20 per cent did not do the job, so they would probably have to have been considerably higher. We should not lightly dismiss the consequences that higher interest rates would have had on those parts of the economy not being pushed along by asset price inflation – those relying on cash flow from producing goods and services and those competing with the rest of the world.
Monetary policy is often asked to pursue more objectives than it is capable of. Some observers of the 1980s think, with hindsight, that it should have been directed towards countering the acceleration in asset prices or the surge in credit. While it would have been better if these had not occurred on the scale they did, it is hard to make a case that monetary policy should have been directed towards them as neither is a suitable intermediate objective of monetary policy. Changes in asset prices vary enormously from year to year and would induce more volatility into monetary policy if they were used as a guide. Credit might be of use if it had a stable leading relationship with the ultimate objectives of monetary policy, but it has already been established that the relationship was lagging and unstable in the 1980s. Therefore, targetting credit would move the economy further from its desired path.
Monetary policy (correctly) focussed on a broader objective, because intermediate ones were too unstable. Although many aspects of our macro-economic performance could have been improved, the final arbiter on the stance of monetary policy – the rate of inflation – suggests that it was tighter on average post-1983 than before. As mentioned earlier, the average increase in the CPI in the decade before 1983 was 11.6 per cent; in seven of these years, the inflation rate was in double digits. In the eight years since 1983, the average increase in the CPI has been 6.8 per cent, there were no double-digit years, and the end point is the lowest rate of inflation for twenty years.
Thus, in the deregulation phase, both the instrument of monetary policy (nominal and real interest rates) and the ultimate objective of policy (inflation or nominal GDP) suggest that it was tighter than previously. The growth of credit suggests that it was looser, but this is a misleading indicator because of the structural shifts outlined in section 3.
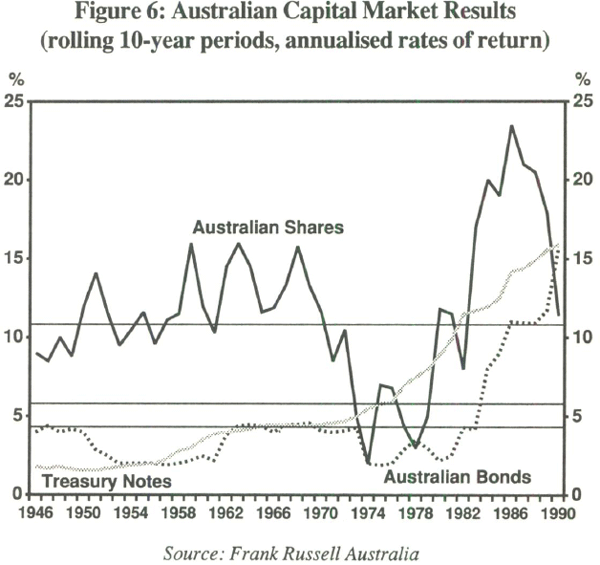
It will be interesting to see how history judges monetary policy in the 1980s. I would be surprised if it judges the decade to be one of relatively easy money. Maybe some economists would come to that conclusion, but they would have to ignore the lower inflation and high real interest rates. Investors, or more particularly funds managers, would have difficulty agreeing with them. A portfolio of equities normally outperforms a portfolio of bonds over longish periods by a comfortable margin (“the equity premium”). This is logical because equities have higher risk (volatility). However, in the 1980s, the reverse occurred, even though the middle of that decade contained a major bull market in equities. In the 10 years to June 1990, both Treasury notes and bonds outperformed equities. The relentless pressure of high real interest rates won in the end; the tortoise overtook the hare.
(b) Particular Episodes
The section above has, I think, refuted, the proposition that the stance of monetary policy was the major reason for the excessive use of debt between 1983 and 1989. It would, however, be foolish to claim that the setting was always right, and we have not done so. For example, in earlier Annual Reports, the Bank has conceded that, with the benefit of hindsight, the easing of monetary policy in 1987 was somewhat greater than it should have been.[11] A number of commentators have focussed on this period to make criticisms of the conduct of monetary policy, some justified, others not.
Some of the criticisms which are wide of the mark include the following:
- that the Bank eased too much following the share market crash in October 1987. In fact, most of the easing had occurred well before the share market crash (the cash rate fell from 16½ per cent in January 1987 to 11 per cent in the week before the crash, while it only fell a further 3/4 per cent after the crash). The Bank was very active in talking to market participants, making public statements, and resisting an excessive fall in the exchange rate immediately after the share market crash, but it did not make a large adjustment to monetary policy (Figure 7);
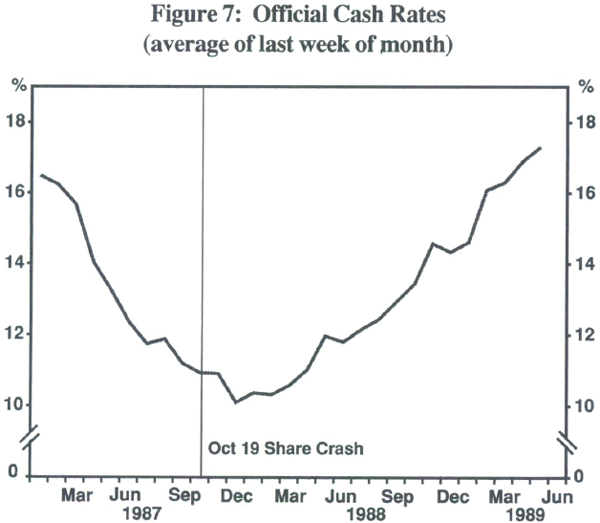
- that the Bank was slow to tighten in early 1988. In fact, Australia was the second country in the OECD area to tighten, and the first to do it by a significant degree. The United States edged up its federal funds rate in late February 1988, whereas our tightening took place in mid April 1988. By end May, Australia and the United States were still the only countries to have tightened – the United States by half a percentage point, Australia by 1½ percentage points. In the 10 months between April 1988 and February 1989, our interest rates were raised by 6 percentage points.
The legitimate criticism of monetary policy in this period was that interest rates were lowered too quickly in the first nine months of 1987. I do not wish to go back and reconstruct the period, but the decision seems to have stemmed from: (a) a belief that there was a trade-off between tighter fiscal policy and easier monetary policy; (b) a desire, for balance of payments purposes, to resist the appreciation of the exchange rate that was occurring because of an unforeseen lift in commodity prices; and (c) a reluctance to kill off an incipient pick-up in business fixed investment in the traded-goods sector that had been frustratingly long in coming.
Having conceded that monetary policy was eased too quickly during that period, I run the risk of opening the flood-gates whereby all subsequent ills are attributed to this relatively brief episode. In an attempt to reduce this tendency, it should be pointed out:
- it would be invalid to attribute the credit and asset price boom of 1983 to 1989 to an event which took place only in the latter part of the period;
- although the easing in monetary policy no doubt contributed to the strength of domestic demand in 1988/89, it was only part of the story and, I believe, the lesser part. The second half of 1987 and the full year 1988 was a period of strong growth in the whole OECD area (contrary to forecasts and initial assessments at the time). In Australia, this was magnified by the effects of a sharp improvement in the terms of trade which effectively added 2 percentage points to national income in 1988;
- the other main source of increased demand was business fixed investment. It is hard to believe that this could respond so quickly to a short-lived easing in monetary policy; a more likely explanation is that it was the inevitable lagged response to the big improvement in corporate profitability that had been occurring during the mid 1980s;[12] and
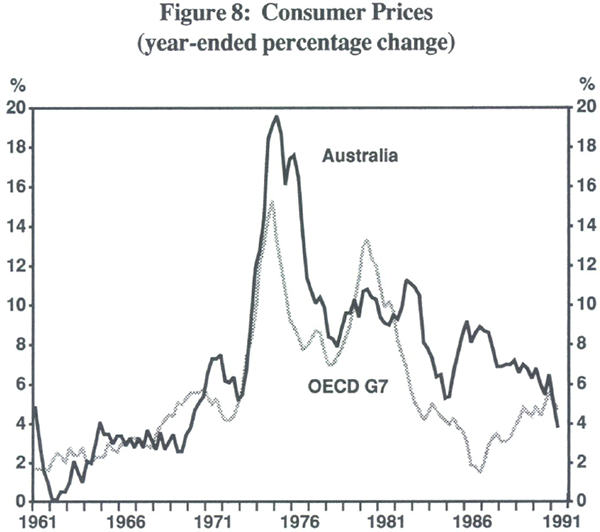
- Australia's inflation performance vis-a-vis the rest of the OECD area improved pretty steadily over the latter part of the 1980s and into the 1990s. After the devaluation-induced rise in inflation in the mid 1980s, Australia's inflation rate reached a peak of 7 percentage points higher than OECD inflation in December 1986 (Figure 8). The gap then declined almost continuously so that, by mid 1991, Australian inflation was lower than OECD inflation, the first time for a decade. The 1987 easing in monetary policy was not big enough to jeopardise this favourable trend.
5. Conclusions
The reader will by now expect some considered judgement on why the credit-asset price surge of the mid to late 1980s occurred. There can be little doubt that deregulation of financial intermediaries played a major role, but just as important was its timing. It was unfortunate that deregulation occurred at the very time that inflationary expectations were at their peak, and where conventional business wisdom viewed debt so favourably because of its perceived tax effectiveness.
Unfortunately, economic policymakers do not have a great deal of discretion as to the historical timing of major changes. The progressive weakening of the old regulated system under the pressure of emerging technology and international integration meant that major changes in the direction of deregulation were virtually inevitable in the early 1980s. We did not have the choice of the decade in which to deregulate. It cannot be denied, however, that the virtues of deregulation were oversold, but even if deregulation had occurred on a more modest scale, we would probably still have experienced some credit and asset price excesses. In both the United States and United Kingdom, although deregulation was more gradual than in Australia, there was a surge in credit and asset prices during the 1980s.
What could monetary policy have done about it? In principle, it would have been possible to devise a monetary policy tight enough to have prevented the acceleration in credit. However, it would have had to have been exceptionally tight, and in my view, tighter than would have been in the overall macro-economic interests of the country. As it was, monetary policy was characterised by the highest real interest rates in the OECD area, and was tight enough to contribute to a major reduction in the inflation rate. It would have been very costly for the economy as a whole to have tightened the screw with monetary policy sufficiently to offset all the the effects on credit of financial deregulation, in particular the increase in the number and size of providers of credit.
Looking back over a decade or so is only useful if it helps to prepare us for the coming decade. In economic policy, as, I suppose, in many other activities, it is possible to make two opposing sorts of errors – the first is to fail to learn from the lessons of history, and the second is to be guilty of “fighting the last war”. Are there any reasons to believe that the 1990s will be a repeat of the 1980s? I think not.
- Business attitudes towards acquiring debt have changed, and the health of balance sheets are now thought more important than exposure to capital gains. An essential ingredient in the predominance of the old debt-based business strategies was the expectation of relatively high inflation, which has now been clearly reduced. This, together with improvements in the tax system (most notably dividend imputation), has greatly reduced the attractiveness of the sort of business strategies that were dominant in the mid to late 1980s.
- Financial deregulation is not an event that can be repeated, and therefore competitive pressures described above will abate. Over the last couple of years, the number of financial intermediaries has fallen, and strategists are more concerned with returning to basics than with trying to expand into more services and more countries.
- The once-off shift in the profit share of GDP that occurred between 1983 and 1985 is unlikely to be repeated, since it restored factor shares to their longer-run average.
All in all, it is very hard to conceive of an excessive growth in credit and an excessive expansion in the supply of financial services occurring in the 1990s. What we should see is a return to normality, if not frugality. We should also see the present system being operated more skilfully as banks and their customers will have learnt from the errors of the 1980s.
There could also be some tendency for real interest rates to fall back to more normal levels from their exceptional height in the 1980s. Lower demand for credit should help in this process. So should the improvement in credit standards. Part of the reason why real interest rates had to be kept so high in the 1980s was to offset the low credit standards. Lower inflation also plays a vital role in this. Not only does it lead to a reduction in nominal interest rates, there is also evidence to suggest that it could contribute to lower real interest rates.[13] I know there are a number of commentators who keep reminding us that there is a world shortage of capital, and that demands for funds in Eastern Europe, Russia, the Middle East, etc. will push up real interest rates. I am sceptical of these claims; I think the factors listed above will be more important.
In summary, whereas the 1980s were characterised by very high real interest rates and low credit standards, the 1990s should see lower real interest rates but higher credit standards. This should be a much better combination. We have already established that high real interest rates and low credit standards gave a bias towards risky and speculative investments. As a result, even though the volume of investment undertaken in the 1980s investment boom was very high (as a proportion of GDP, it reached an all-time peak in 1988/89), we now know its composition left a lot to be desired. With more subdued conditions in the 1990s than in the 1980s, there may be less incentive to invest; it would be surprising if we saw an investment boom as large as that experienced in the late 1980s. However, the quality of the investment could well be a good deal higher. Lower inflation is the sine qua non for achieving this type of improvement in the composition of investments.
Footnotes
Assistant Governor (Economic), Reserve Bank of Australia. [1]
For example, Campbell Report (1981, pp. 121–123), Porter (1982), Macfarlane (1984) and Grenville (1989). [2]
The Reserve Bank Conference of 1989 was devoted entirely to this subject. See particularly Bullock, Morris and Stevens (1989). See also Grenville (1990 and 1991). [3]
Macfarlane (1989 and 1990). [4]
The list is, in descending order, Bond Corporation, News Limited, BHP, Fletcher Challenge, Qintex, Northern Star, Qintex Australia, Pacific Dunlop, North Broken Hill, Goodman Fielder Wattie, TNT, and Bougainville Copper. [5]
Ferguson (1989). [6]
See Valentine (1990) and Moore (1991). Harper and Lim (1989), on the other hand, writing in the middle of 1989 regarded monetary policy as being too tight. [7]
A common way to present this argument was to say credit was very expensive but was freely available. The only way to make sense of this shorthand phrase is to assume that it refers to the low credit standards rather than easy monetary policy. If this is so, I agree with it, but it is not a reflection on monetary policy but a reflection of some of the issues that were discussed in section 3 of the paper. [8]
The only person I have found to have followed this through to its logical conclusion is David Finch (1990). [9]
See Valentine (1990). He quotes a figure for average money base growth of 9.8 per cent per annum between 1983 and 1989. This is lower than for any other money or credit aggregate, and is, therefore, not an indication that monetary policy had been eased. [10]
See also Phillips (1990). [11]
In fact, business fixed investment had already picked up before the easing in monetary policy had been completed. It grew by 10 per cent in volume terms in the 12 months to June 1987, and by 19.6 per cent in the 12 months to June 1988. This is, of course, not a defence of the easing, it can only be used to counter the claim that the easing caused a subsequent surge in business fixed investment. [12]
Bullock and Rider (1991). [13]
References
Arndt, H.W. (1982), “Two Kinds of Credit Rationing”, Banco Nazionale del Lavoro, December.
Bullock, M., Morris, D. and Stevens, G. (1989), “The Relationship Between Financial Indicators and Economic Activity: 1968 to 1987”, Studies in Money and Credit, (eds), I. Macfarlane and G. Stevens, Reserve Bank of Australia.
Bullock, M. and Rider, M. (1991), “The Cross-Country Relationships Between Interest Rates and Inflation over Three Decades”, Reserve Bank of Australia Research Discussion Paper, April.
Ferguson, R.A. (1990), “Foreign Banks in Australia – A Strategic Reassessment”, Economic Papers, September.
Finch, D. (1990), “Foreign Debt: The Case for Bank Regulation”, IPA Review, Winter.
Grenville, S.A. (1990), “The Operation of Monetary Policy”, The Australian Economic Review, 2nd Quarter.
Harper, I.R. & Lim, G.C. (1989), “Is Monetary Policy Too Tight?”, Australian Economic Review, 2nd Quarter.
Macfarlane, I.J. (1984), “Methods of Monetary Control in Australia”, Paper presented to New Zealand Association of Economists at Massey University. Reprinted in The Economics and Management of Financial Institutions, (eds), D.J. Juttner and T. Valentine, Longman Cheshire, 1987.
Macfarlane, IJ. (1989), “Money, Credit and the Demand for Debt”, Reserve Bank of Australia Bulletin, May.
Macfarlane, IJ. (1990), “Credit and Debt: Part II”, Reserve Bank of Australia Bulletin, May.
Moore, J.D. (1991), Institute of Public Affairs Submission to the Parliamentary Inquiry into the Australian Banking Industry.
Phillips, M.J. (1990), “When the Music Stops”, Reserve Bank of Australia Bulletin, July.
Porter, M.G. (1982), “Monetary Targeting”, Australian Financial System Inquiry, Commissioned Studies and Selected Papers.
Smith, A. (1776), The Wealth of Nations, Modern Library edition, N.Y., 1937.
Stevens, G. (1991), “The Rise in Private Debt in the 1980s: Why Did it Happen, and Will it Continue in the 1990s?”, EPAC Background Paper, 14, June.
Stiglitz, J.E. and Weiss, A. (1980), “Credit Rationing in Markets with Imperfect Information”, American Economic Review, 71(3), 1981.
Valentine, T. (1990), “Financial Deregulation Revisited – A Rush to Judgement?”, ACC/Westpac Economic Discussion Papers, 1.
Appendix 1:
The Concept of Credit Rationing
It has been pointed out before that one of the disappointments of this period was that high interest rates turned out to be a slow way of reducing credit demand. For a borrower expecting share prices to rise by 30 per cent per annum (which actually happened for three years in a row), an interest rate of 20 or even 25 per cent did not seem to be a large deterrent. A related aspect of the clash between high real interest rates and credit growth that is worth examining is its unfavourable effect on resource allocation. To understand this, it is necessary to look more closely at the concept of credit rationing.
Deregulation was supposed to spell the end of credit rationing – the catch-phrase was “credit would always be available at a price”. In fact, the opposite should probably be the case. Even in a fully deregulated system, there are some borrowers who should not be able to get credit at any price. It is an important function of the banking system to bring this about. People who wish to borrow money for projects that are unlikely to be profitable, other than on the most unrealistic assumptions, should not obtain credit, while more realistic investment proposals should get the go-ahead. Banks are society's agents for performing this screening process, and they should do it by maintaining a sensible set of credit standards.[1]
It has long been recognised that allocating credit by raising interest rates can give unfortunate results if it is not accompanied by the maintenance of strict credit standards. As interest rates get higher, the more hard-headed, realistic businesses re-do their calculations and often find that projects are no longer viable at the higher interest rates. They probably do not even apply for credit, and shelve their plans for expansion. The optimists, on the other hand, with the expectation of rising asset prices, would still be queuing up to borrow. With financial intermediaries keen to grow, the risk is that they would accommodate the credit demands of these borrowers.
In economic terms, this is a case of adverse selection – a proportion of the good borrowers drop out, but the optimists and asset price speculators remain. The maintenance of high credit standards is supposed to mean that their proposals are rejected. If this were so, then the rising interest rates would have had a quick effect in slowing credit. However, most evidence suggests that credit standards were reduced as banks competed for business. This meant that not only did credit not slow quickly, but it was allocated disproportionately towards risky projects and optimistic borrowers.[2] When the monetary history of the 1980s comes to be written, perhaps a central story will be the link between high real interest rates and lowered credit standards.
Footnotes
Allowing banks to charge a higher interest rate (a higher margin above the prevailing cost of funds) does not alter this conclusion. This is because the higher interest rate can, in many circumstances, reduce further the likelihood that the project will be profitable. See Stiglitz and Weiss (1981) and Arndt (1982). [1]
Adam Smith perhaps said it better, when he observed that allocation of credit by higher interest rates could lead to a situation whereby “the greater part of the money which was to be lent, would be lent to prodigals and projectors, who alone would be willing to give this high interest. Sober people, who will give for the use of money no more than a part of what they are likely to make by the use of it, would not venture into the competition. A great part of the capital of the country would thus be kept out of the hands which were most likely to make a profitable and advantageous use of it, and thrown into those which were most likely to waste and destroy it”, The Wealth of Nations (1776). [2]
Appendix 2:
A Case Study: The Market for Investment Housing Loans
It would be very satisfying if it were possible to disentangle how much of the increased credit and reduction in credit standards was supply initiated and how much was demand initiated. It is not possible to do it because of the age-old “chicken and egg” problem that it involves. While it cannot be done at the aggregate level, or for that matter for business lending in general, there is some evidence from one particular form of lending that is quite illuminating. The lending in question is lending for investment housing.
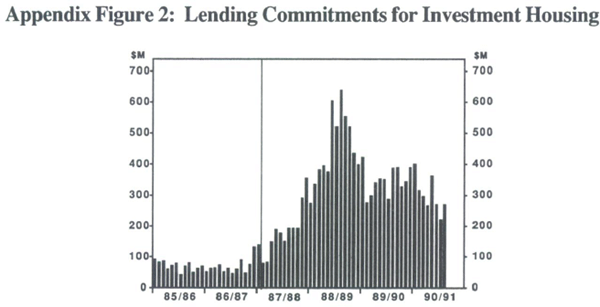
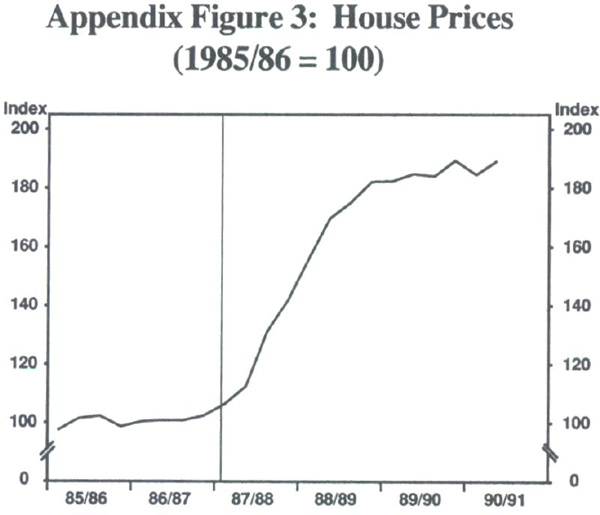
In the second half of 1987, banks' lending for investment housing started to rise quickly as banks began offering investment housing loans on either a fixed or floating rate basis. This was a virtually new product and many investors soon took advantage of it to buy residential real estate; the rate of lending rose five-fold between the second halves of 1987 and 1988 (Appendix Figure 2). Roughly coincident with a pick-up in this form of lending, housing prices rose sharply (Appendix Figure 3), and the correlation between these two lines is quite close. A simple supply explanation would say the increased lending pushed up house prices.
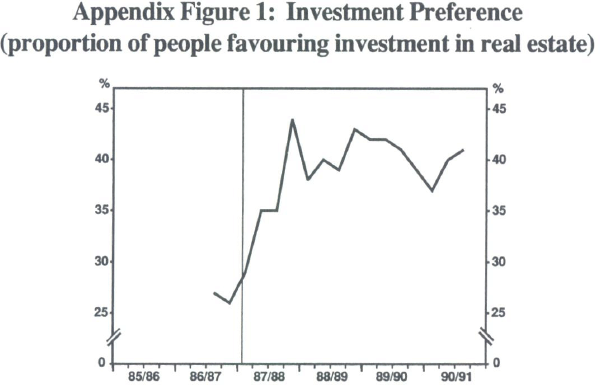
In this market, we are fortunate in also being able to obtain an indicator of demand for this type of credit. The magazine Personal Investment conducts a monthly survey where it asks respondents to nominate the most promising avenue for investment. The results are shown in Appendix Figure 1, which gives the proportion who regard investment in real estate as the best investment. It started to rise sharply during 1987 and early 1988 and remained high through 1988 and 1989.
Seen in this light, the rise in bank lending for investment housing merely accommodates the increased demand by borrowers. Further evidence in favour of the demand explanation is that we know that in August 1987 there was a policy change which caused the demand for borrowing for investment housing to shift outwards. The policy change was the re-introduction of the ability to write off interest payments against other taxable income (negative gearing). Thus, what appeared to be a supply explanation for increased credit, turns out to be a demand explanation on closer scrutiny.