Bulletin – March 2017 Australian Economy The Recent Economic Performance of the States
- Download 1.61MB
Abstract
Economic growth in Australia's south-eastern states has underpinned a gradual strengthening in the non-mining economy in recent years. In contrast, economic conditions have been weaker in Western Australia and Queensland as the large-scale mining investment in these states has concluded. Differences in investment have been a key source of regional variation in activity, but there are also common themes across a range of economic indicators, such as growth in the services sector.
Introduction
It is important to consider regional variation in economic activity to understand aggregate activity and the transmission of monetary policy. This is particularly the case during periods of significant structural adjustment in the economy, as has occurred in Australia since the mid 2000s. The Reserve Bank analyses a wide range of data on the states and territories, as well as input from the Bank's liaison program conducted by staff across Australia, to inform monetary policy decisions.[1]
Large movements in commodity prices and mining investment have been key forces shaping the Australian economy since the mid 2000s, and in turn help to explain much of the variation in economic outcomes across the states and territories over this period.
Investment in the mining sector grew strongly as businesses responded to the historically high level of commodity prices. The contribution to economic growth was most pronounced in Western Australia and Queensland, which have the highest concentration of mineral and energy resources. Other states benefited directly through smaller mining operations and indirectly through business services activity and positive income effects such as higher government revenues.
As the mining investment cycle concludes, other sectors have strengthened, supported by low interest rates and the depreciation of the exchange rate since 2013. Easier financial conditions have supported economic growth across the country, though the pick-up has been most pronounced in the south-eastern states, where non-mining business investment and household dwelling investment have been stronger. Sustained growth in the large and diverse household and business services sectors has been common across the states.
Growth in the non-mining economy has sustained a gradual improvement in labour market conditions and the unemployment rate has declined in most states since 2014. A degree of labour market flexibility has meant that the unemployment rate in the resource-rich states has increased by less than would otherwise have been the case.
Economic Growth
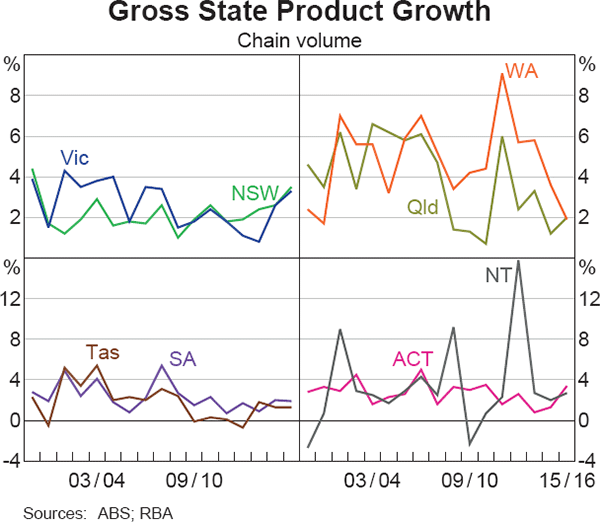
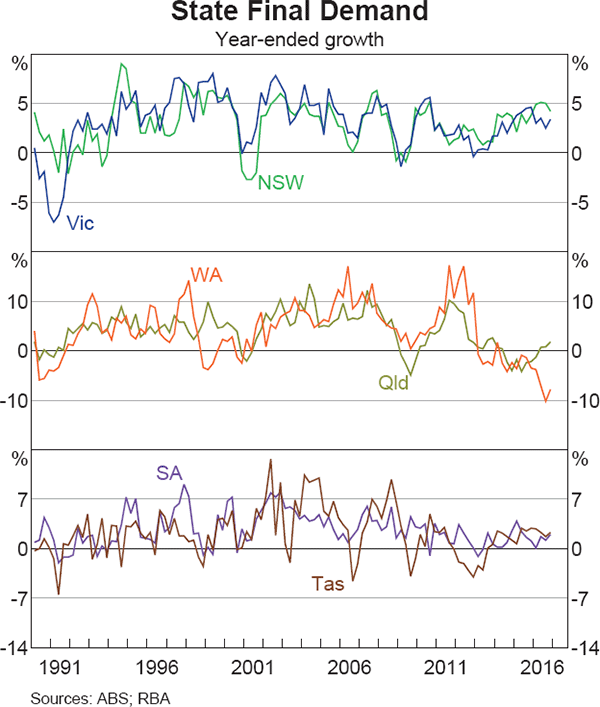
Economic growth in New South Wales and Victoria, the two largest state economies, has strengthened over recent years.[2] Gross state product (GSP), the headline measure of state economic activity, increased in both states by 3½ per cent in 2015/16 (Graph 1). This was the fastest rate of growth in well over a decade for New South Wales, and for several years for Victoria. Less comprehensive measures of activity, such as state final demand, indicate that this improvement continued in the second half of 2016 (Graph 2).[3] Economic growth in South Australia and Tasmania has also picked up modestly in recent years, but has been lower than the other states, consistent with lower rates of population growth.
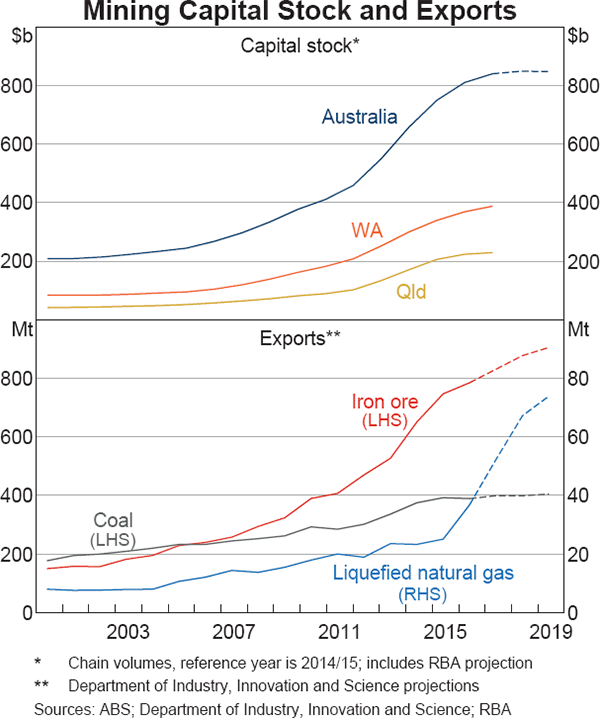
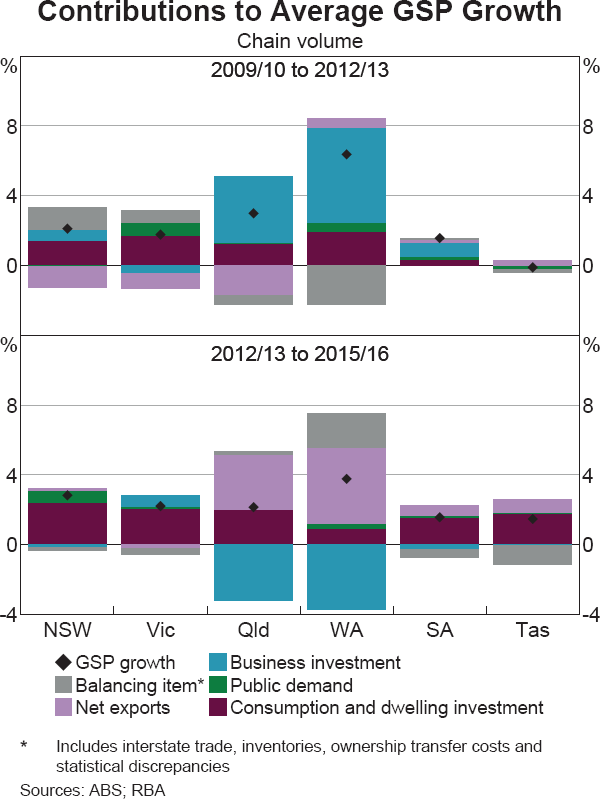
GSP growth in the resource-rich states of Western Australia and Queensland has eased from the rapid rates earlier in the decade. Following the peak in bulk commodity prices in 2011, mining investment has declined considerably since 2012/13 as resource projects have gradually been completed and few new projects have commenced. The increase in the mining capital stock in these states has been substantial, and represents a very large increase in productive capacity (Graph 3). As a result, average GSP growth after the peak in investment activity remained firm in Western Australia and Queensland due to the large increase in mining production and commodity exports brought about by this investment (Graph 4). While production of bulk commodities is not anticipated to increase much over the next couple of years, production and exports of liquefied natural gas (LNG) is expected to rise substantially.
Growth in GSP in Western Australia was 2 per cent in 2015/16, its slowest pace in 15 years, while state final demand (which does not capture exports) declined by around 8 per cent over 2016. Recent economic activity in Queensland has been more mixed; although the decline in mining investment has weighed heavily on some parts of regional Queensland, the mining sector accounts for a much smaller share of the state economy than it does in Western Australia.[4] Moreover, conditions in some parts of the state have been very positive and have benefited from a pick-up in dwelling investment and tourism.
Investment Cycles
Business investment is a key driver of economic demand and productivity growth, and a source of variation in activity between the states. Although investment accounts only for a moderate share of economic activity on average, shorter-run cycles in business investment can be pronounced (Graph 5). The mining investment cycle accounts for much of the variation in economic activity across states and territories since the mid 2000s, but cycles in other types of investment, such as dwelling investment by households, have been another source of variation more recently.
Growth in national non-mining business investment has been weak over the past decade, but this masks important differences by state. Non-mining business investment has increased in New South Wales and Victoria in recent years alongside the improvement in business conditions and demand in those states. In contrast, non-mining investment in Western Australia and Queensland has decreased, as the decline in mining investment also weighed on non-mining activity (see ‘Box A: Non-mining Business Investment by State’).
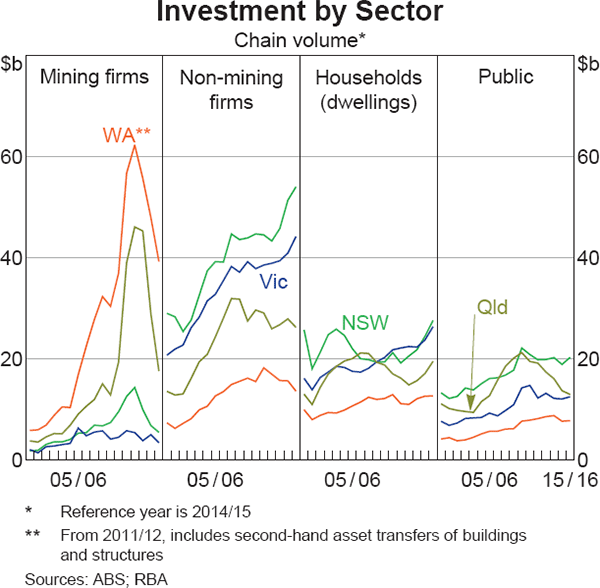
In aggregate, dwelling investment has grown strongly since 2013, which has helped to offset the downturn in mining investment. The low level of interest rates is supporting activity in all markets, but growth in dwelling investment by state has varied, in part due to differences in underlying housing market conditions and population growth. In Perth, a strong pick-up in residential construction helped to offset the initial decline in mining investment, but housing market conditions have since weakened considerably, and dwelling investment has declined over the past year or so. Housing price growth in recent years has been much stronger in Sydney and Melbourne than in the other capitals, in turn providing strong support for the development of new housing in these cities (Graph 6).
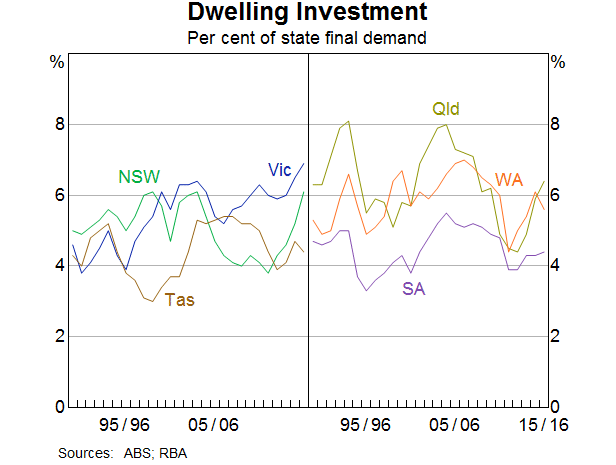
Residential building approvals, which are a leading indicator of dwelling investment, appear to have peaked (Graph 7). However, a significant volume of construction work is yet to be completed, particularly in New South Wales and Victoria, which will continue to support dwelling investment activity in the south-eastern states for the next two years.
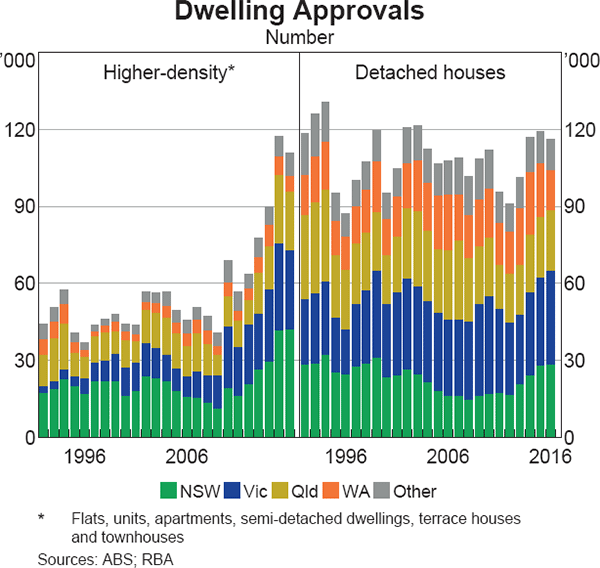
Public investment has been broadly flat across most states for several years. However, state government budget estimates suggest that public capital expenditure will make a more meaningful contribution to growth over coming years, particularly in New South Wales and Victoria where there is a substantial pipeline of infrastructure activity. A large proportion of capital expenditure in these states has been directed to high-profile road and rail transport projects. Beyond the direct contribution to economic growth in these states, feedback from firms in the Bank's business liaison program suggests this pipeline of activity has provided opportunities for a range of firms previously focussed on providing services to the mining sector, and has also bolstered business confidence.
Box A
Non-mining Business Investment by State
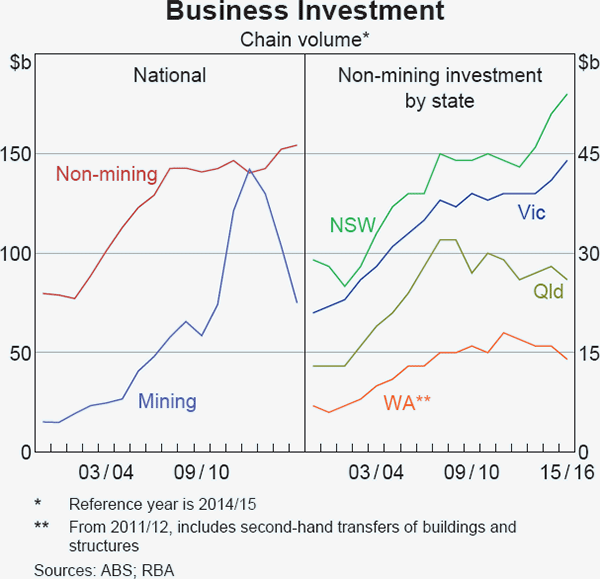
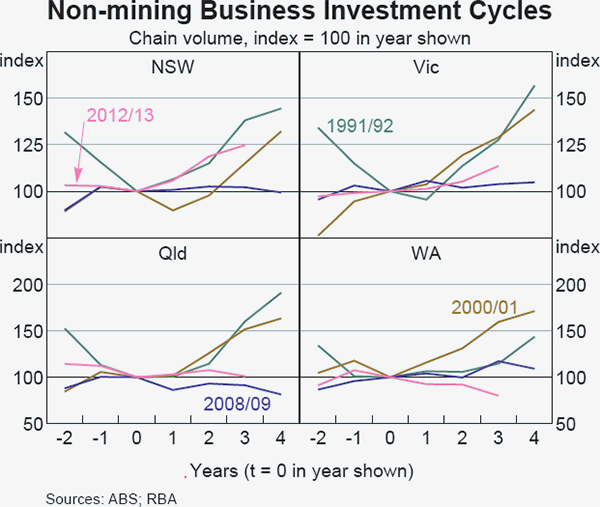
Growth in aggregate non-mining business investment has been very weak over the past decade, but this masks significant regional variation (Graph A1).[1] Subdued business investment outside the mining sector was one of the ways in which the Australian economy accommodated the unprecedented increase in mining investment. As mining investment has declined, however, non-mining business investment has remained subdued; many other advanced economies have also experienced sustained weakness in business investment. A range of cyclical and structural explanations have been put forward for subdued non-mining business investment in Australia.[2] Themes emerging from the Bank's liaison with firms include uncertainty about future demand growth, heightened aversion to risk and insufficient demand to warrant expansion (Lane and Rosewall 2014). State-based variation goes some way towards explaining the weak growth in aggregate non-mining business investment.
Non-mining business investment in New South Wales and Victoria has increased over the past three years, alongside a broader improvement in state demand. New South Wales has recorded the strongest growth over this period, with non-mining business investment growing by an average of 8 per cent annually, which is a similar pace of growth to earlier investment cycles (Graph A2). In Victoria, investment has grown at a slower rate of 4 per cent per year over the same period, which is somewhat weaker than in previous cycles. In contrast, non-mining business investment in Queensland and Western Australia peaked during the mining boom, and has since declined.
Much of the recent investment growth in New South Wales and Victoria has been driven by business services, including by rental, hiring & real estate, professional & technical services, and financial & insurance services firms (Graph A3; note that state-based data by industry include public investment). These firms make up a large part of the New South Wales and Victorian economies. While business services firms are often thought of as labour intensive, in practice they can be relatively capital intensive. For example, the construction of office buildings has been a key driver of the recent growth in investment in New South Wales. Conditions in office markets have strengthened considerably in Sydney over the past year, which should support further development activity. Capital expenditure by the household services sector has also contributed to investment growth in New South Wales. While private firms have increased investment in response to strong demand (for example, for accommodation), part of the growth is due to public investment in education and health.
In contrast, investment in goods-related industries (including manufacturing, utilities, construction and wholesale & retail trade) has been little changed in New South Wales and Victoria since 2013. Nevertheless, there are some sub-industries where investment conditions have improved. The underlying improvement in consumption growth, as well as an increasingly competitive retail environment, has driven a strong increase in investment by retailers and wholesalers, especially in Victoria. Investment by manufacturers has stabilised, following several years of decline, consistent with the recent improvement in conditions in the sector.
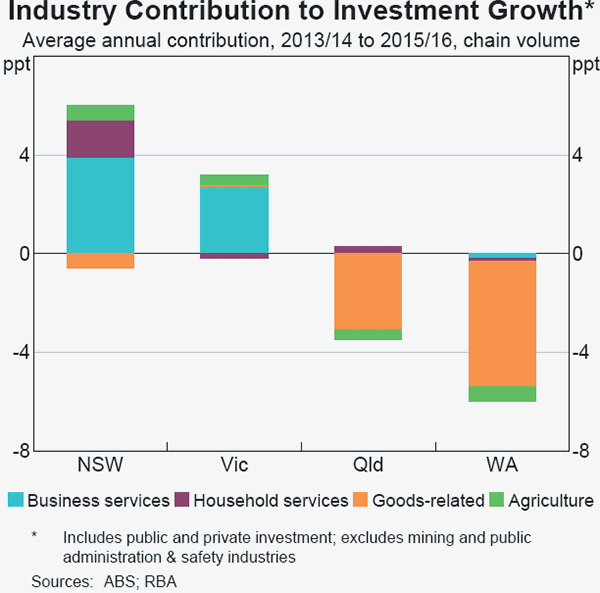
The decline in non-mining business investment in Queensland and Western Australia over recent years has been associated with the large falls in mining investment. During the earlier upswing in mining investment, many non-mining firms in these states provided goods and services to the mining industry; for example, manufacturers, construction contractors, transport and equipment hire firms. Commodity prices were at historical highs, and this was reflected in contractor rates paid by mining firms and the wages of employees. These non-mining firms responded to the increase in demand and profitability by expanding capacity. Furthermore, population and wage growth drove a broader increase in household consumption, benefiting a broad range of firms not directly involved with mining activity. As commodity prices declined, mining firms shifted from expansion to cost-cutting. As part of this process, contractor rates and wages have also declined, reducing demand for goods and services and weighing on the investment plans of a wide range of non-mining firms.
Industry Developments
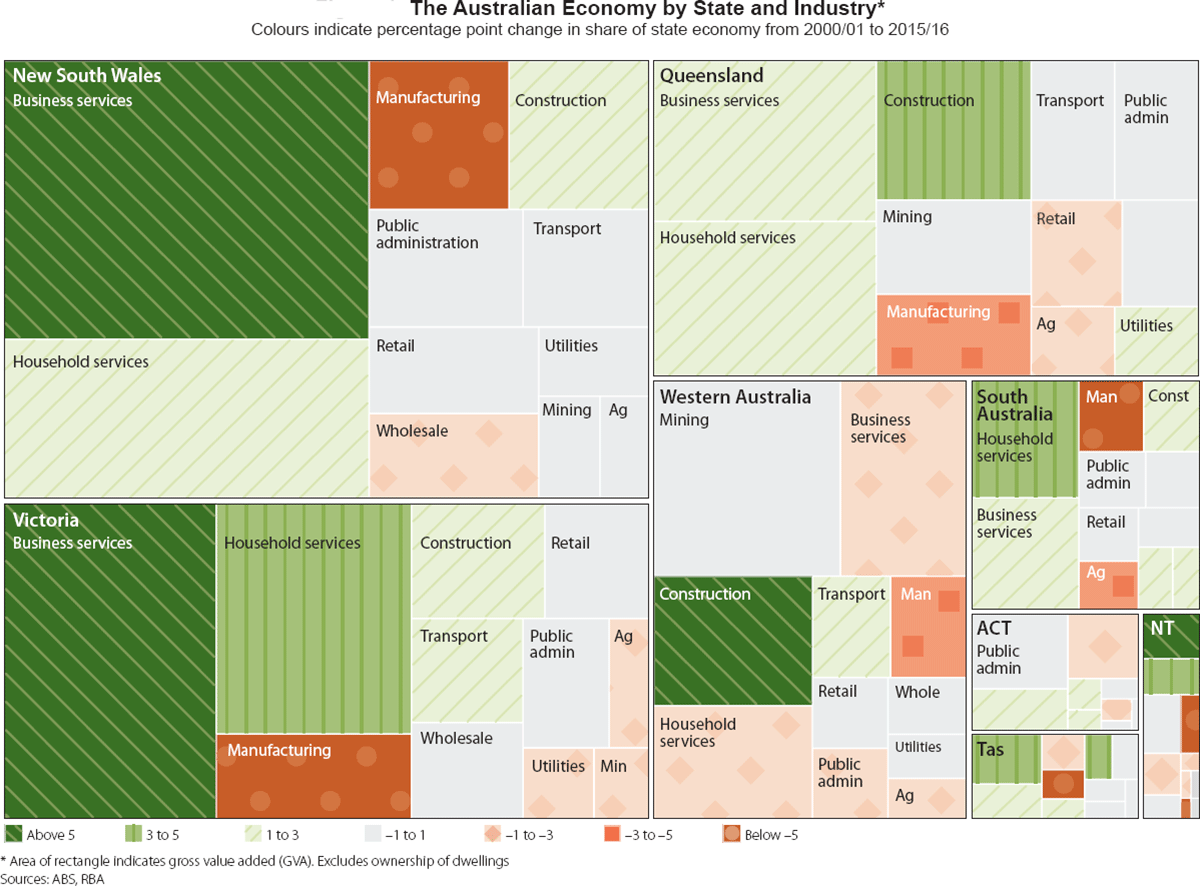
The mining investment boom affected the industry structure of some states, but by less than longer-run structural changes such as the growth in the services sectors. Business and household services are by far the largest industries in most states and territories (except Western Australia where mining predominates) and these industries continue to grow as a share of total activity (Figure 1; also see Table A2).
New South Wales and Victoria have disproportionate shares of business services activity, reflecting the status of Sydney and Melbourne as large business and financial centres. Strength in dwelling investment has supported a wide range of professional services in these states, such as architecture and legal services. There has also been strong demand for information technology services, as firms have sought to harness advances in technology to improve efficiency and minimise costs. Much of the activity in this sector is targeted at the domestic economy, but business services exports have also grown steadily over the past several years, partly in response to the depreciation of the Australian dollar. Liaison with firms suggests that the recent growth in business services exports also partly reflects a concerted effort by mining services firms, particularly in the resource-rich states, to source more work from overseas markets as local conditions have deteriorated.[5]
The depreciation of the Australian dollar since 2013 has helped to improve the competitiveness of other highly trade-exposed industries, including manufacturing. Although the share of manufacturing in all state economies has declined considerably over decades, conditions in the sector have improved recently across a few states, particularly in food & beverage and pharmaceutical production (Langcake 2016).
The depreciation of the Australian dollar has also benefited domestic tourism.[6] All states have recorded an increase in international tourism numbers and spending, though growth in visitors to Tasmania has been particularly strong. The lower dollar also means greater numbers of Australian residents opt to travel locally, rather than overseas. Again, Tasmania has benefited disproportionately.
Households
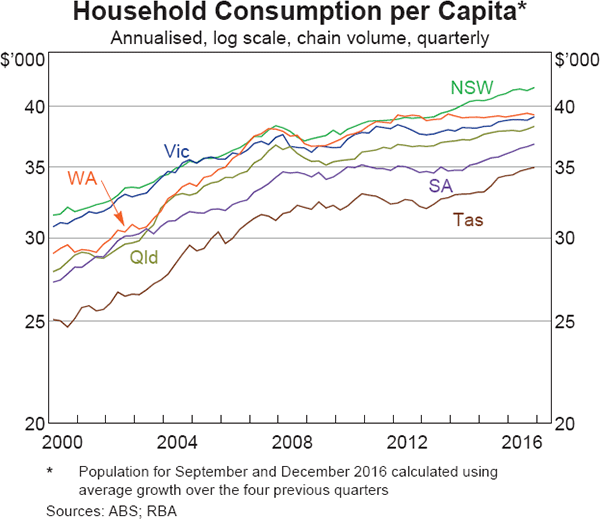
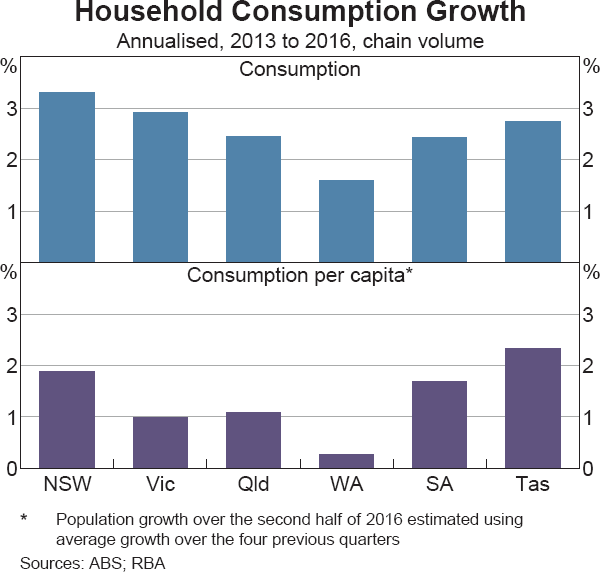
Differences in long-term trends in household consumption spending across states tend to be relatively small (Graph 8). Households tend to smooth consumption over time, which can mitigate differences in consumption growth between the states, as can government policies designed to reduce differences in income growth. Nevertheless, consumption growth in Western Australia has been weak in recent years, both in aggregate and in per capita terms. Aggregate consumption growth in the other states has been relatively even since 2013, through some differences emerge once population growth is accounted for (Graph 9). For example, population growth has made a large contribution to aggregate consumption growth in Victoria, whereas stronger per capita income growth has been a larger driver of growth in New South Wales. Growth in per capita consumption in Tasmania has been supported by the strong growth in tourism activity. Growth in consumption in South Australia has also been relatively firm in per capita terms.
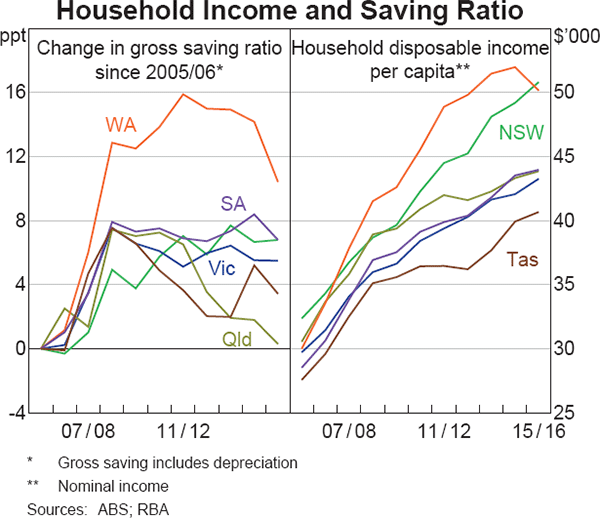
At the national level, consumption has been growing faster than household income and the saving ratio has declined gradually for several years. Much of the decline has been driven by a decline in the saving ratios in Western Australia and Queensland (Graph 10). Western Australian households benefited from a rapid increase in household disposable income and wealth during the mining boom, and the gross saving ratio peaked at around one-quarter of incomes at the height of the boom. Households have subsequently used this buffer to support consumption as income growth has waned.
Population and Labour Market Developments
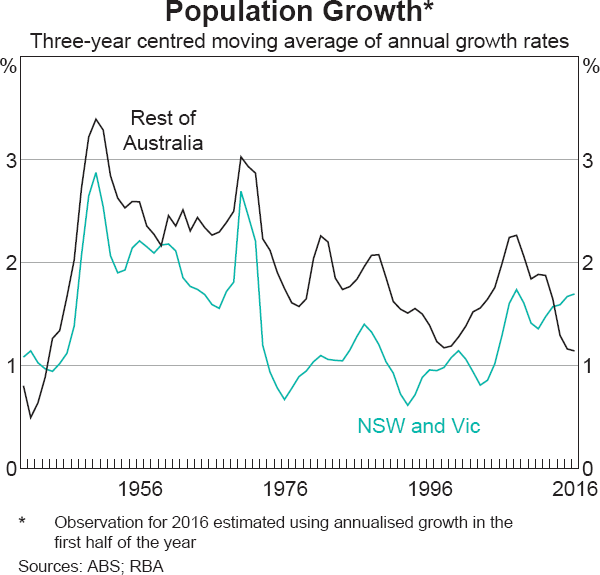
Shifts in population growth and a degree of labour market flexibility have assisted the transition in economic activity associated with the mining investment cycle. Growth in the Australian population has slowed in recent years owing to a much slower rate of net overseas migration to the resource-rich states. There has also been a net outflow of interstate migrants from Western Australia in recent years. These flows partly reflected the departure of mining and construction workers, who had moved to the resource-rich states during the boom in investment, as projects were completed. Also, far fewer people have moved to these states in recent years, including those moving from overseas. In contrast, population growth in New South Wales and Victoria has strengthened to consistently exceed that in the rest of the country for the first time in decades (Graph 11). Population growth in these states has been driven by net overseas migration, and in Victoria also by interstate migration.
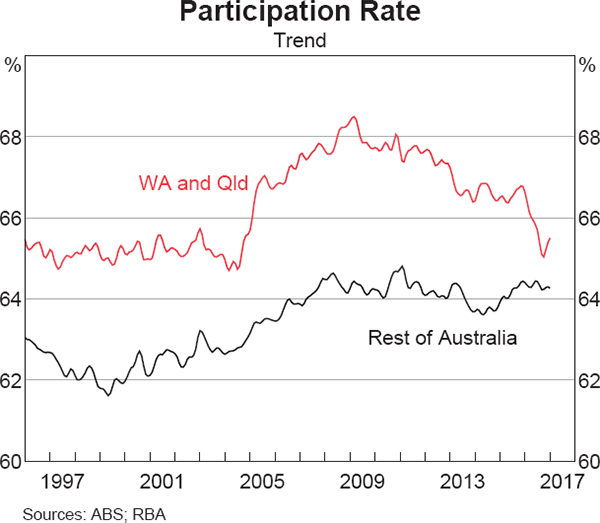
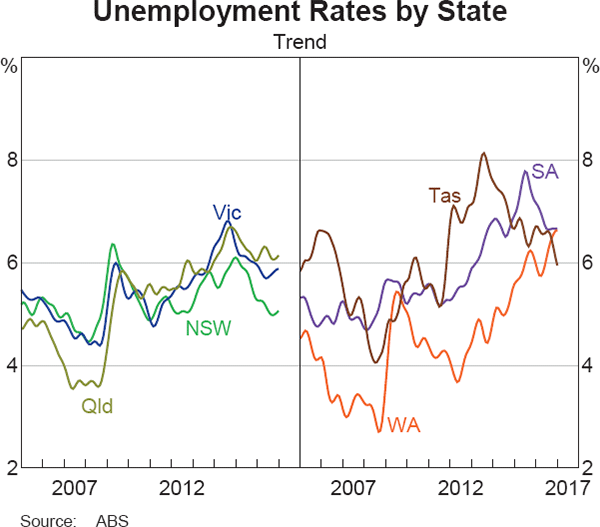
In the resource-rich states, the labour market adjustment to the decline in mining investment has occurred across several dimensions. Population growth has slowed, participation rates have fallen, and part-time work has become more common (Graph 12). As a result, unemployment rates in these states have increased by less than would otherwise have been the case (Graph 13). Employment growth has been relatively strong in New South Wales and Victoria, driving a steady improvement in the unemployment rate in both states. The unemployment rate in New South Wales has fallen to 5 per cent in recent months, to be around its lowest levels in close to a decade.
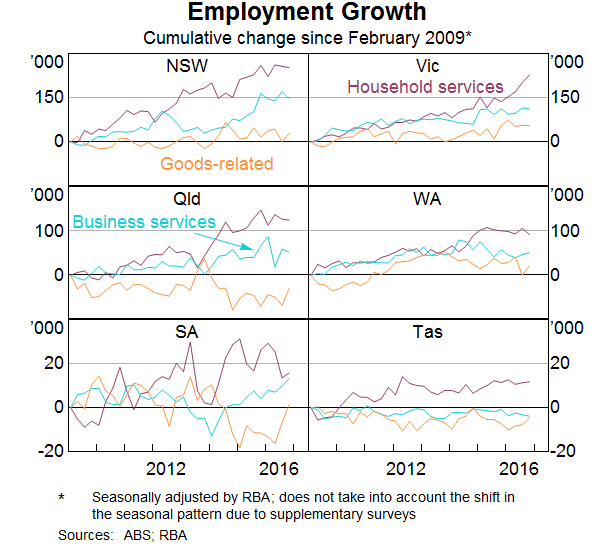
The pattern of employment growth has been fairly similar across the states over recent years. Growth in household services employment, particularly in health and education employment, has underpinned employment growth across the country (Graph 14). Business services employment has contributed to growth in most states, while the level of employment in the goods-related sector has typically remained steady or declined.
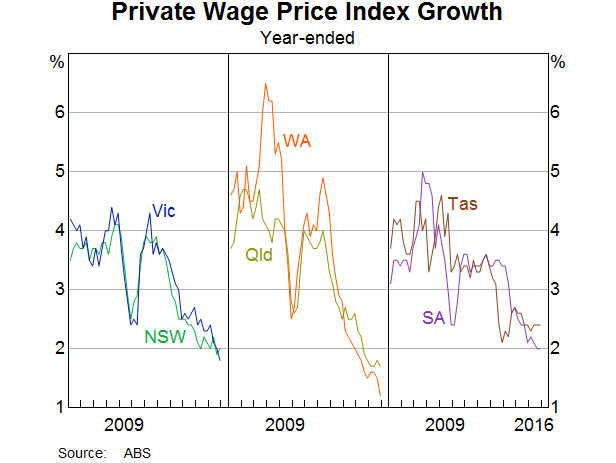
Although labour market conditions have varied across states, wage growth has been weak everywhere. In the non-mining states, private sector wage growth has declined to be around 2 per cent (Graph 15). Average wage growth in Western Australia and Queensland has been weaker recently, in part due to pronounced weakness in mining and mining-related wages, though this follows a period of rapid wage growth at the height of the mining investment boom.
Conclusion
New South Wales and Victoria have emerged as the drivers of economic growth in recent years, as part of a broader, gradual strengthening in non-mining activity supported by the depreciation of the Australian dollar since 2013 and low interest rates. Domestic conditions in Western Australia and Queensland have weakened considerably alongside the decline in mining investment, though overall rates of economic growth have remained positive, in part due to growth in commodity exports. The mining investment cycle has been a key source of variation in economic growth across the country, but its impact has been mitigated by a degree of flexibility in the economy. Labour markets have adjusted along several dimensions to help contain the increase in unemployment, aided by shifts in population growth. Adjustments in household saving have helped contain differences in consumption growth. The relatively diverse services sectors have been key contributors to economic and employment growth in most states.
Appendix A: Indicators of State Size and Industry Composition
| NSW | Vic | Qld | WA | SA | Tas | |
|---|---|---|---|---|---|---|
| GSP share | 32 | 22 | 19 | 15 | 6 | 2 |
| Population share(a) | 32 | 25 | 20 | 11 | 7 | 2 |
| Employment share(a) | 32 | 26 | 20 | 11 | 7 | 2 |
| Exports share(b) | 21 | 12 | 20 | 38 | 5 | 1 |
|
(a) As at June 2016 Sources: ABS; RBA |
||||||
| NSW | Vic | Qld | WA | SA | Tas | Aus | |
|---|---|---|---|---|---|---|---|
| Agriculture, forestry and fishing | 2 | 2 | 3 | 2 | 4 | 9 | 2 |
| Mining | 2 | 2 | 7 | 23 | 3 | 1 | 6 |
| Manufacturing | 6 | 7 | 6 | 5 | 7 | 7 | 6 |
| Electricity, gas, water and waste services | 2 | 2 | 3 | 2 | 3 | 4 | 2 |
| Construction | 6 | 6 | 10 | 13 | 7 | 7 | 8 |
| Wholesale trade | 4 | 5 | 5 | 3 | 4 | 3 | 4 |
| Retail trade | 4 | 5 | 5 | 3 | 5 | 6 | 4 |
| Transport, postal and warehousing | 4 | 5 | 6 | 5 | 5 | 7 | 5 |
| Public administration and safety | 5 | 4 | 6 | 3 | 6 | 6 | 5 |
| Business services | 30 | 27 | 18 | 16 | 19 | 15 | 24 |
| Of which: | |||||||
| Financial and insurance services | 13 | 11 | 6 | 4 | 7 | 6 | 9 |
| Professional, scientific and technical services | 7 | 8 | 5 | 5 | 5 | 3 | 6 |
| Household services | 17 | 18 | 17 | 12 | 20 | 21 | 17 |
| Of which: | |||||||
| Health care and social assistance | 6 | 7 | 7 | 5 | 9 | 9 | 7 |
| Education and training | 5 | 6 | 5 | 3 | 5 | 7 | 5 |
| Other(b) | 17 | 17 | 15 | 12 | 15 | 14 | 16 |
|
(a) Gross industry value added as a share of GSP Sources: ABS; RBA |
|||||||
Footnotes
The authors are from Economic Analysis Department, and would like to thank John Boulter for his contribution to the article. [*]
The Reserve Bank business liaison team conducts around 70–80 discussions each month with firms, agencies and community groups. Discussions with any individual contact typically occur every 6 to 12 months. Bank staff usually meet with the chief executive officer, chief financial officer and/or operations manager. Liaison meetings are held nationally with firms of all sizes, though most discussions are with mid-sized and large firms, where conditions are somewhat more likely to reflect economy-wide trends rather than firm-specific factors. For more information, see RBA (2014) and Heath (2015). [1]
See Table A1 for summary statistics of state size. [2]
State final demand measures consumption and investment spending by the household, business and government sectors. It is different from GSP as it excludes international and interstate trade as well as the change in inventories. State final demand is published as part of the quarterly national accounts whereas GSP is published annually. [3]
See Table A2 for industry shares of state production. [4]
More broadly, the domestic services sector also constitutes a higher share of Australia's value-added exports than implied by gross exports because of its indirect exposure to trade, as services are extensively used as inputs to produce goods exports (Kelly and La Cava 2014). [5]
‘Tourism’ is not defined as a distinct industry in the ABS national accounts, as industries are classified according to the products produced rather than customer status. Tourism contributes to activity in a range of industries, including household services, transport and retail. [6]
References
Elias S and C Evans (2014), ‘Cycles in Non-Mining Business Investment’, RBA Bulletin, December, pp 1–6.
Heath A (2015), ‘The Role of the RBA's Business Liaison Program’, Address to the Urban Development Institute of Australia (WA Division Incorporated) Luncheon, Perth, 24 September.
Kelly G and G La Cava (2014), ‘International Trade Costs, Global Supply Chains and Value-Added Trade in Australia’, RBA Research Discussion Paper No 2014-07.
Kent C (2014), ‘Non-mining Business Investment – Where to from Here?’, Address to the Bloomberg Economic Summit, Sydney, 16 September.
Kent C (2016), ‘Australia's Economic Transition – State by State’, Address to the Australian Business Economists Conference Dinner, Sydney, 22 November.
Lane K and T Rosewall (2015), ‘Firms' Investment Decisions and Interest Rates’, RBA Bulletin, June, pp 1–7.
Langcake S (2016), ‘Conditions in the Manufacturing Sector’, RBA Bulletin, June, pp 27–33.
RBA (Reserve Bank of Australia) (2014), ‘The RBA's Business Liaison Program’, RBA Bulletin, September, pp 1–5.