Bulletin – December 2017 Global Economy Underlying Consumer Price Inflation in China
- Download 1.39MB
Abstract
Underlying inflation measures seek to look through the volatility often inherent in headline inflation, and can be useful for assessing inflationary pressures in a given economy. This article describes new trimmed mean measures of underlying inflation that we have constructed for China and compares their performance with other measures of underlying consumer price inflation. A range of underlying inflation measures suggest that inflationary pressures have increased gradually since early 2016, although they remain low by historical standards.
Introduction
While China's central bank, the People's Bank of China (PBC), is not an explicit inflation targeter, the Chinese authorities have indicated concern about inflation because it can affect the wellbeing of households, and extremely high inflation can harm social stability.[1] Each year, targets for consumer price inflation are set by the State Council, China's primary administrative authority, and are announced at the annual meeting of the National People's Congress (the national legislature) along with the target for economic growth. The 2017 consumer price index (CPI) inflation target was set at ‘around 3 per cent’.
The headline CPI is the most commonly published measure of inflation faced by households, but it can be volatile and does not necessarily provide the best indication of overall inflationary pressures. Measures of underlying inflation that seek to look through this noise are typically monitored in conjunction with headline measures. This article examines the performance of measures of headline and underlying inflation in China, and provides an assessment of current inflationary pressures. It focuses in particular on the construction of new trimmed mean measures, which have been estimated using the detailed data published by China's National Bureau of Statistics (NBS).
Headline Inflation
China's NBS publishes a monthly headline CPI, as well as indices for eight major expenditure categories in the CPI basket: food, alcohol & tobacco; residence; clothing; transport & communication; health; household durables & services; education & recreation; and a miscellaneous category. Price indices for numerous sub-components within each of these categories are also published. For example, separate price indices are available for the grains, pork and vegetables subcomponents of the food category. In total, the NBS published price indices for more than 50 subcomponents between 2006 and 2015 and around 30 since 2016.
Most of the variation in China's CPI has been driven by the food component, due to its high weight in the CPI basket (around a third) and the inherent volatility that characterises food prices given their susceptibility to supply-side shocks (Graph 1). For example, a sharp food price increase in late 2010 followed a drought in China's South-Western region, which cut the area's production of commodities such as grain and vegetables (Zhang and Zuo 2010). Since 2012, CPI inflation in China has remained in a relatively narrow range, partly due to more stable food price inflation. This has reflected structural changes to food production in China, which have reduced cyclicality in prices (RBA 2016). In early 2017, lower food prices arising from an abundant supply of fresh vegetables placed downward pressure on inflation.
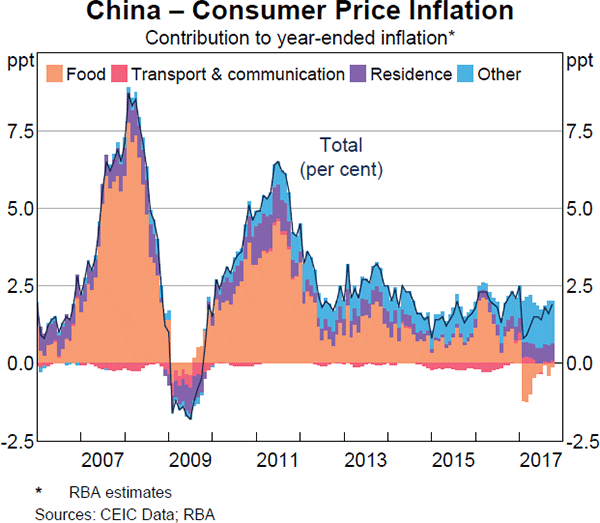
The residence category contributed only a little to inflation over the past decade, despite large changes in housing prices, because the NBS uses the relatively static mortgage interest rate as the measure of the cost of buying a house (Orlik 2011). A decline in fuel prices weighed modestly on China's CPI from late 2014 to early 2016, in line with lower global oil prices. As oil prices partly recovered over the subsequent year or so, fuel prices contributed a little to inflation. Although it has a relatively small weight in the CPI basket, there has been an increase in inflation in the health component in recent years, which has supported strength in ‘other’ inflation. This is because population ageing and rising incomes have contributed to increased demand for medical services (World Bank et al 2016). Year-ended inflation in the health price index is currently around 7¼ per cent, well above the inflation rate for any of the other major CPI expenditure categories.
Measures of Underlying Inflation
Measures of underlying inflation can be useful for gauging persistent inflationary pressure given that month-to-month movements in headline inflation can be volatile. While true underlying inflation is not observable, it is possible to construct measures of underlying inflation that abstract from or moderate the effects of short-term movements in the CPI. One desirable property of an underlying inflation measure is ‘smoothness’, since underlying inflation should be fairly persistent and evolve slowly based on variables such as inflation expectations and the gap between actual and potential output (Brischetto and Richards 2006). For ease of interpretation, it is desirable for the underlying measure of inflation to be unbiased with respect to the headline measure – that is, to have a similar long-run average. There are many methods used to estimate underlying inflation, but two common gauges are exclusion-based measures and trimmed means.[2]
Exclusion-based measures
Exclusion-based measures of underlying inflation are the most common measures. They exclude a set of particularly volatile items from the calculation of the headline figure (typically, fresh food and energy). The Chinese NBS publishes two exclusion-based measures: CPI excluding food, and CPI excluding food and energy (Graph 2).
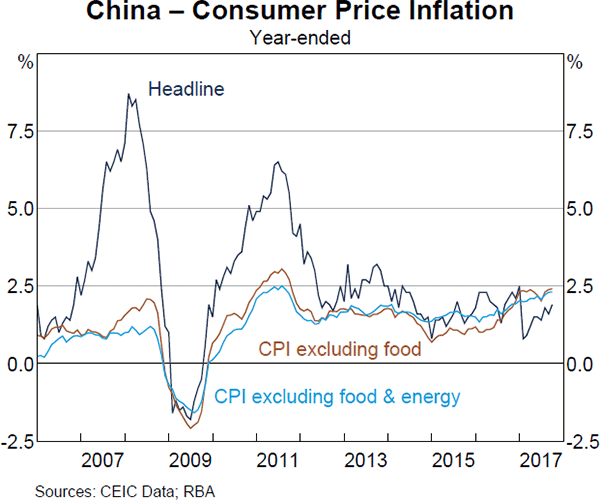
Exclusion-based measures have the advantage of being easy to calculate and interpret. However, they may provide misleading information about inflationary pressures when items retained in the consumption basket are affected by temporary factors. In addition, excluded items may contain valuable information about inflation, especially if they exhibit different underlying trends to those retained in the basket. This is the case for China, where food makes up a large share of the CPI and rapid food price inflation has meant that exclusion-based inflation measures have been noticeably lower than other measures for most of the past decade. As a result, these exclusion-based measures do not provide an accurate gauge of the level of overall inflation faced by households over this period.
Trimmed means
Trimmed mean measures of inflation are generally calculated as the average rate of inflation after ‘trimming’ away outliers. They are calculated by ordering the price changes for all components in each period from lowest to highest and excluding a certain percentage of the upper and lower tails of the distribution of price changes. Average inflation is then calculated from the remaining components. For example, a 10 per cent trimmed mean (which removes 10 per cent from each end of the distribution) could be calculated for March 2016 by taking the weighted-average inflation rate of the red bars in Graph 3.
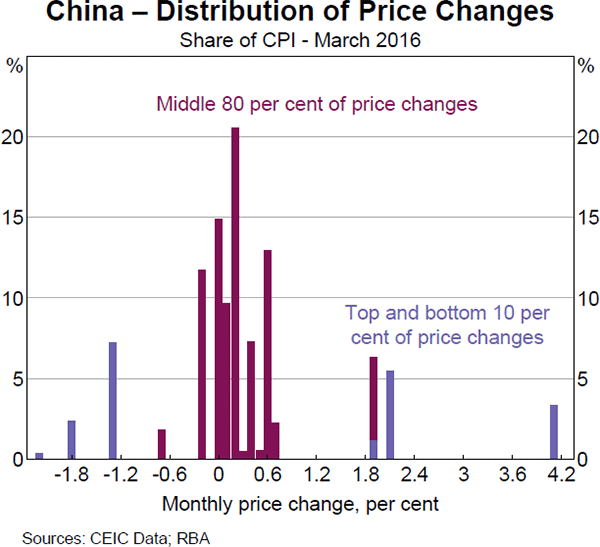
Trimmed-mean measures of underlying inflation temper the effect of very large price changes which may not be representative of price changes of other goods and services. For a range of advanced economies, trimmed means have been found to outperform exclusion-based measures of underlying inflation on a number of criteria, including unbiasedness and the ability to forecast inflation.[3] While trimmed-mean inflation is not published by the NBS, we describe how these measures can be estimated in the following section.
Estimation of Trimmed Mean Inflation
Chinese CPI weights estimation
While the NBS does not publish the weights assigned to the components of the CPI
basket, they can be estimated using the published headline CPI inflation rate
(πt) and the published inflation rates for each of the
eight major expenditure categories (πi,t,i
=1,…,8). A numerical optimisation method can be used to select weights
 for each component that best describe changes in headline inflation. Specifically,
one can use a numerical algorithm to find weights that minimise the sum of
the squared differences between the published CPI inflation rate and the weighted
average of the eight expenditure category inflation rates, over some pre-determined
time period (t = 1,..,T):
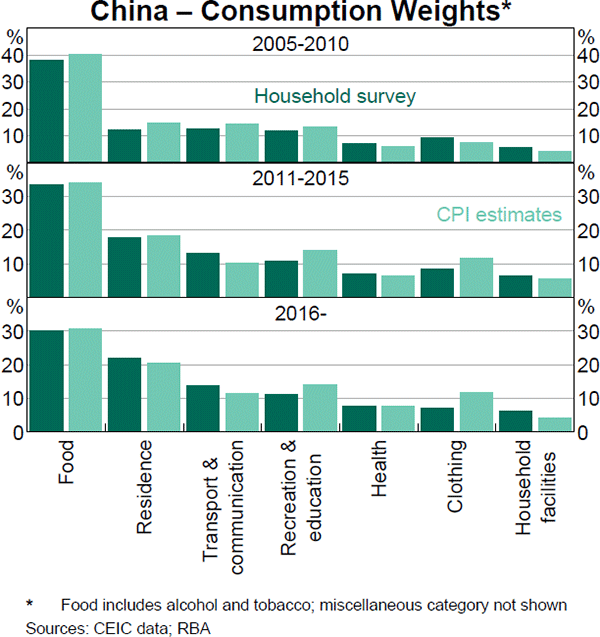
As major changes to the CPI basket and weights are made every five years, the weights are estimated separately for three periods (2005–10, 2011–15, and 2016 onwards). With only limited data available from 2016, estimates for this last period are based on the weights estimated for 2011–15, combined with the change in the weights provided by the NBS (NBS 2016).
One drawback of this approach is that the estimated expenditure weights are assumed to be fixed for each five-year period. However, the Chinese CPI is a Laspeyres-type price index which normally has effective weights that vary when there are relative price changes (OECD 2015). This means that the expenditure weights of components with above-average price rises increase over time, while the expenditure weights for components with below-average price rises decline over time. Nevertheless, the estimated weights are broadly in line with the expenditure shares estimated from the NBS's urban and rural household surveys (Graph 4).
The procedure can be repeated to estimate weights for subcomponents within each of the eight major expenditure categories. The weights of each of the 55 subcomponents can be calculated by multiplying their weight in the major component by the latter's weight in the overall CPI. For example, meat and poultry is estimated to account for 22 per cent of the food component and food is estimated to have a weight of 31 per cent of the CPI basket, so the estimated weight of meat and poultry in the overall CPI basket is 7 per cent.
Choice of frequency and use of seasonal adjustment
A trimmed mean can be constructed using monthly or year-ended inflation and, in the case of monthly inflation, either seasonally or non-seasonally adjusted data. Trimmed means based on seasonally adjusted monthly inflation rates are preferable for two reasons. First, a monthly inflation rate can be used to generate monthly and year-ended growth rates based on the same underlying index. Second, trimmed means based on monthly inflation rates result in smoother profiles than those based on year-ended rates (Brischetto and Richards 2006).
One drawback of using monthly inflation rates is that they can lead to estimates of the trimmed mean that are downwardly biased relative to a year-ended CPI inflation rate. This is partly because items displaying large seasonal increases once or twice a year tend to be trimmed from the monthly distribution of price changes in the periods when they record their largest increases. This results in lower average inflation over the year than headline CPI (Roberts 2005).[4] This downward bias can be partly mitigated by using seasonally adjusted monthly rates. Even using seasonally adjusted inflation rates, however, results in an underlying measure of year-ended inflation that is lower on average than headline inflation over the period examined. This is because the distribution of seasonally adjusted monthly price changes is positively skewed on average (i.e. there are more large increases than large decreases). This is a relatively common problem, and could occur because of infrequent and irregular price setting. The skew in the Chinese price change distribution can be seen in Graph 3, which highlights the fact that a small number of subcomponents typically have very high monthly inflation. The downward bias can be addressed using an asymmetric trim, whereby more weight is trimmed from the bottom half of the distribution than the top half (Kearns 1998).
Trim size selection
Another key parameter choice when constructing a measure of trimmed-mean inflation is the trim size. Previous research has generally found that the performance of a wide range of trims is similar.[5] To consider whether this is true for China as well, a range of symmetric and asymmetric trims (in 10 percentage point increments on each side of the distribution) are examined (Graph 5). We refer to a trimmed mean with ‘x’ per cent trimmed from the lower half of the distribution of weighted price changes and ‘y’ per cent trimmed from the upper half as the ‘(x, y) trimmed mean’. In some cases, the amount of the distribution that is trimmed is quite large; the weighted median ((50, 50) trim), which essentially trims away all of the distribution, is routinely constructed and analysed for other economies such as Australia and the United States. The various trimmed means are assessed based on the difference in average inflation relative to headline inflation, and their smoothness.
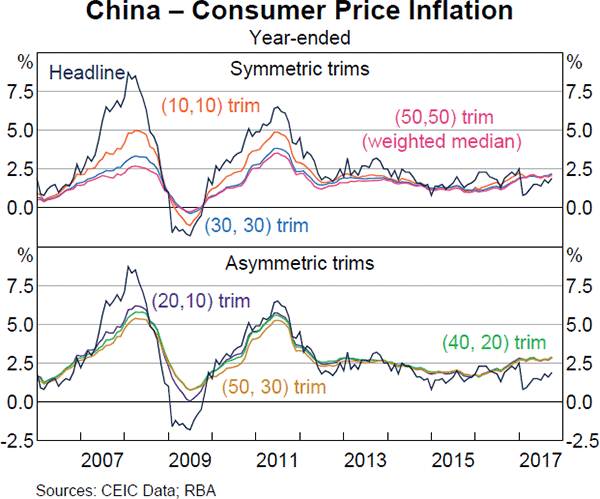
Reflecting the common problem of downward bias in trimmed means based on monthly inflation rates, all of the symmetric trimmed means have shown lower average inflation than headline inflation over the past decade (Table 1). The asymmetric trimmed means whose averages over this period are closest to headline inflation are the (20, 10) trim, (40, 20) trim and the (50, 30) trim. However, average rates of headline inflation have systematically shifted lower since around 2012, which implies that the assessment of the extent of ‘bias’ will depend to a large extent on the period being considered. In other words, different trims are likely to perform better in different periods.
| Top trim | |||||
|---|---|---|---|---|---|
| Bottom trim | 10 | 20 | 30 | 40 | 50 |
| 10 | 2.1 | – | – | – | – |
| 20 | 2.9 | 1.8 | – | – | – |
| 30 | 3.5 | 2.4 | 1.7 | – | – |
| 40 | 4.1 | 2.9 | 2.2 | 1.6 | – |
| 50 | 4.8 | 3.4 | 2.7 | 1.9 | 1.6 |
| Headline | 2.7 | ||||
| (2006–11) | 3.4 | ||||
| (2012–17) | 2.1 | ||||
| Exclusion-based | 1.2 | ||||
|
Sources: CEIC Data; RBA |
|||||
The smoothness of the trimmed mean measures can be measured by their standard deviation. However, minimising the standard deviation of the measures could result in a constant, so it is more useful to look at the standard deviation of the change in inflation (Brischetto and Richards 2006). On this metric, all of the trimmed mean measures of underlying inflation have been noticeably smoother than headline inflation (Table 2).
Given the similar smoothness of the various trims, and the difficulty assessing bias in a sample over which the average rate of headline inflation has shifted discretely, it may be appropriate to monitor a range of different underlying inflation measures, rather than focusing on just one. The choice of a symmetric or asymmetric trim appears to exert the largest influence on the estimated pattern of underlying inflation. Thus, one of each type is included in the discussion of inflation trends below – namely, the (40, 20) trim and the (10, 10) trim. Even though a large part of the distribution has been trimmed from the (40, 20) trim, it is a useful way of understanding the central tendency of the subcomponents of inflation.
| Inflation | Change in inflation | |||
|---|---|---|---|---|
| Monthly | Year-ended | Monthly | Year-ended | |
| Headline | 0.3 | 2.1 | 0.3 | 0.6 |
| (10, 10) trim | 0.2 | 1.3 | 0.2 | 0.3 |
| (20, 20) trim | 0.1 | 1.0 | 0.1 | 0.2 |
| (30, 30) trim | 0.1 | 0.9 | 0.1 | 0.2 |
| (40, 40) trim | 0.1 | 0.8 | 0.1 | 0.2 |
| (50, 50) trim (weighted median) | 0.1 | 0.8 | 0.1 | 0.2 |
| (20, 10) trim | 0.2 | 1.4 | 0.2 | 0.3 |
| (40, 20) trim | 0.1 | 1.2 | 0.1 | 0.3 |
| (50, 30) trim | 0.1 | 1.1 | 0.1 | 0.2 |
| Exclusion-based | 0.1 | 0.9 | 0.1 | 0.2 |
|
Sources: CEIC Data; RBA |
||||
Trends in Underlying Inflation
Over the past decade, the broad trends and directions of change have been similar in measures of underlying inflation and headline CPI in China (Graph 6). However, their levels have differed substantially at times. Trends in underlying inflation measures are best considered in three distinct periods: 2006 to 2012; 2013 to 2015; and 2016 to the present.
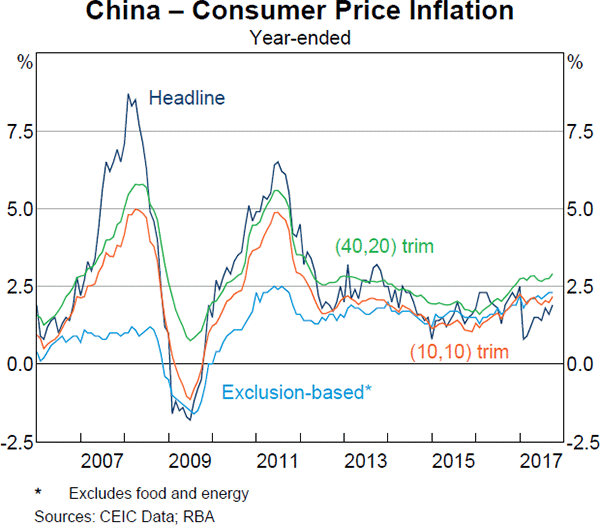
Between 2006 and 2012, the exclusion-based measure was generally lower than the trimmed means and the headline measure, due to persistently high food price inflation. Even though fresh fruit, vegetables, and fuel are among the most commonly trimmed items, the asymmetric trim has been selected in such a way as to generate a similar average rate of inflation to the headline measure.
Headline inflation was lower between 2012 and 2015 than it was in the earlier period, mainly due to subdued food price inflation. In contrast, inflation in the exclusion-based measure has been a little higher than it was before the global financial crisis. Trimmed mean inflation was low during this period, which is similar to many other economies' experiences with underlying inflation, and suggests that factors other than one-off changes to relative prices have been weighing on inflation. In China, for example, over the past few years, excess capacity in a range of manufacturing industries appears to have placed considerable downward pressure on upstream producer prices at times. This has probably placed downward pressure on underlying consumer price inflation, through components such as consumer durables. Another factor that may have added to downward pressure on consumer price inflation was the trend appreciation of the Chinese renminbi (on a trade-weighted basis) up until the first half of 2015, which would have reduced the price of imported goods and services.
Since the start of 2016, measures of underlying inflation have increased steadily, as have other indicators of price pressures in the Chinese economy, such as the implicit GDP deflator and the producer price index. This is consistent with the pick-up in GDP growth since 2016, following considerable fiscal and financial accommodation by the Chinese authorities. The depreciation of the Chinese renminbi over 2016 may also have led to additional inflationary pressure. However, despite the evidence of some increasing inflationary pressures in the Chinese economy, the various measures of headline and underlying inflation remain low relative to previous episodes.
Conclusion
Headline consumer price inflation can be useful for gauging cost of living pressures faced by Chinese consumers. However, because headline inflation can be volatile, it is also useful to monitor estimates of underlying inflation to look through large temporary movements in relative prices. While there is no single measure of underlying inflation, the Bank monitors a range of measures including newly constructed trimmed mean measures for China. Overall, these measures suggest that underlying inflationary pressures have increased gradually since early 2016, although these pressures remain low by historical standards.
Footnotes
The author is from Economic Group and would like to thank Arianna Cowling and June Ma for their assistance. [*]
For example, see Buckley (2011). [1]
Amstad, Huan and Ma (2014) and Shu and Tsang (2004) discuss alternative measures of underlying inflation in China. [2]
For details see Khan, Morel and Sabourin (2015), Meyer and Venkatu (2014) and Brischetto and Richards (2006). [3]
In the year-ended inflation data, these large monthly changes are smaller relative to the annual movements and can be offset by earlier changes in earlier months. [4]
Heath, Roberts and Bulman (2004) find that a wide range of trimmed inflation measures have predictive power for Australian headline inflation over specific sample periods. Brischetto and Richards (2006) find that there is a variety of trims which offer substantial improvements relative to both the headline CPI and exclusion-based measures. Similarly, Meyer and Venkatu (2014) found that a large range of trims have statistically indistinguishable forecasting ability for the United States. [5]
References
Amstad M, Y Huan and G Ma (2014), ‘Developing an Underlying Inflation Gauge for China’, BIS Working Papers 465.
Brischetto A and A Richards (2006), ‘The Performance of Trimmed Mean Measures of Underlying Inflation’, RBA Research Discussion Paper No 2006–10.
Buckley C (2011), ‘China's Premier Wen says price rises affecting social stability’, Reuters.com site, 27 February. Available at <http://www.reuters.com/article/china-economy-wen-idUSBGNPDE7B520110227>.
Heath A, I Roberts and T Bulman (2004), ‘Inflation in Australia: Measurement and Modelling’, in C Kent and S Guttman (eds), The Future of Inflation Targeting, Proceedings of a Conference, Reserve Bank of Australia, Sydney, pp 167–207.
Khan M, L Morel and P Sabourin (2015), ‘A Comprehensive Evaluation of Measures of Core Inflation for Canada’, Bank of Canada Discussion Paper No 2015–12.
Kearns J (1998), ‘The Distribution and Measurement of Inflation’, RBA Research Discussion Paper No 1998–10.
Meyer B and G Venkatu (2014), ‘Trimmed-Mean Inflation Statistics: Just Hit the One in the Middle’, Federal Reserve Bank of Cleveland Working Paper 12-17R.
NBS (National Bureau of Statistics) (2016), 国家 统计局城市司负责人就CPI基期轮换接受中国信息报专访 (China Information News Interview with Responsible Official from the Urban Department of the National Bureau of Statistics Regarding CPI Base Period Rotations), 19 February. Available at <http://www.stats.gov.cn/tjsj/sjjd/201602/t20160219_1320291.html>.
OECD (Organisation for Economic Co-operation and Development)(2015), ‘Methodological Notes: Compilation of G20 Consumer Price Index’.
Orlik T (2011), Understanding China's Economic Indicators, Pearson Education, Upper Saddle River, NJ.
RBA (Reserve Bank of Australia) (2016), ‘Box A: Recent Trends in Inflation in China’, Statement on Monetary Policy, February, pp 14–16.
Roberts I (2005), ‘Underlying Inflation: Concepts, Measurement and Performance’, RBA Research Discussion Paper No 2005–5.
Shu C and A Tsang (2004), ‘Alternative Measures of Core Inflation on the Mainland’, Hong Kong Monetary Authority Working Paper.
World Bank Group, World Health Organisation, Ministry of Finance, National Health and Family Planning Commission, Ministry of Human Resources and Social Security (2016), ‘Deepening Health Reform in China: Building High-Quality And Value-Based Service Delivery’, Policy Summary.
Zhang J and Zuo L (2010), ‘Wen pledges to curb inflation in China’, China Daily, 31 May. Available at <http://www.chinadaily.com.cn/china/2010-05/31/content_9913041.htm>.
