Bulletin – December 2015 Global Economy US Dollar Debt of Emerging Market Firms
- Download the article 308KB
Abstract
US dollar-denominated borrowings by emerging market (EM) corporations have increased rapidly in recent years, raising concerns about possible currency mismatch risk. This article uses firm-level data from the top 100 EM corporate bond issuers and Bank for International Settlements (BIS) data on cross-border bank lending at the economy level to gauge such risk. These data indicate that around two-thirds of the largest issuers of US dollar-denominated corporate bonds are at least in part naturally hedged (based on company-specific information), and a significant share of the remaining borrowers are state-owned enterprises. The largest recipients of foreign currency bank loans by country also appear to derive significant US dollar export revenues. This suggests that most EM corporations that have borrowed in US dollars are well placed to weather an appreciation of the US dollar, particularly given the possibility that some have hedged their exposures via financial markets. However, Chinese property developers may be an exception and some EM resource companies may face difficulties as a result of the current low global commodity prices. Corporations will also face higher financing costs on their US dollar-denominated debt as the US Federal Reserve moves to increase its policy rate.
Introduction
EM corporations' US dollar-denominated external debt has risen substantially over the past decade, from US$0.8 trillion at the end of 2004 to US$3.1 trillion in mid 2015 (Graph 1).[1] An increasing share of this US dollar-denominated debt has been in the form of bonds rather than foreign bank loans, with bonds now accounting for 40 per cent of the outstanding debt compared with 25 per cent a decade earlier. US dollar credit is also sometimes extended by local banks, although this typically comprises a small proportion of their total lending; due to data limitations, the remainder of this article abstracts from such lending.[2]
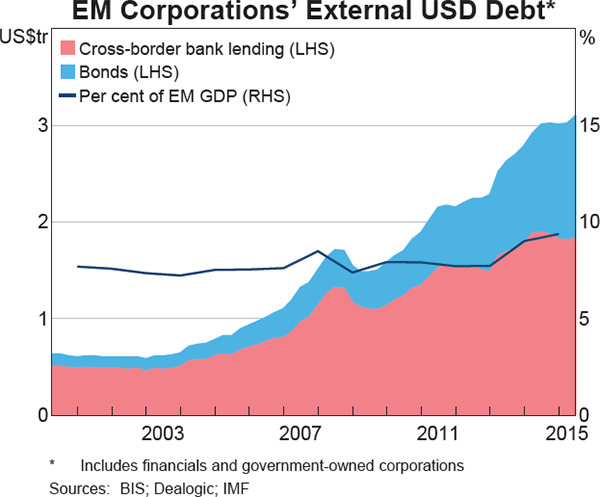
Much of the increase in US dollar debt of EM corporations can be explained by economic growth, with such debt as a share of GDP increasing only modestly over the past decade. It has also occurred alongside even stronger growth in local currency debt such that overall leverage has risen notably for many EM corporations since 2010. This increase in debt, both US dollar- and local currency-denominated, and the strong association of rising leverage and foreign currency risks with past financial crises, has prompted a large body of research into the drivers of such borrowings. According to the IMF (2015), the increase in total leverage cannot be adequately explained by firm- or country-specific factors, but instead largely reflects the increased influence of global factors such as low interest rates and market volatility. Similarly, Feyen et al (2015) find that EM firms are more likely to obtain US dollar-denominated funding when US capital markets are accommodative. Bruno and Shin (2015) also show that firms are more likely to borrow US dollars when their cash holdings are already high and the differential between local interest rates and those in the United States is wide, implying an important role for carry trade motivations associated with corporations investing their US dollar borrowings in local currency deposits or portfolio assets.
What is not clear from the literature is the extent to which US dollar borrowing gives rise to exchange rate risk in addition to general concerns about increased leverage. This is of particular interest given the recent appreciation of the US dollar and the expectation that the US policy rate will increase. If foreign currency borrowings are not hedged by foreign currency assets, revenue or derivatives, it would mean that leverage statistics understate the risks involved. Notwithstanding the importance of understanding corporate hedging practices, data on this topic are generally unavailable.
This article first describes recent developments in EM US dollar-denominated corporate bond issuance. It then looks more closely at foreign currency hedging by focusing on the top 100 EM issuers of US dollar corporate bonds (by total gross issuance) since the beginning of 2012. We use information in these companies' annual reports to provide a gauge of the extent to which US dollar exposures may be at least partly naturally matched with US dollar assets or revenues. (These reports do not generally provide adequate information to assess the extent of financial hedging that may further reduce the exchange rate exposure of these firms.) We also supplement this analysis with information on US dollar cross-border bank lending. However, since firm-level data on bank loans are unavailable, we instead compare the total amount of US dollar cross-border bank loans to each economy's total export revenue.
US Dollar-denominated Corporate Bonds
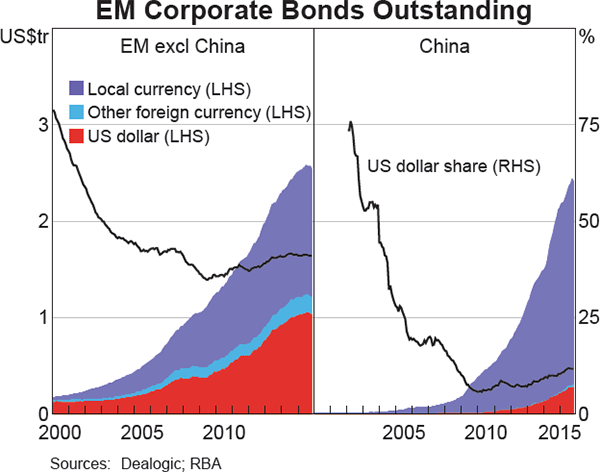
The stock of US dollar-denominated EM corporate bonds has more than tripled since early 2009 and currently stands at US$1.3 trillion, 2½ times the size of these economies' US dollar-denominated sovereign bonds. US dollar-denominated bonds comprise around one-quarter of all EM bonds outstanding and 90 per cent of EM corporations' foreign currency-denominated bond funding. The increase in US dollar-denominated corporate bond issuance has occurred alongside similarly strong growth in the local currency-denominated corporate bond market (particularly for Chinese corporations), such that the share of US dollar-denominated bonds in total EM corporate bonds outstanding has not changed significantly over the past decade (Graph 2).
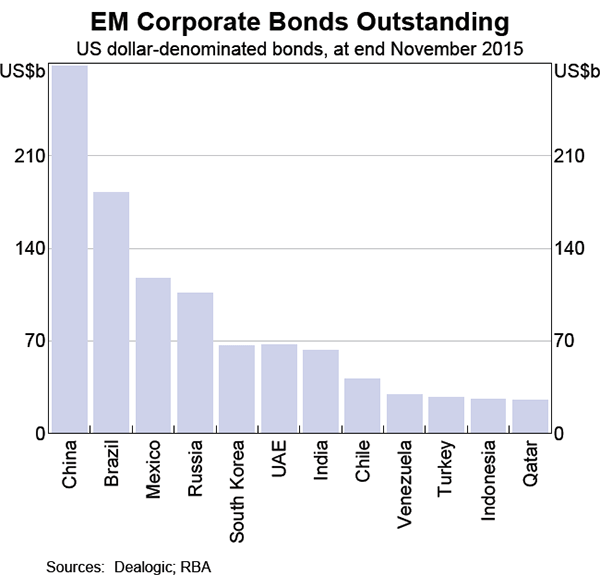
Chinese corporations have accounted for 30 per cent of the US dollar-denominated bonds issued by EMs since 2012, while companies from Brazil, Mexico and Russia make up a further 25 per cent of such issuance. Chinese firms now account for 20 per cent of all outstanding US dollar-denominated bonds (at US$275 billion), up from 8 per cent at the end of 2011 (Graph 3). More broadly, the top 12 EM nations represent over four-fifths of all EM US dollar-denominated bonds outstanding.
By industry, finance and resource (oil & gas and mining & metals) companies are by far the largest issuers, accounting for 60 per cent of all US dollar-denominated EM corporate bonds issued since 2012 (Table 1). Real estate & construction firms are the next largest borrowers, accounting for around 10 per cent of total EM issuance. However, such firms are geographically concentrated: around two-thirds of such issuance has been by Chinese firms, with companies in Brazil and Mexico accounting for much of the remainder. Beyond this, technology and utility companies are the next largest issuers of US dollar-denominated bonds.
| Finance | Oil & gas | Real estate & construction | Technology | Utility | Mining & metals | Transport | Food & beverage | Other | Total | |
|---|---|---|---|---|---|---|---|---|---|---|
| China | 67 | 47 | 68 | 23 | 16 | 13 | 9 | 6 | 16 | 265 |
| Brazil | 28 | 34 | 7 | 2 | 0 | 8 | 1 | 14 | 8 | 102 |
| Mexico | 2 | 29 | 12 | 7 | 4 | 5 | 0 | 7 | 7 | 73 |
| Russia | 33 | 17 | 0 | 1 | 0 | 13 | 3 | 0 | 2 | 69 |
| UAE | 28 | 5 | 5 | 1 | 2 | 0 | 6 | 0 | 2 | 50 |
| South Korea | 25 | 6 | 1 | 3 | 11 | 1 | 1 | 0 | 3 | 50 |
| India | 18 | 8 | 0 | 5 | 2 | 5 | 1 | 0 | 5 | 44 |
| Chile | 6 | 1 | 1 | 2 | 2 | 7 | 3 | 1 | 7 | 29 |
| Turkey | 21 | 1 | 0 | 1 | 0 | 0 | 1 | 1 | 2 | 27 |
| Indonesia | 2 | 7 | 2 | 1 | 4 | 0 | 3 | 0 | 1 | 20 |
| Colombia | 5 | 11 | 0 | 0 | 2 | 0 | 1 | 0 | 0 | 18 |
| Malaysia | 6 | 5 | 1 | 1 | 0 | 0 | 0 | 0 | 3 | 15 |
| Other | 56 | 35 | 5 | 17 | 18 | 6 | 8 | 4 | 15 | 161 |
| Total | 299 | 206 | 101 | 63 | 59 | 56 | 36 | 32 | 70 | 923 |
| Total excl China | 232 | 159 | 33 | 40 | 43 | 40 | 27 | 26 | 55 | 659 |
|
Sources: Dealogic; RBA |
||||||||||
Natural hedging among the top 100 issuers
The extent to which firms' US dollar exposures may be naturally matched with US dollar revenues can be gauged from their annual reports. To make the sample manageable, we examine the reports of only the top 100 issuers. These companies represent just over half of total US dollar-denominated EM corporate bond issuance since 2012 and are broadly representative of the overall US dollar EM corporate bond market at the economy level. However, at the industry level, this sample is disproportionately biased towards oil & gas companies, at the expense of real estate & construction, transport and miscellaneous industries (Table 2).
| Finance | Oil & gas | Real estate & construction | Technology | Utility | Mining & metals | Transport | Food & beverage | Other | |
|---|---|---|---|---|---|---|---|---|---|
| Full sample | 32 | 22 | 11 | 7 | 6 | 6 | 4 | 3 | 8 |
| Top 100 issuers | 31 | 38 | 8 | 7 | 7 | 5 | 0 | 2 | 2 |
|
Sources: Dealogic; RBA |
|||||||||
To assess whether such firms have US dollar revenues or assets, we use the information from their financial statements to determine the geographical nature of their business, the reporting currency used and/or the usual currency in which their products are traded. However, this classification is not always clear and we do not attempt to estimate the size of foreign currency assets or revenue (other than requiring them to be material). Some judgement is also involved; for example, firms may borrow in foreign currency to fund an overseas expansion that has not occurred yet (classified here as creating a natural hedge). Judgement is also required regarding debt issued by offshore affiliates (classified as belonging to the parent company)[3] and where related companies each issue debt (in which case it is consolidated in our analysis).
Over two-thirds of the top 100 issuers of US dollar-denominated bonds (by both number and value) appear to be able to at least partially hedge their foreign exchange risk by earning US dollar revenues (Graph 4). This share is likely to be a little lower across all EM issuers, due to the bias in the sample towards resource companies. Stratifying the results for the top 100 companies by industry composition of all issuers implies that 60 per cent earn US dollar revenues.
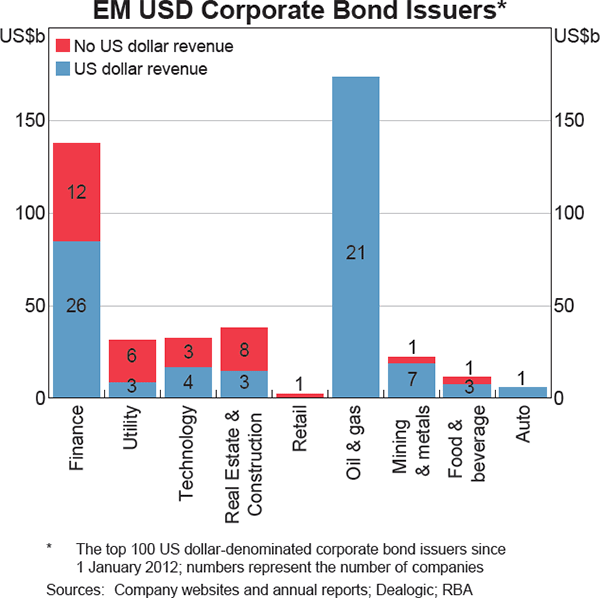
Almost all resource companies in our sample derive most of their revenue in US dollars. As a result, these companies' risk exposure has likely been lowered by their choice to denominate debt in US dollars since it ensures that the foreign currency shares of their revenues and costs are more closely matched. Nonetheless, the decision to increase borrowing – in any currency – still increases such companies' overall riskiness. This has been prominent in the current environment of lower oil and other commodity prices.
The share of large issuers that are naturally hedged is more mixed in other industries. About two-thirds of the finance companies that have issued such bonds are at least partly naturally hedged, with a number of banks having foreign subsidiaries (generating income in US dollars or euros) and indicating plans to expand their global operations. Over half of the technology companies that have issued a substantial value of bonds also appear to generate US dollar revenue, while four of the five manufacturers (food & beverage and auto companies) are naturally hedged to an extent.
Corporations that have issued large amounts of US dollar-denominated bonds and that do not appear to be naturally hedged include two-thirds of utility firms, three-quarters of real estate & construction firms and the remaining one-third of finance companies. While most of these companies with unhedged borrowings are geographically spread, the unhedged real estate & construction companies in the sample are all domiciled in China. Despite raising substantial funding in US dollars, these firms appear to derive no substantial US dollar revenue and their annual reports indicate that they generally do not engage in foreign currency hedging. These firms have also taken up significant amounts of local currency-denominated debt and exhibit relatively high leverage (Cooper and Cowling (2015)).
Foreign currency risk for firms without natural hedging
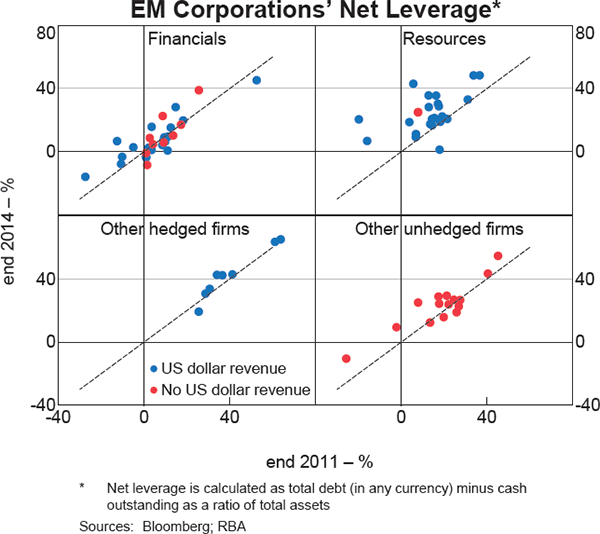
A sustained depreciation of a local currency would most significantly affect the firms with high leverage and little natural or financial hedging. In general, companies that do not appear to be naturally hedged have lower net leverage than those that are naturally hedged, and their overall net leverage has not risen substantially since end 2011 (Graph 5). Nonetheless, a number of firms have seen net leverage increase from a moderate level, suggesting they could find it more difficult than others to withstand the rising debt-servicing costs associated with a local currency depreciation. These firms are mostly utilities, although they include several Chinese real estate & construction companies and two banks. Net leverage appears to have risen the most for resource companies, albeit from (relatively) low levels, to be comparable to that for other firms at the end of 2014. The increase in resource sector net leverage has been most pronounced for Latin American (Mexican, Brazilian and Colombian) and Russian state-owned oil companies. Moreover, leverage ratios may not yet fully capture the impact of recent falls in commodity prices (which, if sustained, will reduce the book value of their assets).
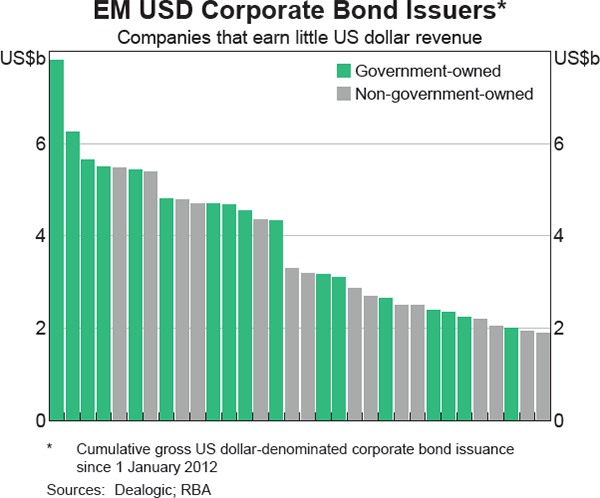
Some of this risk may be manageable if companies that have unhedged US dollar-denominated debt have access to their government's balance sheet in the event of difficulty. This would depend on the government's willingness and capacity to provide such support, including having sufficient US dollar reserves, although this capability can also be adversely affected by the same factors that impair corporate health – such as a local currency depreciation and falls in commodity prices. Among the largest borrowers, half of those that are not naturally hedged are government owned, including all the utilities firms that are the most highly leveraged (Graph 6). Such firms may be considered critical strategic assets and therefore could be supported by the sovereign in the event of difficulty. Some of the large financial corporations without natural hedging may also be likely to receive government support due to their systemic importance.[4]
Regardless of the extent of hedging, the cost of borrowing in US dollars is likely to rise as the US Federal Reserve moves towards increasing its policy rate, while falls in commodity prices are already affecting commodity producers' profitability.
The majority of EM corporate bonds issued are fixed-rate debt, and the US dollar cost of such bonds will only rise as they seek to roll over existing US dollar-denominated bonds. This risk is mitigated by these bonds having relatively long maturities, with less than 10 per cent of the outstanding bonds maturing over the next twelve months and just over one-third maturing over the next three years.
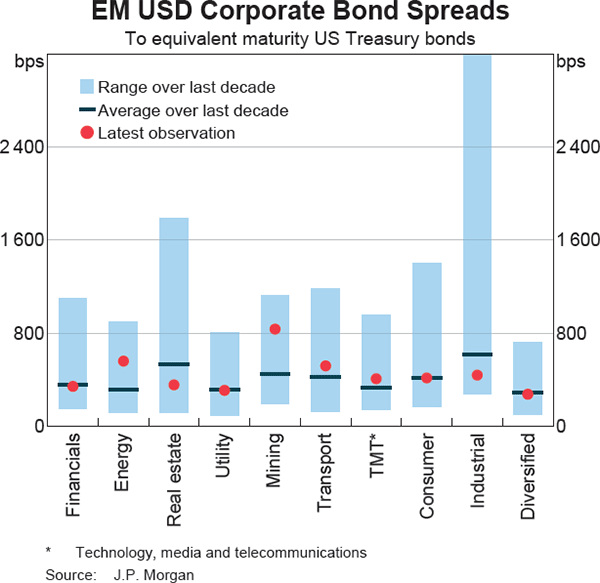
Overall, these results suggest that most EM firms that have issued US dollar-denominated bonds are at least in part naturally hedged or could receive some government support, and that the rollover risk appears to be manageable. Market pricing provides some cross-check on these results. In particular, if the extent of natural hedging was lower than estimated here we could expect to see this reflected in higher credit spreads on US dollar-denominated bonds issued by EM corporations as the US dollar has appreciated. In contrast, spreads on many US dollar-denominated corporate bonds remain around their decade averages, consistent with the pattern seen for US corporations' bond spreads, notwithstanding the significant depreciation of many EM currencies against the US dollar over the past year and a half (Graph 7). The exceptions are bonds issued by energy and mining companies, whose spreads are well above their long-term averages, reflecting the sharp falls in commodity prices in recent months rather than any increase in expected losses associated with the realisation of foreign currency risk.
US Dollar-denominated Foreign Bank Lending
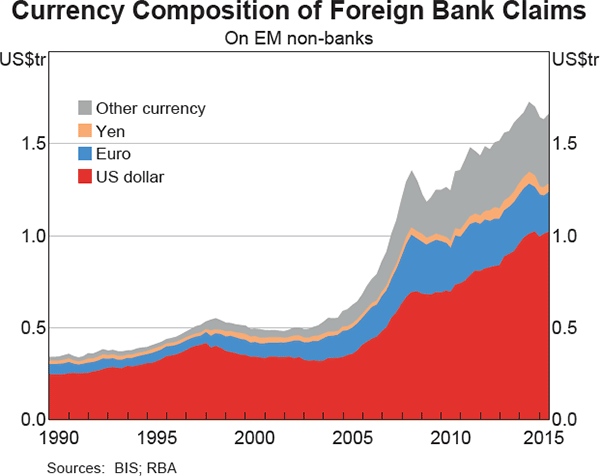
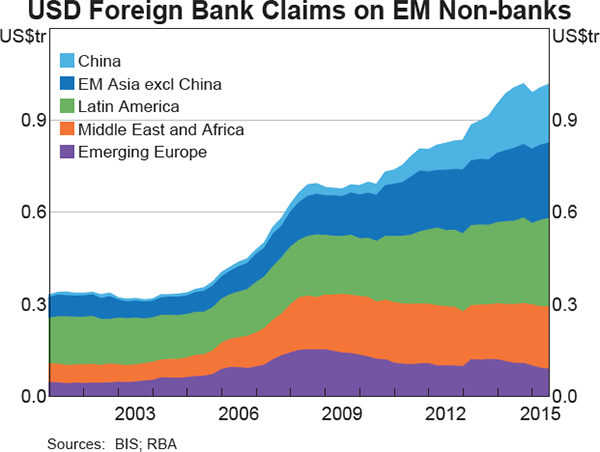
Despite the rapid increase in US dollar-denominated corporate bond issuance, non-financial corporations in EMs continue to source a large portion of their US dollar funding from banks.[5] US dollar-denominated foreign bank claims on all EM non-banks have grown by over US$300 billion since mid 2010, to around US$1 trillion (Graph 8).[6] Euro-denominated foreign bank claims are also substantial, at over US$200 billion at mid 2015, though they are concentrated in emerging Europe. These borrowers are less likely to face substantially higher debt servicing costs in the near term given the outlook for the European Central Bank's monetary policy and the depreciation of the euro since mid 2014.
The increase in US dollar-denominated foreign bank claims on EM non-banks since mid 2010 largely reflects a five-fold increase in claims on China, which remain modest (Graph 9).[7] US dollar claims on EM non-banks domiciled outside China have grown by around 5 per cent per year over the same period, as fairly rapid growth in lending to Asian and Latin American economies has been partly offset by falling US dollar-denominated lending to emerging Europe as part of a broader decline in high debt levels in these economies following the global financial crisis. US dollar claims on non-banks from the Middle East and Africa have been little changed.
Unlike corporate bonds data, data on foreign bank lending (from the BIS) are not available at the firm level. Given this, we can only gauge the extent of natural hedging of bank lending at the economy or regional levels. One (rough) proxy that can be used is primary export revenues (which are typically denominated in US dollars), though the distribution of cross-border borrowers could be different from that of an economy's exporters.
Although many EM regions have relatively high levels of US dollar-denominated bank exposures, they are generally matched by sizeable primary commodity export revenues that, in annual terms, amount to at least twice the level of their US dollar-denominated foreign bank debt (Table 3). This is particularly true for economies in the Middle East and Africa, which have relatively large US dollar foreign bank liabilities but much higher primary commodity exports (that comprise over one-quarter of these economies' GDP). The primary export revenues of these economies would also cover their outstanding corporate bonds.
| Total at mid 2015 | Change (past 5 years)(a) | Primary commodity exports(b) | Primary export coverage(b),(c) | |||
|---|---|---|---|---|---|---|
| US$b | % of GDP | US$b | Annual % | % of GDP | Ratio | |
| China | 192 | 2 | 156 | 40 | 1 | <1 |
| Emerging Asia excl China | 245 | 3 | 95 | 10 | 10 | 3 |
| Latin America | 289 | 6 | 91 | 8 | 10 | 2 |
| Middle East and Africa | 203 | 5 | 17 | 2 | 29 | 6 |
| Emerging Europe | 88 | 3 | −32 | −6 | 11 | 4 |
|
(a) From mid 2010 to mid 2015 Sources: BIS; IMF; RBA; United Nations Conference on Trade and Development |
||||||
While most regions' primary export coverage ratios (that is, the ratio of annual primary commodity export revenues to total US dollar-denominated bank claims) are reasonably high, there are some countries where coverage ratios are 2 or less, including China, Brazil, India and Turkey (Table 4). (Although Indonesia's coverage ratio is slightly higher, at 3, it has a relatively high share of US dollar- denominated local bank loans.) Some of these countries have large non-commodity export sectors that are likely to generate US dollar revenues, so total (as opposed to just primary) export coverage ratios may be the more relevant benchmark. For example, including the large service and manufacturing exports of India and Turkey results in these countries' coverage ratios rising substantially. However, Brazil has a relatively low coverage ratio even when considering total exports.
| Total at mid 2015 | Primary commodity exports(a) | Primary export coverage(a),(b) | Total exports(a) | Total export coverage(a),(b) | ||
|---|---|---|---|---|---|---|
| US$b | % of GDP | % of GDP | Ratio | % of GDP | Ratio | |
| China | 192 | 2 | 1 | <1 | 25 | 13 |
| Brazil | 115 | 5 | 6 | 1 | 9 | 2 |
| India | 66 | 3 | 6 | 2 | 17 | 5 |
| Turkey | 36 | 4 | 4 | <1 | 19 | 4 |
| Indonesia | 40 | 5 | 11 | 3 | 19 | 4 |
| Chile | 22 | 8 | 24 | 3 | 28 | 4 |
|
(a) 2014 figures (annual) Sources: BIS; IMF; RBA; United Nations Conference on Trade and Development |
||||||
China's total export coverage ratio is substantial, at 13, and its non-bank sector appears on aggregate to have more than sufficient US dollar revenues to service its US dollar-denominated bank loans, given that around three-fifths of China's exports are likely to be denominated in US dollars. Total claims on non-banks also remain very small compared with the size of China's economy, at 2 per cent of GDP.
While foreign currency risk on US dollar-denominated bank loans appears manageable in most EMs (based on their export coverage ratios), firms with US dollar loans are more likely to face higher debt servicing costs than bond issuers as the Federal Reserve moves to increase its policy rate. This in part reflects the fact that bank loans are more likely to be floating-rate debt. In addition, we estimate that around half of all US dollar bank loans will mature within the next year. However, this estimate is subject to fairly strong caveats since a maturity breakdown of international bank lending data is only available with inter-bank lending included (and does not provide a currency breakdown), and such lending is more likely to be short-term than lending to non-financial borrowers.
Conclusion
While the pick-up in the US dollar-denominated debt of EM firms in recent years has been rapid, natural hedging appears to mitigate a material portion of the risk posed to firms from a sharp depreciation of their local currencies against the US dollar. In particular, around two-thirds of the top 100 bond issuers are at least partially naturally hedged (though a significant proportion of these are exposed to lower commodity prices) and a number of the remainder are state-owned companies that may well receive some government support in the event of difficulty. In addition, many of the economies that have been the largest recipients of US dollar bank loans also derive significant US dollar export revenues. However, these results are based on partial data and hence are not definitive. Moreover, there are some areas where greater concern might be warranted. Most notably, construction companies in China have been significant borrowers of US dollars and appear to have little natural hedging and relatively high leverage. Some resource companies may also face difficulties following the recent fall in commodity prices, particularly Latin American energy firms that have relatively high leverage.
Regardless of the extent of natural hedging, EM corporations have been able to borrow in US dollars relatively cheaply over recent years and the cost of such borrowing is likely to increase as the Federal Reserve moves to increase its policy rate. This may be more of a concern for cross-border loans than bonds, which are more likely to be floating rate debt and may have a shorter maturity than bonds.
Footnotes
The authors are from International Department. The authors would like to thank Murphy Lai and Anngalee Toth for their assistance with much of the data collection. [*]
We consider all foreign currency-denominated bonds to be ‘external’, in line with the BIS practice of treating the currency of issue as an indicator of whether bonds are external or internal. We thus capture any foreign currency-denominated bonds issued domestically. The subset of EMs follows the grouping of emerging markets used in Chapter 3 of the International Monetary Fund's (IMF) recent Global Financial Stability Review. Of note, this includes South Korea, which the IMF normally classifies as a developed economy. [1]
The share of domestic credit that is in foreign currency (usually US dollars) is typically no more than 10 per cent, though it is higher in a number of eastern European countries and in Indonesia (see Figure 1.9 in IMF (2015)). [2]
Avdjiev, Chui and Shin (2014) find that nearly half of EM non-bank corporate debt was issued by offshore affiliates, which are increasingly acting as intermediaries in debt issuance for their parent companies. [3]
For example, the Central Bank of Russia provided large domestic banks with US dollar- and euro-denominated loans in late 2014 and 2015 (on top of foreign currency repurchase operations), secured against those banks' foreign currency loans to Russian exporters. [4]
We exclude an additional US$1 trillion in outstanding US dollar credit to banks in EMs from this section as the data contain cross-border lending to related offices. We thereby do not capture any on-lending of these funds to local non-banks. [5]
The share of US dollar-denominated claims in total foreign currency claims has risen by 6 percentage points over the same period, to 60 per cent, driven by increases in emerging Asia and Latin America. [6]
See Hatzvi, Meredith and Nixon (2015) for a more detailed discussion of banking-related flows to and from China. [7]
References
Avdjiev S, M Chui and HS Shin (2014), ‘Non-financial Corporations from Emerging Market Economies and Capital Flows’, BIS Quarterly Review, December, pp 67–76.
Bruno V and HS Shin (2015), ‘Global Dollar Credit and Carry Trade: A Firm-level Analysis’, BIS Working Papers No 510.
Cooper A and A Cowling (2015), ‘China's Property Sector’, RBA Bulletin, March, pp 45–54.
Feyen E, G Swati, K Kibuuka and S Farazi (2015), ‘The Impact of Global Liquidity on External Bond Issuance by Emerging Markets’, VOX, 11 August, accessed 23 November 2015. Available at <http://www.voxeu.org/article/external-bond-issuance-emerging-markets>.
Hatzvi E, J Meredith and W Nixon (2015), ‘Chinese Capital Flows and Capital Account Liberalisation’, RBA Bulletin, December, pp 39–48.
IMF (International Monetary Fund) (2015), Global Financial Stability Report – Vulnerabilities, Legacies, and Policy Challenges: Risks Rotating to Emerging Markets, October, World Economic and Financial Surveys, IMF, Washington DC.