Bulletin – September 2012 The Pricing of Crude Oil
- Download the article 282KB
Abstract
Arguably no commodity is more important for the modern economy than oil. This is true in terms of both production and financial market activity. Yet its pricing is relatively complex. In part this reflects the fact that there are actually more than 300 types of crude oil, the characteristics of which can vary quite markedly. This article describes some of the key features of the oil market and then discusses the pricing of oil, highlighting the important role of the futures market. It also notes some related issues for the oil market.
Introduction
The crude oil market is significantly larger than that for any other commodity, both in terms of physical production and financial market activity (Table 1). The value of crude oil production is more than twice that of coal and natural gas, 10 times that of iron ore and almost 20 times that of copper. Crude oil is the most widely used source of fuel, supplying around one-third of the world's energy needs. It is also used to produce a variety of other products including plastics, synthetic fibres and bitumen. Accordingly, changes in the price of crude oil have far-reaching effects.
| Physical market(a) | Financial market (exchange-traded) | ||||
|---|---|---|---|---|---|
| Annual production |
Annual exports |
Annual turnover |
Open interest (b) |
||
| Oil | 3,250 | 2,211 | 40,194 | 288 | |
| Natural gas | 1,578 | 530 | 3,160 | 38 | |
| Coal | 1,203 | 187 | 40 | 3 | |
| Iron ore | 318 | 164 | 8(d) | 1(d) | |
| Rice(c) | 285 | 22 | 58 | 1 | |
| Corn(c) | 245 | 27 | 2,865 | 48 | |
| Wheat(c) | 200 | 43 | 1,257 | 27 | |
| Copper | 173 | 51(e) | 13,726 | 93 | |
| Gold | 139 | 156(e) | 9,362 | 85 | |
| Soybeans(c) | 119 | 45 | 6,540 | 70 | |
| Sugar(c) | 93 | 32 | 3,614 | 28 | |
|
(a) RBA estimates based on volumes and indicative world prices Sources: ABARES; Bloomberg; BP (2012); Bureau of Resource and Energy Economics; Commodity Futures Trading Commission; International Copper Study Group; RBA; United Nations Comtrade; United States Department of Agriculture |
|||||
The pricing mechanism underlying crude oil is, however, not as straightforward as it might appear. Almost all crude oil sold internationally is traded in the ‘over-the-counter’ (OTC) market, where the transaction details are not readily observable. Instead, private sector firms known as price reporting agencies (PRAs) play a central role in establishing and reporting the price of oil – the two most significant PRAs being Platts and Argus Media.
Characteristics of Crude Oil
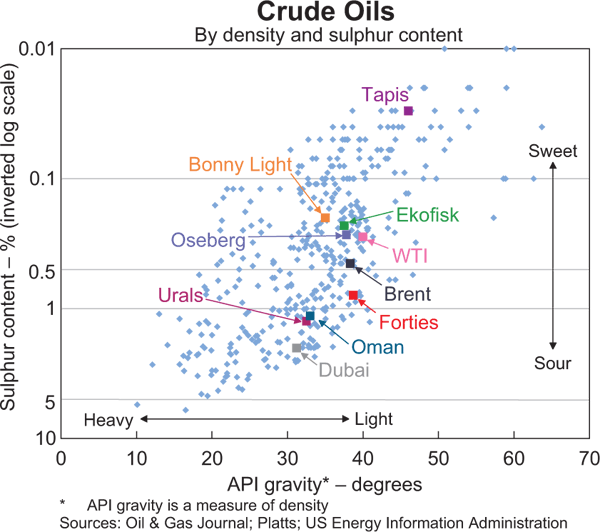
Crude oil varies in colour from nearly colourless to tar black, and in viscosity from close to that of water to almost solid. In fact, there are more than 300 different types of crude oil produced around the world, all of which have different characteristics (Graph 1). Two of the most important characteristics are density (or viscosity) and sulphur content.[1] High-quality crude oils are characterised by low density (light) and low sulphur content (sweet) and are typically more expensive than their heavy and sour counterparts.[2] This reflects the fact that light crude oils produce more higher-value products (such as gasoline, jet fuel and diesel) than medium or heavy density crudes, while sweet crude oils require less processing than sour crudes (since sulphur is a harmful pollutant that needs to be removed to meet air quality standards).
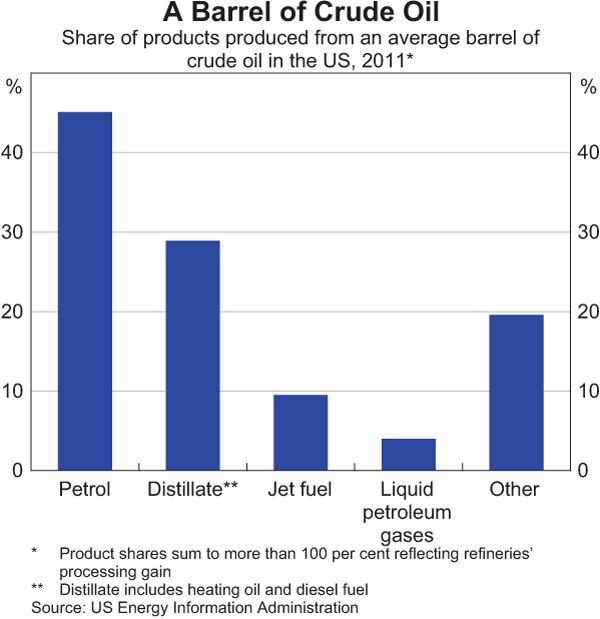
When a barrel of crude oil is refined, around 40–50 per cent is used to produce petrol (gasoline), with the remainder better suited to producing products such as diesel, heating oils and jet fuel (kerosene), heavy bitumen, as well as the petrochemicals used to produce dyes, synthetic detergents and plastics (Graph 2). The precise proportions depend on the quality of the particular crude oil (as well as the specification of the refinery), with differences in the prices of the various grades of crude oil influenced by differences in demand for the various end products as well as by the supply of the different grades of crude oil.
Although publicly traded international oil companies are commonly viewed as the dominant players in the oil market, state-owned national oil companies actually account for a much larger share of reserves and production (Table 2). The two largest oil-producing companies in the world are Saudi Aramco and the National Iranian Oil Company, who account for around 12 per cent and 5 per cent of global oil production, respectively. In total, national oil companies control around 60 per cent of oil production and more than 80 per cent of the world's proven oil reserves. The five largest publicly traded oil-producing companies (the ‘super-majors’) – Exxon Mobil, BP, Chevron, Royal Dutch Shell and Total – each account for around 2–3 per cent of global oil production and collectively just 3 per cent of reserves.
| Rank | Company | Nationality | State-owned | Production | Reserves |
|---|---|---|---|---|---|
| 2010 | End 2011 | ||||
| Per cent of total | |||||
| 1 | Saudi Aramco | Saudi Arabia | Yes | 12.1 | 17.4 |
| 2 | NIOC | Iran | Yes | 5.2 | 9.9 |
| 3 | PdV(a) | Venezuela | Yes | 3.6 | 13.9 |
| 4 | Pemex | Mexico | Yes | 3.5 | 0.7 |
| 5 | CNPC | China | Yes | 3.4 | 1.7 |
| 6 | KPC | Kuwait | Yes | 3.1 | 6.7 |
| 7 | Exxon Mobil | United States | No | 2.9 | 0.8 |
| 8 | INOC | Iraq | Yes | 2.9 | 9.4 |
| 9 | BP | United Kingdom | No | 2.9 | 0.7 |
| 10 | Rosneft | Russia | 75% | 2.8 | 1.2 |
|
(a) Excludes Venezuela's oil sands; if they are included, PdV's reserves exceed those of Saudi Aramco Sources: BP (2012); Oil & Gas Journal; Petroleum Intelligence Weekly (2011) |
|||||
The Market for Oil
Crude oil is largely traded in the OTC market where it is not directly observable. The prevalence of OTC trading in both the physical and financial oil markets is well s uited to the heterogeneous nature of crude oil, which often requires specifically tailored contracts. Around 90 per cent of physical crude oil is traded under medium- and long-term contracts. Crude oil for physical delivery can also be traded in the ‘spot market’, although this is less common owing to the logistics of transporting oil.
These ‘spot’ transactions in oil are perhaps more accurately described as near-term forward transactions, as most ‘spot’ deliveries take place more than 10 days after entering into the contract, with some deliveries reportedly taking up to 60 days. This is generally much longer than for other commodities; for example, the US Henry Hub natural gas spot price specifies next-day delivery, while the spot price for metals on the London Metal Exchange (LME) specifies delivery within two days. Typically, a ‘spot’ transaction in the oil market is a one-off deal for physical oil that is not covered by long-term contracts because the buyer has underestimated its requirements and the producer has surplus crude beyond what it is committed to sell on a term basis. Accordingly, these transactions represent the price of the marginal barrel of oil in terms of supply and demand.
While physical crude oil can be purchased from organised exchanges by entering into a futures contract, only around 1 per cent of these contracts are in fact settled in terms of the physical commodity. Futures contracts are standardised contracts traded on organised exchanges, specifying a set quantity (usually 1,000 barrels) of a set type of crude oil for future delivery. The two key oil futures contracts are the New York Mercantile Exchange (NYMEX) WTI light sweet crude and the Intercontinental Exchange (ICE) Brent contracts.
Trading in the financial market for crude oil typically includes hedging activities by consumers and producers, as well as speculation and arbitrage by financial institutions. While information on the amount of activity in the futures market is readily available (because it occurs on organised exchanges), much less is known about trading in oil on the OTC financial market due to the lack of transparency in these markets. Swaps and options are reportedly the most commonly traded OTC financial contract.[3] Forward contracts for oil are another commonly traded OTC instrument, with each contract specifying a price and a future delivery date. These contracts are typically more flexible than futures contracts, reflecting the fact that they are generally not standardised and are traded off-exchange.
Turnover and open interest in the exchange-traded market for crude oil (along with other commodities) has increased markedly over the past decade, reflecting the introduction of electronic trading platforms and the increasing number of non-traditional participants in commodity futures markets. Exchange-traded turnover in crude oil remains noticeably higher than for any other commodity, reflecting the importance of crude oil in the global economy, with crude oil production easily outstripping that of other commodities (Table 1). However, as a share of annual production, exchange-traded turnover of crude oil is actually less than it is for some other commodities, such as copper and gold and some agricultural products like soybeans and sugar.[4]
Oil Benchmark Prices
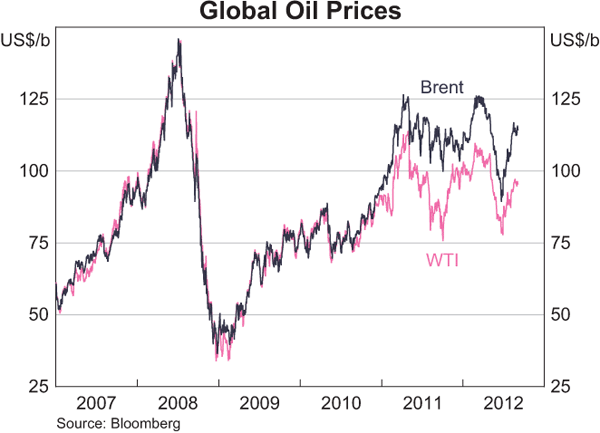
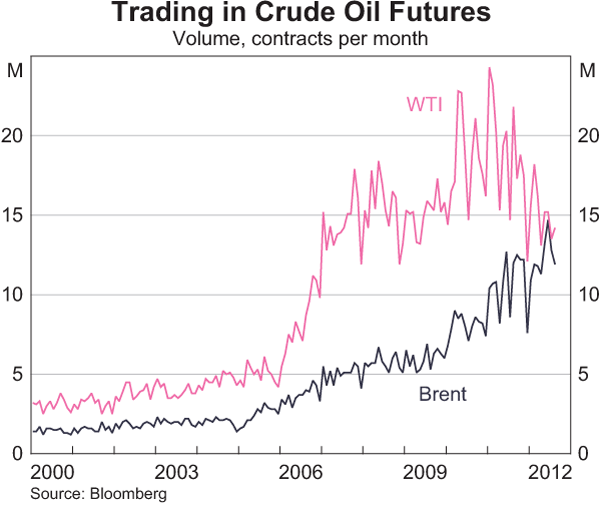
With so many different grades of oil, there is actually no specific individual market price for most crude oils. Instead, prices are determined with reference to a few benchmark oil prices, notably Brent and West Texas Intermediate (WTI) (Graph 3).[5] Brent is produced in the North Sea and is used as a reference price for roughly two-thirds of the global physical trade in oil, although it only accounts for around 1 per cent of world crude oil production (Table 3). WTI is produced in the United States and has traditionally dominated the futures market, accounting for around two-thirds of futures trading activity. However, futures market trading in Brent has increased significantly in recent years to be now close to that for WTI, reinforcing Brent's role as the key global benchmark (Graph 4). As discussed below, Brent's dominance as a benchmark has benefited from the fact that it is a seaborne crude and, unlike WTI (which is a landlocked pipeline crude), can readily be shipped around the world.
| Brent(a) | 1 |
|---|---|
| WTI | 1 |
| Europe (excl Brent) | 20 |
| United States (excl WTI) | 16 |
| Middle East | 33 |
| Asia | 10 |
| Rest of world | 19 |
|
(a) Includes Brent, Forties, Oseberg and Ekofisk (BFOE) Sources: BP (2012); Purvin & Gertz Inc.; RBA; Statistics Norway; UK Department of Energy and Climate Change; US Energy Information Administration |
|
These benchmarks form the basis for the pricing of most contracts used to trade oil in the physical (and financial futures) markets. For oil transactions undertaken in the spot market, or negotiated via term contracts between buyers and sellers, contracts specify the pricing mechanism that will be used to calculate the price of the shipment. So-called ‘formula’ pricing is the most common mechanism, and it anchors the price of a contracted cargo to a benchmark price, with various price differentials then added or subtracted.
These price differentials relate to factors such as the difference in quality between the contracted and benchmark crude oils, transportation costs and the difference in the refinery's return from refining the contracted and benchmark crudes into the various petroleum products. For example, a barrel of Brent is generally worth more than a barrel of Dubai (a medium sour crude oil) because Brent will yield more high-value gasoline, diesel and jet fuel than Dubai without the need for intensive refining. However, the actual magnitude of the Brent-Dubai spread will depend on the relative prices of these petroleum products at the time when the oil is sold to the refineries, along with the location and the spare capacity in those refineries that can easily convert lower-quality crude oil into higher-yielding petroleum products. Reflecting changes in these fundamental determinants, the Brent-Dubai spread has fluctuated within a range of around US$0–15 per barrel.
These benchmark prices used in formula pricing are usually based on either (i) ‘spot’ prices determined by PRAs (for example, a ‘spot’ price published by Platts called Dated Brent); or (ii) prices determined in futures markets (for example, the assessed WTI price published by the PRAs). Oil companies often reference more than one benchmark price depending on the final destination; for example, Saudi Aramco typically employs the Brent benchmark to price oil exports to Europe, Dubai-Oman for exports to Asia and the Argus Sour Crude Index for exports to the United States.
These particular crudes emerged as benchmarks due to several distinctive characteristics. Brent developed as a benchmark owing to favourable tax regulations for oil producers in the United Kingdom, in addition to the benefits of stable legal and political institutions (Fattouh 2011). Ownership of Brent crude oil is well diversified, with more than 15 different companies producing it, which helps to reduce individual producers' pricing power.[6] Brent can also be used by a variety of buyers, given that it is a light sweet crude oil that requires relatively little processing.
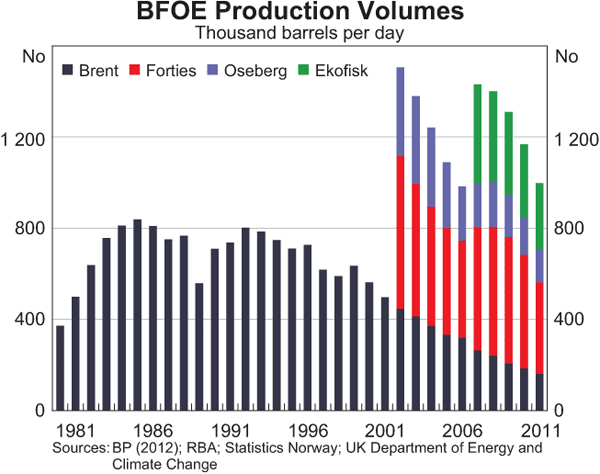
The physical infrastructure underlying Brent is also well developed. When the Brent benchmark was established in the mid 1980s, its production was initially reasonably large and stable, which is an important characteristic of a benchmark as it guarantees timely and reliable delivery. Although the volume of Brent crude oil produced has declined over time, three other North Sea crudes have been added to the Brent benchmark basket over the past decade, such that it now comprises Brent, Forties, Oseberg and Ekofisk (BFOE; Graph 5). The combination of these four alternatively deliverable grades has allowed the Brent benchmark to retain a reasonable volume of production. And while there are concerns about the adequacy of production volumes in the future, the depth and liquidity of the Brent futures market has nevertheless increased noticeably in recent years.
If alternative crude oils cannot be delivered against a benchmark, declining production volumes can weaken the status of that crude oil as a benchmark. This is because it becomes a less accurate barometer of current supply and demand as it becomes traded less frequently, and lower traded volumes enable individual market participants to influence the price more easily. Malaysian Tapis – which was previously a key benchmark for the Asia-Pacific region – is a case in point. Tapis's benchmark status has faded away in recent years owing to declining production volumes; recently, only a single cargo of Tapis has typically been available for export each month, down from around 8 cargoes per month in previous years.[7] This compares with around 45 cargoes per month currently for the Brent benchmark. Declining production volumes, coupled with the absence of any alternative similar crude oils produced in the region, have seen refiners and producers shift to benchmark against other prices, predominantly Brent.
The emergence of WTI as a benchmark was also assisted by the presence of secure legal and regulatory regimes in the United States. WTI was established as a benchmark in 1983 and its status increased in prominence as the depth and liquidity of its futures contract expanded. Like Brent, WTI is a light sweet crude that is available from a broad range of producers. Similarly, several different types of crude can be delivered against the WTI contract, including sweet crudes from Oklahoma, New Mexico and Texas, as well as several foreign crude oils. WTI crudes are delivered via an extensive pipeline system (as well as by rail) to Cushing, Oklahoma.[8] Recently, however, the system has struggled to cope with the increasing volumes of crude oil flowing through Cushing. This has resulted in persistent inventory bottlenecks, owing to Cushing's limited storage capacity and its landlocked location. These bottlenecks have weighed on the WTI price in recent years, to the point where it is now significantly influenced by local supply and demand conditions, in addition to those for the world as a whole (as indicated by the divergence between WTI and Brent oil prices shown in Graph 3). This has weakened WTI's status as a global benchmark.
Pricing the Benchmark Crudes: Brent and WTI
The methods employed by the price reporting agencies to assess Brent and WTI prices are quite different, reflecting the different physical and financial frameworks around them.
Brent
The mechanism for determining the Brent price is quite complex and involves a number of different prices including Dated Brent, ICE Brent futures and Brent forwards prices.
Dated Brent is regarded as the ‘spot’ price for Brent, and appears to be the most commonly used reference price for the physical sale and purchase of oil. It represents the price of a cargo of Brent crude oil that has been assigned a date, between 10–25 days ahead, for when it will be loaded onto a tanker.[9] However, very few physical Dated Brent trades are actually priced on an outright basis and in any event are not directly observable. In these circumstances, the Dated Brent price is assessed by a PRA using information from both the physical and financial markets. For physical trades, which are not observed by an exchange, the PRAs rely on traders voluntarily submitting trade information to them.
A typical assessment process for Dated Brent starts in the forward market, as shown in Figure 1.
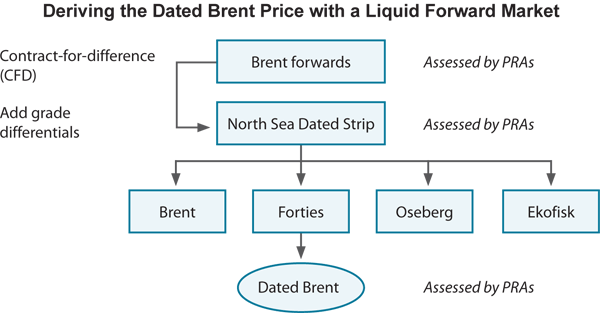
Brent forwards (or 25-day BFOE) are a physically deliverable OTC forward contract specifying a delivery month (but not a precise date) at which the cargo will be loaded.[10] The ‘25-day’ name reflects that buyers are notified of the loading dates for their cargoes 25 days ahead of delivery (Platts 2012). The PRAs typically assess three Brent forward prices covering a period up to three months ahead.[11]
The PRAs then assess the contract-for-difference (CFD) prices. CFDs are a relatively short-term swap between the ‘floating’ (or uncertain) price of Dated Brent at the time of loading and a fixed price at a future date (the Brent forward price). They are used to hedge against, or speculate on, movements in the Brent market. As such, CFDs provide the link between the Brent forward price and the Dated Brent price, albeit at some time in the future. By taking assessments of weekly CFD values for the next eight weeks and combining them with the second month Brent forward price, the PRAs can construct a set of implied future Dated Brent prices up to eight weeks ahead – that is, a forward Dated Brent curve. Using this curve, the implied Dated Brent prices for the period 10 to 25 days ahead can be calculated – the average of which is known as the North Sea Dated Strip. Combining this with the grade differentials for each of the four crudes in the Brent basket gives an outright price for each of Brent, Forties, Oseberg and Ekofisk. The cheapest of which then becomes the final published daily quote for Dated Brent. This is typically Forties as it is the lowest quality of the four crudes in the Brent basket.
Occasionally, however, there is insufficient liquidity in the Brent forward market to use this as the starting point. In that case, the assessment instead starts in the futures market. As shown in Figure 2, a synthetic Brent forward price is derived by combining the ICE Brent futures prices with ‘exchange of futures for physicals’ (EFPs) values.
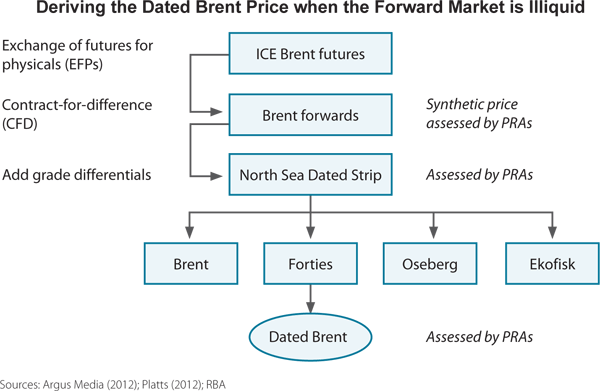
The ICE Brent futures contract specifies the delivery of 1,000 barrels of Brent crude oil at some determined future date. The contract is settled in cash, with an option for delivery via an EFP contract. Whereas futures contracts are highly standardised and traded on exchanges, EFPs are a more flexible contract that allow traders to convert a futures position into physical delivery, enabling traders to choose delivery location, grade type and trading partner. EFPs take place off-exchange, at a price agreed to by both parties.
Once a price for Brent forwards has been derived, the Dated Brent price can then be determined as previously.
While Dated Brent has traditionally been the most commonly used price in physical contracts, an increasing number of producers – including Saudi Arabia, Kuwait and Iran – have begun to adopt Brent futures prices as their preferred benchmark.[12]
West Texas Intermediate
There is only one main instrument that underlies the WTI benchmark price: the NYMEX Light Sweet Oil futures contract.[13] This reflects the large and very liquid futures market for WTI, which since its inception in 1983 has almost entirely replaced its forward market. The WTI futures contract allows for physical delivery when left open at expiry, specifying 1,000 barrels of WTI to be delivered to Cushing, Oklahoma – although it also allows for the delivery of several other domestic and foreign light sweet crudes against the futures contract. However, only a very small proportion of WTI futures contracts are actually physically settled, mostly via EFPs.
Reflecting the absence of a significant forward market, the PRAs' assessed physical ‘spot’ price for WTI is determined differently to that for Dated Brent. The ‘spot’ price for WTI reported by the PRAs is typically the most recent and representative NYMEX WTI front-month (contract nearest to expiry) futures price in a period immediately prior to the price assessment time (which varies between the PRAs).[14] At contract expiry, the PRAs' reported price reflects the new front-month futures price plus the ‘cash roll’ (the cost of rolling a NYMEX futures contract forward into the next month without delivering on it).
The Price Reporting Agencies
The PRAs clearly play a key role in identifying the price of the benchmark crudes, as outlined above. Although the different PRAs' price assessments are typically very close to each other, they employ slightly different methods in determining the daily quoted benchmark prices for Dated Brent and WTI. On occasion, the differences in the assessed prices for the various benchmarks can be more noticeable, particularly for less liquid crudes such as Tapis (where the difference across PRAs can be up to US$5 per barrel).
While the PRAs publish general information on their methodologies, the far-reaching impact of the PRAs' quoted prices suggest that more precise information would help to increase confidence in the soundness of the oil market. For example, it may be useful to know how the PRAs applied their discretion to exclude various bids and offers, how often this is done and why, and how they have used their judgement to determine reported prices in the absence of any actual deals. Reflecting such concerns, at the direction of the G-20, a review of PRAs by the International Organization of Securities Commissions (IOSCO) and other relevant international organisations is currently in progress.[15]
Price Discovery in the Oil Market
Given that oil prices are essentially jointly determined in both the physical and financial markets, it is no easy task to disentangle the effect of each market in the price discovery process with any precision. Nevertheless, futures markets appear to play an important role in the pricing of oil, perhaps more so than for other commodities. Indeed, there is a view that crude oil price levels are essentially determined in the futures market.[16]
This is clearest for WTI where PRAs identify the ‘physical’ price directly from the deep and liquid futures market, and where there is no significant parallel OTC market. It is less obvious, however, for Brent. While Brent forward prices are typically used by the PRAs to derive the Dated Brent price, as noted above Brent forward and futures markets are directly linked via EFPs. Many large oil market players reportedly hold Brent forwards and futures in their portfolios, arbitraging between the two instruments, such that the prices of Brent futures and forwards typically converge.
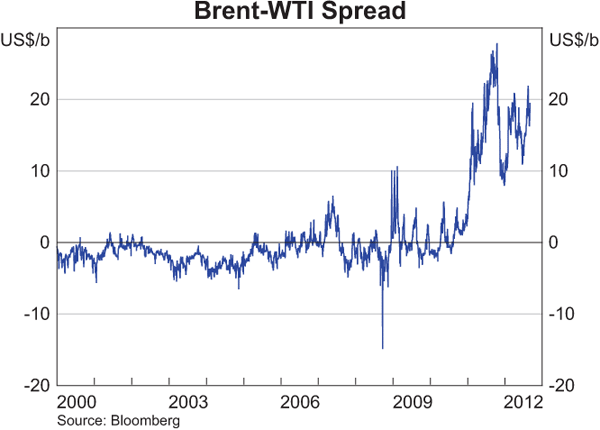
The complexity of the oil pricing arrangements makes it difficult to demonstrate convincingly that benchmark oil prices fully reflect physical supply and demand conditions rather than the actions of uninformed financial speculators. Nevertheless, movements over time in the price differentials for the various benchmark crudes are broadly consistent with changes in demand and supply. The Brent-WTI spread provides a good example of the influence of such factors on oil price differentials (Graph 6). Prior to 2011, Brent and WTI prices generally moved in tandem, with the spread largely reflecting the costs of transporting Brent-referenced crude oils to the United States. In recent years, however, increased volumes of crude oil from North Dakota and Canada have flowed into Cushing, leading to a build-up in inventories. Most pipelines flow from the rest of North America into Cushing, making it difficult to move the extra crude oil out of Cushing. This has led to persistent inventory bottlenecks, which have weighed heavily on the price of WTI over the past 18 months, leading the Brent-WTI spread to widen to US$10–30 per barrel.[17] The recent widening of the Brent-WTI spread is also likely to reflect concerns about declining production volumes in the North Sea.
More transparent information about oil reserves, daily production volumes and demand-driven factors could assist more efficient pricing in the oil market. Information about the demand for oil is often not known until well after the period for which it is reported. On the supply side, there is ongoing concern regarding the accuracy of various countries' reported production volumes, while oil reserve estimates are subjective and depend on partial information and project feasibility. There have been steps towards greater transparency in the oil market; for example, the Joint Organisations Data Initiative (JODI) was established in 2001 to provide accurate and timely crude oil data on production, consumption, trade, refining and inventories. Nonetheless, there is still scope to increase country coverage and data quality.
Conclusion
The current pricing framework for crude oil is complicated, as is the nature of price discovery. Global crude oil trade is currently priced according to the prices of a handful of benchmark crudes, which make up less than 5 per cent of total crude oil produced. Yet these benchmark crude oils are facing problems of their own. The prolonged divergence of the WTI price from other major benchmark prices has impaired its benchmark status, leading some oil-consuming and oil-producing companies to shift to other benchmarks. On the other hand, production volumes for the Brent basket are declining, leading to concerns regarding its own robustness as a benchmark. Regulators and the industry are working together, under the auspices of the G-20, to ensure that prices for crude oil are determined in a transparent manner and continue to reflect physical fundamentals.
Footnotes
The authors are from International Department. [*]
Other important characteristics include the amount of salt water, sediment and metal impurities. [1]
The use of the terms ‘sweet and sour’ stems from the early days of the oil industry when prospectors would judge a crude oil's sulphur content according to its taste and smell. [2]
See Campbell, Orskaug and Williams (2006) for more details. [3]
Some of the difference in the ratio of futures turnover to physical production may reflect different average futures contract maturities across commodities. [4]
Dubai-Oman is another commonly used benchmark, typically employed to price crude oil exports from the Middle East to Asia. Tapis was also an important Asian benchmark but, as discussed later in the text, there has been an increasing shift towards Brent in Asia in recent years. The Argus Sour Crude Index (ASCI) is another benchmark that has become increasingly important. It is typically used for pricing crude oil exports to the United States and is derived from the prices of three sour crude oils produced in the United States. [5]
Brent crude oil is actually a mixture of crude oil produced from around 20 different fields in the North Sea and collected through a main pipeline system to the terminal at Sullom Voe in the Shetland Islands, Scotland. In 1990, the Brent pipeline system was commingled with the Ninian pipeline system (also located in the North Sea). For this reason, it is sometimes referred to as Brent Blend. [6]
See Platts (2011) for more details. [7]
With a population of less than 8,000, Cushing is a major oil storage and transport hub that holds around 5–10 per cent of the US oil inventory. [8]
A loading date is usually a period of three days during which crude oil is loaded onto tankers as specified by the operator of the oil terminal (where the oil is stored prior to delivery to refiners) or offshore loading facility. [9]
Being a seaborne crude, the forward contract for Brent involves trading in large volumes of oil (a standard Brent shipment is 600,000 barrels), which is beyond the capability of most small traders; as a result, very few traders participate in this market, with between 4 and 12 traders participating each day. In contrast, WTI is a pipeline crude with much smaller trading lots and a correspondingly greater number of participants in the physical market (around 30 to 35 different buyers and sellers). [10]
The Brent forward contract can be physically settled or, more commonly, cash-settled, where traders offset their positions in a ‘daisy chain’, which is created when a circle of at least three traders is formed: A sells to B, who sells to C, who sells to A. The circle is closed by financial settlement of price differences rather than physical delivery. [11]
One example of this is BWAVE, which is a weighted average of ICE Brent prices in a trading day, weighted by volume. This price is typically used for certain exports of Middle Eastern crude oils to Europe. [12]
This is the main WTI contract. ICE also offers a cash-settled WTI futures contract, although open interest in this contract is much smaller than for the NYMEX contract. [13]
To derive the physical WTI price, the PRAs combine the assessed futures price with the assessed EFP differential. That said, Platts' physical WTI price has been the same as its assessment of the WTI futures price for the past few years, reflecting an EFP differential equal to zero over the same period. [14]
See G-20 (2010, 2011) for more details. [15]
See, for example, Mabro (2008) and Fattouh (2011). [16]
In contrast, the Brent-Louisiana Light Sweet (LLS) spread has continued to move closely around zero. LLS is produced in the United States and is similar quality to WTI; however, LLS is a waterborne crude and is therefore not subject to the same inventory bottlenecks as WTI. [17]
References
Argus Media (2012), ‘Argus Crude’, Methodology and Specifications Guide, July.
BP (2012), BP Statistical Review of World Energy June 2012, BP plc, London.
Campbell P, B Orskaug and R Williams (2006), ‘The Forward Market for Oil’, Bank of England Quarterly Bulletin, March, pp 66–74.
Fattouh B (2011), ‘An Anatomy of the Crude Oil Pricing System’, The Oxford Institute for Energy Studies Working Paper No 40.
G-20 (2010), ‘The Seoul Summit Document’, November.
G-20 (2011), ‘The Cannes Summit Final Declaration’, November. Available
at
<http://www.g20.org/images/stories/docs/eng/cannes.pdf>.
Mabro R (2008), ‘The Oil Price Conundrum’, Oxford Energy Forum, August, pp 12–14.
Petroleum Intelligence Weekly (2011), ‘PIW Ranks the World's Top 50 Oil Companies’, L(49), Special Supplement, pp 1–3.
Platts (2011), ‘Dated Brent: The Pricing Benchmark for Asia-Pacific Sweet Crude Oil’, May.
Platts (2012), ‘Crude Oil’, Methodology and Specifications Guide, July.