Bulletin – September 2011 Cash Use in Australia: New Survey Evidence
- Download the article 171KB
Abstract
The Reserve Bank has completed its second study of consumers' use of payment instruments. The study indicates that cash remains the most common form of payment by consumers. It is used extensively in situations where average payment values are low and where quick transaction times are preferred. Nonetheless, cash use as a share of total payments has declined, falling as a share of both the number and value of payments. Two important factors contributing to this decline are the substitution of cards for cash use, particularly for low-value payments, and the increasing adoption of online payments.
Introduction
Information on the use of cash in the Australian economy has traditionally been difficult to obtain. This is because, unlike most other forms of payment, cash transactions do not need to pass through the banking system where information on payments can be captured. Given this, the Reserve Bank has used surveys of consumers' use of payment instruments to better understand the use of cash. This article reports information obtained from a recent survey, conducted in late 2010.[1] It finds that, while cash remains the most common form of consumer payment and the dominant form for low-value transactions, its use has declined over recent years, as use of payment cards and online payments has increased. The study results also indicate that cash is used more extensively in merchant locations that process high volumes of low-value payments, and that both younger and older age groups tend to make a higher proportion of payments with cash than those in age groups between 30 and 50 years.
The Consumer Payments Use Study
The Bank first undertook a study of consumers' payment patterns in 2007 as part of its 2007/08 Review of the Payments System Reforms, and repeated the study in late 2010 as part of its Strategic Review of Innovation in the Payments System.[2] Both the 2007 and 2010 studies used a similar methodology, based on the Roy Morgan Research Financial Transaction Diary® (the diary). For the 2010 study, individuals were asked to record in the diary details of every purchase, bill payment and cash withdrawal made over a one-week period, including information on the type of payment (e.g. cash, credit card, BPAY), the channel (e.g. in person or internet) and the type of merchant to which the payment was made. In total, 1,240 valid responses were received, resulting in a sample of almost 19,500 payments with a total value of around $1.3 million.
The 2010 study also contained a questionnaire, which was completed at the end of the diary period and designed to provide further insight into consumers' payment behaviour and their preferences regarding different types of payments.
Broad Patterns in Cash Use
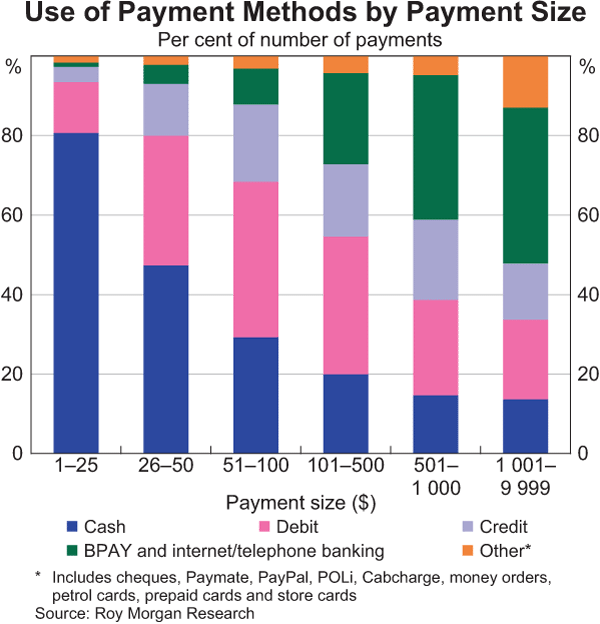
Consistent with the 2007 study, cash is the most frequently used payment method by consumers, accounting for 62 per cent of payments. Cash is particularly dominant for low-value payments by individuals, making up around 80 per cent of transactions of $25 and under, and 47 per cent of transactions between $25 and $50 (Graph 1). But as payment values rise, consumers increasingly use other methods, so that cash accounts for a relatively small share of payments above $100. Payment cards (credit and debit) account for the majority of payments between $50 and $500, while BPAY and internet/telephone banking play an increasing role for payments above $500.
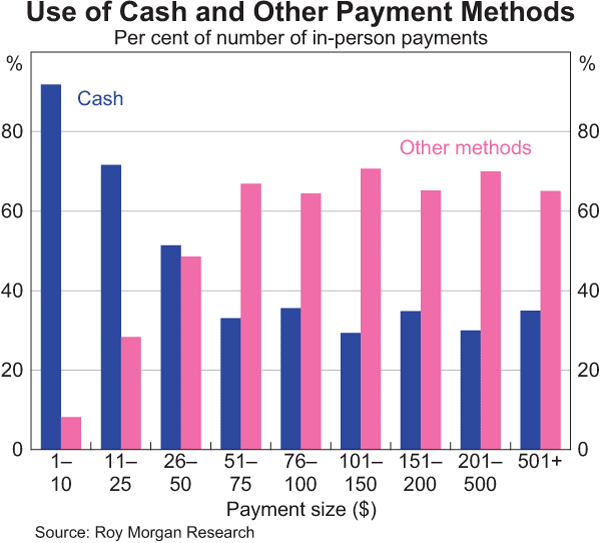
Cash makes up a larger share of payments that are made in person, accounting for 68 per cent overall and the majority of in-person payments up to a value of around $50 (Graph 2). Understandably, there is a wide range of approaches taken by individuals in their use of cash. During the week of the study, around 17 per cent of respondents made all of their in-person payments using cash, while 5 per cent made no cash payments at all.
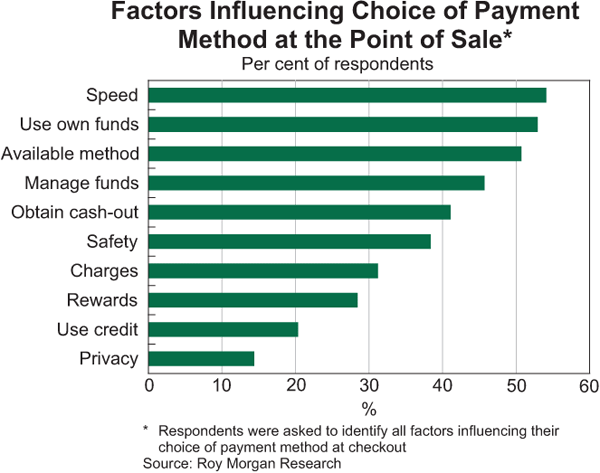
The pattern of cash use is a reflection of the characteristics of cash, which make it appealing for low-value payments in particular. One key characteristic of cash is that it is almost universally accepted for small payments. In contrast, some businesses either do not have card acceptance facilities or limit card payments to transactions above a given value. Cash payments are typically also quicker to conduct than the alternatives. The average time to make a cash payment at the point of sale has been estimated to be around 20 seconds, compared with 35 seconds for eftpos, 45 seconds for credit cards (using signature) and 90 seconds for cheques.[3] These rankings do not change when other related costs, such as the time to make ATM withdrawals, pay credit card bills or reconcile statements are taken into account. Responses to the end-of-study questionnaire highlight the fact that transaction speed is an important factor in determining the payment method used by consumers at the point of sale (Graph 3).
Reflecting the use of cash for small payments, the median value of a cash payment is quite low, at around $12, compared with $38 for debit card payments, $49 for credit cards and $132 for internet/telephone banking (Table 1). This means that despite accounting for the majority of consumer payments, cash makes up only around one-quarter of the value of all consumer payments; card payments account for a little over a third of the value of payments.
| Payment method | $ |
|---|---|
| Internet/telephone banking | 132 |
| BPAY | 100 |
| Personal cheque | 90 |
| American Express/Diners Club card | 50 |
| MasterCard/Visa credit card | 49 |
| eftpos | 38 |
| MasterCard/Visa debit card | 38 |
| Paymate, PayPal and POLi | 27 |
| Other(a) | 16 |
| Cash | 12 |
|
(a) Includes Cabcharge payments, money orders, petrol cards, prepaid cards and store cards Source: Roy Morgan Research |
|
While cash is clearly a critical element of Australia's payments landscape, its share of total payments has been declining. Existing data on the value of cash withdrawals (which can be used as a proxy for the value of cash payments) suggest that cash use relative to other payment methods has been declining for some time.[4] Data from the 2007 and 2010 consumer payments studies confirm this. Although the average number of cash payments per person increased slightly between study periods, this increase was less than for other payment methods (Table 2). As a result, the share of cash use in the total number of payments also decreased, from 70 per cent in 2007 to 64 per cent in 2010.[5] As a share of payments made in person, the decrease was from 74 per cent to 68 per cent.
| 2007 | 2010 | ||||
|---|---|---|---|---|---|
| Average(a) Per person per week |
Share Per cent |
Average(a) Per person per week |
Share Per cent |
||
| Cash | 9.3 | 70 | 9.5 | 64 | |
| Card | 3.5 | 27 | 4.7 | 32 | |
| BPAY | 0.3 | 2 | 0.5 | 3 | |
| Personal cheque | 0.2 | 1 | 0.1 | 1 | |
| Total | 13.3 | 100 | 14.8 | 100 | |
|
(a) The average number of payments may be affected by survey fatigue, whereby fewer payments are recorded towards the end of the diary period, although this effect is likely to be small Source: Roy Morgan Research |
|||||
The decline in cash use appears to have occurred across all but the highest payment values and appears to reflect a shift towards card (particularly debit card) payments; the share of payments below $50 made on cards increased from 19 per cent in 2007 to 24 per cent in 2010. In part, the decline in cash use may also have been driven by increased use of the internet to make payments, where cash is not an option; internet payments as a share of credit card payments increased from 7 per cent to 9 per cent over the three years between studies.
The findings of the Reserve Bank's study are broadly in line with payment patterns observed in other international studies, although there is considerable variation in overall cash use across countries. For example, in 2008 the Deutsche Bundesbank found cash to be the dominant payment method for lower-value payments in Germany, and responsible for around 83 per cent of all payments.[6] The Norges Bank was able to compare the results from surveys conducted in 1993 and 2007, showing that cash as a share of payments at the point of sale declined dramatically in Norway over this period, from 84 per cent to 24 per cent.[7]
Merchant and Demographic Characteristics of Cash Use
Examining the use of cash within individual merchant categories indicates how cash is used and why its use has declined somewhat relative to other payment methods.
As discussed, cash is the dominant instrument for: payments made in person; where average payment values are low; and where quick tender times are preferred. This is clearly reflected in payment patterns in hotels/bars and small food and take-away stores, where at least 85 per cent of payments are made by cash (Table 3). In many such businesses, transaction speed is critical and the cost of card acceptance may exceed the benefits; therefore, card acceptance may be limited. By contrast, cash is only used for around 20 per cent of payments for household bills and holiday travel, where payment values tend to be larger and many payments are made remotely.
| Merchant category | Share of cash payments in 2010 Per cent | Change from 2007 Percentage points |
|---|---|---|
| Take-away food | 87 | −7 |
| Hotel/bar | 87 | −4 |
| Small food store | 85 | −4 |
| Restaurant/café | 84 | 7 |
| Transport | 80 | −3 |
| Leisure | 79 | −8 |
| Other(a) | 72 | 1 |
| Services(b) | 59 | −3 |
| Other retailer(c) | 58 | −6 |
| Supermarket/liquor | 54 | −7 |
| Health | 45 | −10 |
| Petrol | 44 | −3 |
| Holiday travel | 22 | −3 |
| Household bills | 20 | −17 |
| All categories | 64 | −6 |
|
(a) Any payments (including charitable donations) that do not fit into
the other categories Source: Roy Morgan Research |
||
A declining share of payments made by cash is evident across nearly all merchant categories. By far the sharpest declines between 2007 and 2010 occurred in household bills (−17 percentage points) and health (−10 percentage points). The former appears to reflect a shift towards online payment of bills using scheme cards or BPAY. The end-of-study questionnaire indicated that around 60 per cent of consumers with internet access now pay most of their bills online. Reduced cash use for health payments may be driven by a number of factors, including the greater availability of in-person electronic claims from Medicare and health funds and an increase in the average size of payments – up from $56 in 2007 to $71 in 2010. Cash use also fell strongly in the leisure category (−8 percentage points), which includes sports, entertainment, cinemas and zoos; in part, this reflects an increase in the proportion of payments made online, up from 2 per cent in 2007 to 6 per cent in 2010. On the other hand, use of cash has increased over the past three years in restaurants/cafés, possibly reflecting increased incidence of surcharging of credit cards.
Despite the apparently widespread fall in cash use, the majority of payments continue to be made by cash in all but four merchant categories.
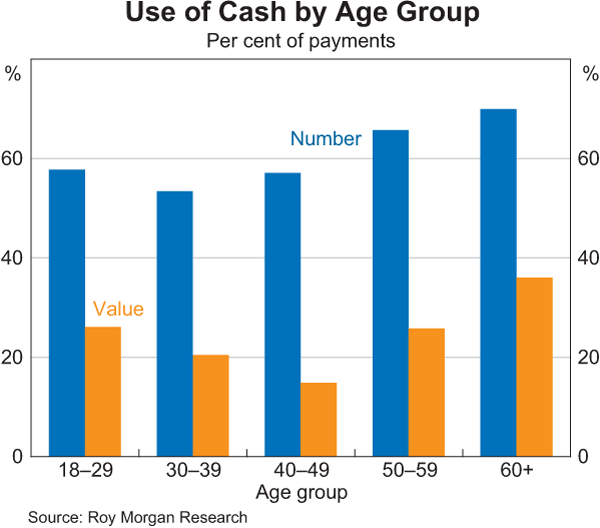
Age appears to be an important determinant of consumers' payment patterns. Although all age groups make extensive use of cash, individuals in both younger and older age groups make a greater proportion of payments with cash than those in the age groups between 30 and 50 years (Graph 4).[8] This reflects a number of influences. Individuals may develop payment habits based on the payment methods that were prominent during their early adult years, with older consumers having formed their habits before the widespread availability of payment cards. Less access to, and familiarity with, the internet might also result in people in older age groups making more use of in-person cash payments than other age groups. In addition, individuals in both the younger and older age groups tend to have lower-than-average incomes; accordingly, they are likely to be more restricted in their payment options, particularly in their access to credit cards, and also make fewer high-value payments, which are dominated by non-cash methods.
Cash Holdings and Withdrawals
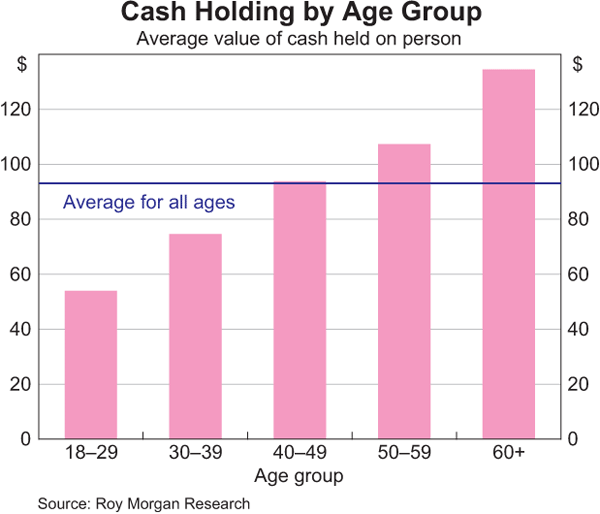
In addition to payment patterns, the 2010 study gathered information on both cash holdings by individuals and their withdrawal patterns. The study results suggest that, on average, consumers carry $93 in cash on their person, with the amount increasing with age (Graph 5).[9] In a typical month, consumers make around 5½ cash withdrawals, with ATMs the main source, averaging around 3½ withdrawals per month (Table 4). Most of the remaining withdrawals are eftpos cash-outs (1½ per month). Over-the-counter withdrawals are relatively infrequent, but the average value of each withdrawal is relatively high, at around $1,400, compared with nearly $200 for an ATM withdrawal and around $80 for an eftpos cash-out.[10] The average withdrawal for all methods is a little over $230, which funds around nine average-sized cash payments.[11]
| Number Per person per month | Value ($) Per person per month | Average withdrawal size ($) |
||||||
|---|---|---|---|---|---|---|---|---|
| 2007 | 2010 | 2007 | 2010 | 2007 | 2010 | |||
| ATM | 4.0 | 3.7 | 743 | 722 | 182 | 197 | ||
| eftpos cash-out | 1.2 | 1.5 | 99 | 119 | 83 | 78 | ||
| Over-the-counter(b) | 0.6 | 0.3 | 238 | 448 | 386 | 1,395 | ||
| Total(c) | 5.8 | 5.5 | 1,080 | 1,289 | 181 | 234 | ||
|
(a) Average withdrawals may be affected by survey fatigue, whereby fewer
withdrawals are recorded towards the end of the diary period, although
the effect is likely to be small Source: Roy Morgan Research |
||||||||
Overall, the number of cash withdrawals made by consumers decreased by 6 per cent between 2007 and 2010, while the average amount withdrawn on each occasion rose from around $180 to around $230. These patterns are likely to have been influenced by the move to direct charging at ATMs in March 2009, which has seen consumers reduce the number of ATM withdrawals they make, increase use of eftpos cash-outs and increase average withdrawal sizes.[12]
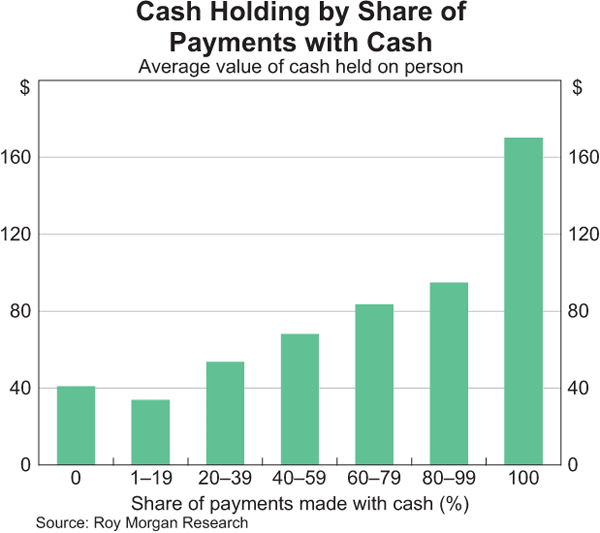
The level of consumers' cash holdings tends to be related to both the frequency of their cash withdrawals and their choice of payment instrument. Those with larger holdings tend to make smaller numbers of withdrawals and those withdrawals are correspondingly larger. This suggests a preference to hold larger cash amounts in order to minimise withdrawals. On the other hand, many respondents held very little cash, with around 13 per cent having $5 or less on their person and around 20 per cent having $10 or less.[13] While some of these respondents were making frequent withdrawals to maintain a low cash holding, many were making few withdrawals because they were also making few cash payments. As a result, respondents holding small amounts of cash were more likely to be low cash users (Graph 6).
Future Trends
New payment technologies that reproduce some of the features of cash have the potential to continue and possibly accelerate the decline of cash payments. Contactless card payments, in particular, seem to offer some of the key characteristics that people like in cash. These require the consumer only to hold their card in close proximity to the terminal, or to touch the card against it, and do not require a PIN or signature for the transaction. While the availability of contactless cards and terminals has accelerated recently, at the time of the 2010 study contactless payments were still not widely used.
As noted above, around half of respondents indicated in the end-of-study questionnaire that the speed of processing – a prominent feature of contactless payments – was an important factor in their choice of payment method at the point of sale. However, there are also some important characteristics of cash that are not necessarily possessed by contactless cards. Around 15 per cent of respondents indicated that privacy influenced their choice of payment method at the point of sale. These respondents tended to be relatively high users of cash and may be less likely to adopt contactless payments.
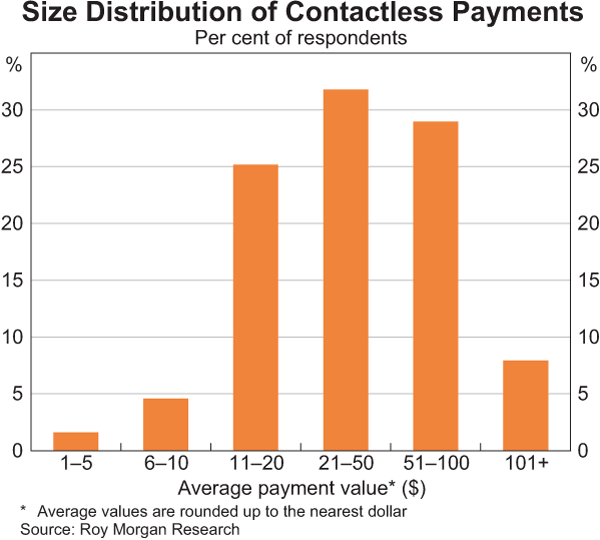
At this stage it is not clear that contactless payments are primarily being substituted for cash. Although contactless functionality is largely targeted at cash replacement, payment values recorded for contactless payments in the study were high relative to the median cash transaction, suggesting that they may primarily be replacing more standard debit and credit card transactions at the point of sale (Graph 7).
Conclusion
The Reserve Bank's updated Consumer Payments Use Study confirms that cash remains the dominant payment method for low-value payments at the point of sale. It is used extensively in situations where average payment values are low and where quick transaction times are preferred, such as at hotels/bars and small food and take-away stores. Usage tends to be higher for older and younger consumers than those in the age groups between 30 and 50 years. Nonetheless, cash use as a share of total payments has declined, falling as a share of both the number and value of payments by consumers between the 2007 and 2010 studies. This has occurred across most merchant types and payment values and appears in many cases to reflect payment cards replacing cash use, particularly for low-value payments. This substitution may increase further over time as the use of contactless payments becomes more widespread, given the importance placed by individuals on processing speed at the point of sale. It is also clear that for particular payment types (e.g. bills), online payments are increasingly replacing in-person payments and therefore reducing cash use.
Footnotes
The authors are from Payments Policy Department. [*]
For a full description of the results of the 2010 survey, including the use of non-cash payment methods, see Bagnall, Chong and Smith (2011). [1]
Results from the first study are reported in Emery, West and Massey (2008). For information on the Strategic Review, see RBA (2011). [2]
These estimates are from time and motion studies conducted by Australian merchants with high turnover. See Schwartz et al (2008). [3]
See, for example, the discussion of trends in retail payments in RBA (2010), pp 7–11. [4]
For comparisons between the 2007 and 2010 studies, we exclude payment methods not included in both studies, as well as payment methods classified in the ‘other’ category. This is aimed at achieving a like-for-like comparison, whereby we are comparing the same payment methods in both 2007 and 2010. Internet banking/telephone payments and payments processed by specialist online providers (e.g. PayPal) are excluded because they were only captured in 2010, while the ‘other’ category is excluded because of differences between the types of transactions recorded in that category in 2007 and 2010. [5]
For more information on payments behaviour in Germany, see Deutsche Bundesbank (2009). [6]
See Gresvik and Haare (2008). [7]
Survey respondents were aged 18 years and over, with a weighted average age in the 40–44 age group. Survey responses were weighted according to gender, age group, geographical location (metropolitan or regional) and credit card holding. [8]
Those respondents aged under 30 held $54 in cash, on average, compared with $134 for those aged 60 years and over. [9]
The average over-the-counter withdrawal size is heavily influenced by a small number of high-value transactions in the 2010 survey. In general, the survey data suggest somewhat higher transaction sizes than the Reserve Bank's monthly Retail Payment Statistics (RPS) collection. Based on the RPS data, the average size of an ATM withdrawal was $178 in late 2010, compared with $197 based on the survey, while the average sizes of eftpos cash-outs were $57 and $78, respectively. Some difference in the results is to be expected; whereas the surveys capture transactions by individuals aged 18 and over (excluding business-related transactions), the RPS data collection aggregates all transactions. [10]
The average size of a cash payment is $27. A median cash withdrawal of $100 would fund around eight median-sized transactions of $12. [11]
See Flood, Hancock and Smith (2011) for more discussion on the impact of the ATM reforms. [12]
The questionnaire asked respondents for the amount of cash in their wallet or purse rounded to the nearest $5, although many respondents gave amounts to the nearest dollar. [13]
References
Bagnall J, S Chong and K Smith (2011), ‘Strategic Review of Innovation in the Payments System: Results of the Reserve Bank of Australia's 2010 Consumer Payments Use Study’, June.
Deutsche Bundesbank (2009), ‘Payment Behaviour in Germany: An Empirical Study of the Selection and Utilisation of Payment Instruments in the Federal Republic of Germany’, June. Available at <http://www.bundesbank.de/download/bargeld/pdf/bargeld_studie.en.pdf>.
Emery D, T West and D Massey (2008), ‘Household Payment Patterns in Australia’, in Payments System Review Conference, Proceedings of a Conference, Reserve Bank of Australia and Centre for Business and Public Policy at the Melbourne Business School, Sydney, pp 139–176.
Flood D, J Hancock and K Smith (2011), ‘The ATM Reforms – New Evidence from Survey and Market Data’, RBA Bulletin, March, pp 43–49.
Gresvik O and H Haare (2008), ‘Payment Habits at Point of Sale’, Norges Bank Staff Memo No 6. Available at <http://www.norges-bank.no/Upload/Publikasjoner/Staff%20Memo/2008/Staff_Memo_2008_06.pdf>.
RBA (Reserve Bank of Australia) (2010), Payments System Board Annual Report 2010, Reserve Bank of Australia, Sydney.
RBA (2011), Strategic Review of Innovation in the Payments System: Issues for Consultation, June.
Schwartz C, J Fabo, O Bailey and L Carter (2008), ‘Payment Costs in Australia’, in Payments System Review Conference, Proceedings of a Conference, Reserve Bank of Australia and Centre for Business and Public Policy at the Melbourne Business School, Sydney, pp 88–138.