Bulletin – December 2011 The Australian Credit Default Swap Market
- Download the article 963KB
Abstract
The Australian credit default swap (CDS) market has been increasingly used by financial institutions to trade and manage credit risk. As a result, there has been greater use of the market as a source of credit risk pricing information. Similarities between CDS and bonds allow pricing in the two markets to be compared. However, the CDS market has a greater tendency at times to be affected by poor liquidity, which complicates the interpretation of CDS pricing, particularly when there are large divergences from bond market pricing.
Introduction
A credit default swap or CDS is a derivative contract that provides a means of protection against credit risk. CDS contracts have been increasingly used by banks and other financial institutions in Australia and overseas to manage credit risk, with trading activity growing significantly over the past decade.
CDS contracts act like a form of insurance. The buyer of the CDS contract is compensated by the seller if a ‘credit event’ occurs to a third party (the reference entity) within a specified period of time. The CDS buyer pays a fee (or premium) in order to receive this credit protection. CDS contracts are predominantly traded over-the-counter (OTC), that is, directly between two parties rather than on an exchange. The reference entities on which CDS contracts can be written include corporations, governments and asset-backed securities. In Australia, CDS reference entities are predominantly corporations. Credit events can include bankruptcy, missing a debt payment, debt restructuring or a credit rating downgrade of the reference entity. The two most common types of CDS are single-name, which have only one reference entity, and index contracts that are tradable baskets of individual CDS contracts.
The amount of compensation paid following a credit event depends on the change in the price of a debt liability, such as a corporate bond, of the reference entity. It can be paid in two ways. First, the protection buyer can deliver a bond of the reference entity to the protection seller in exchange for payment of the face value of the bond. For example, if the reference entity was to experience a credit event and the market value of its senior debt fell to 60 per cent of the face value, the protection buyer could deliver this debt and receive payment of the full face value. In effect, the protection buyer is compensated for the 40 per cent loss of the face value. Second, rather than delivering a bond, the protection buyer may simply receive a cash payment from the protection seller, the size of which is determined at an auction of the reference entity's bonds.[1] Cash settlement is now the standard means of compensation. This is partly to avoid the difficulties of insufficient stock of physical debt being available, as there are often more CDS contracts outstanding than there is physical debt for reference entities.
CDS contracts can be used for both hedging and speculative purposes. For example, if a bond investor is seeking to reduce (or hedge) the credit risk in its bond portfolio, it can purchase credit protection via the CDS market on companies whose debt forms part of its portfolio. Likewise, banks use CDS to hedge credit risk in their loan portfolio. However, the ability to buy credit protection in the CDS market is not limited to those market participants that hold the physical debt of reference entities.[2] For instance, a market participant that buys credit protection on a reference entity, but does not actually hold its debt, is speculating that the creditworthiness of the entity will deteriorate or that the entity will experience a credit event. In the case of a deterioration in creditworthiness, the CDS premium for this entity would rise. The speculator could then sell credit protection on the same reference entity and profit from the difference between the current CDS premium and the premium that they are paying on their original CDS contract. Alternatively, a market participant could sell credit protection on a reference entity, in order to speculate on an improvement in its creditworthiness.
Credit Exposure in the CDS Market
Two types of credit exposure arise from CDS trading. First, as discussed above, there is the credit risk associated with the reference entity. Second, there is counterparty credit risk, which is the risk that one of the parties to the CDS contract fails to fulfil its obligations, such as paying the CDS premium or making the required compensation payment following a credit event. Market participants do, however, take measures to mitigate this counterparty credit risk, such as through margining or clearing through central counterparties.[3] Each of these types of credit risk are discussed below.
An aggregate measure of the net credit risk transfer (of reference entities) that is accruing in the CDS market can be calculated by adding up the net value of credit protection bought by individual market participants. An example involving a CDS market with two banks as participants and two reference entities is provided in Table 1.[4] If Bank A has 20 ‘bought’ positions and 5 ‘sold’ positions for reference entity 1, it has a net ‘bought’ position of 15. In net terms, Bank A has bought protection from Bank B. Net bought CDS positions for all reference entities can then be aggregated for all market participants to obtain the net outstanding face (or notional) value of contracts, or net credit exposure, of market participants. The net outstanding face value is also a measure of the maximum amount that credit protection sellers would need to pay to buyers if all CDS reference entities experienced credit events and the recovery rate on the underlying debt instrument was zero.[5]
|
Reference entity 1 |
Reference entity 2 |
Total | ||||
|---|---|---|---|---|---|---|
| Bank A | ||||||
| Bought contracts (+) | 20 | 10 | 30 | |||
| Sold contracts (−) | −5 | −15 | −20 | |||
| Net bought contracts | 15 | na | 15 | |||
| Net sold contracts | na | −5 | −5 | |||
| Bank B | ||||||
| Bought contracts (+) | 5 | 15 | 20 | |||
| Sold contracts (−) | −20 | −10 | −30 | |||
| Net bought contracts | na | 5 | 5 | |||
| Net sold contracts | −15 | na | −15 | |||
| Total | ||||||
| Net outstanding contracts | 15 | 5 | 20 | |||
| Gross outstanding contracts | 25 | 25 | 50 | |||
|
Source: RBA |
||||||
A comparison of the value of net outstanding CDS contracts and outstanding bonds for Australian corporates shows that the CDS market is still relatively small. In aggregate, global bonds outstanding of Australian companies are close to US$690 billion, compared with US$31 billion of net outstanding CDS.[6] One reason for this large difference is that the value of outstanding bonds is heavily weighted towards bank debt (around 70 per cent of the total), while there is only a small amount of CDS referenced on Australian banks, which account for only one-third of Australian CDS.
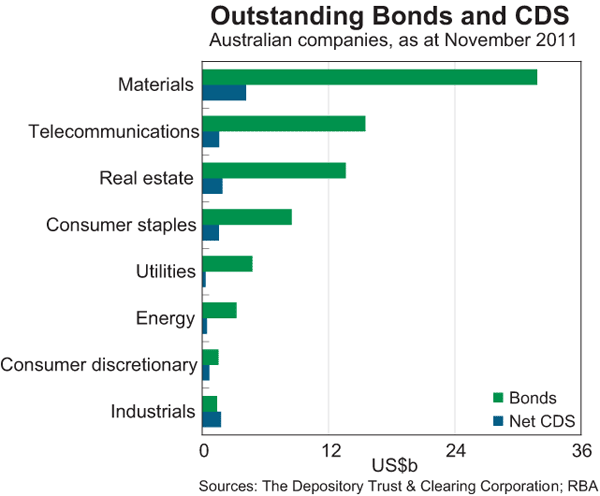
For non-financial companies, the bond market is also larger than net outstanding CDS. Interestingly, the relativities across the different non-financial sectors are similar, partly reflecting that the bond and CDS markets complement each other in pricing credit risk. Most of the exposure to companies is in the materials, telecommunications, real estate and consumer staples sectors (Graph 1). However, there are some differences in relative credit exposures, which could reflect banks using CDS to hedge credit exposures on business loans.
An aggregate measure of counterparty risk, which does not take into account risk-mitigation methods, is the market value of outstanding CDS contracts. The market value of a CDS contract is the cost of replacing the contract at the current premium. If the level of CDS premia has not changed from when the contract was entered into, the market value will be approximately zero. Global data from the Bank for International Settlements (BIS) suggest that there was a significant increase in the market value of outstanding CDS contracts in the years leading up to, and then during, the financial crisis (Graph 2). Expressed as a percentage of the market value of global OTC derivatives, the market value of CDS contracts increased from around 1½ per cent in 2004 to a peak of more than 15 per cent by mid 2008. This reflected the growth in trading activity and the rise in CDS premia. Growth in trading activity from the early 2000s reflected, among other things, increased investor appetite for risk, with investors attempting to enhance returns by selling credit protection (which was associated with a downward trend in CDS premia) (Graph 3). As the financial crisis unfolded, however, investors increasingly sought to buy credit protection, which placed significant upward pressure on CDS premia.
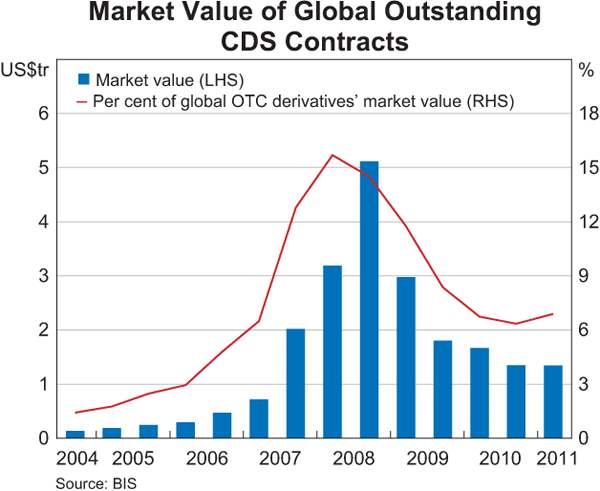
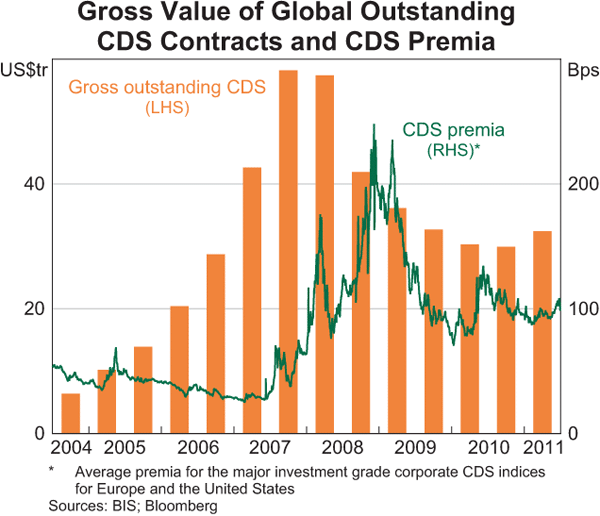
The significant decline in the market value of outstanding CDS contracts since 2008 largely reflects the increased use of trade compression services (‘tear-ups’) in the CDS market. These services – offered by companies such as TriOptima, Markit and Creditex, and conducted by some central counterparties – cancel out offsetting gross outstanding CDS contracts in order to reduce counterparty risk, while leaving net credit exposures largely unchanged. This is possible because the trading and market-making activities of CDS market participants tend to result in the build-up of a large number of offsetting bought and sold positions. Many market participants also prefer to maintain their trading positions in relatively new, and more liquid, contracts. As such, market participants will often close out old (‘stale’) CDS trading positions – those entered into six months earlier, for example – by entering into offsetting trades and then re-establishing the desired trading position in a more liquid contract. During the financial crisis, when counterparty risk concerns increased significantly, particularly for a number of large global banks that were major CDS market dealers, there was a dramatic increase in tear-up activity. The increase in tear-up activity was also supported by improved trade processing practices, such as increased use of electronic confirmations.[7] This followed concerns in the mid 2000s regarding counterparty risk stemming from the large backlog of unconfirmed CDS trades in major overseas markets.
Market participants in Australia also regularly engage in rounds of trade compression, which has had a significant effect on the gross value of outstanding contracts. The gross value for outstanding contracts was estimated by the Australian Financial Markets Association (AFMA) to be around A$340 billion in mid 2011 (AFMA 2011). Tear-ups in the Australian market have probably been around A$800 billion since 2006, as nearly A$1.2 trillion in CDS have traded over the period, mainly with a maturity of 5 years.
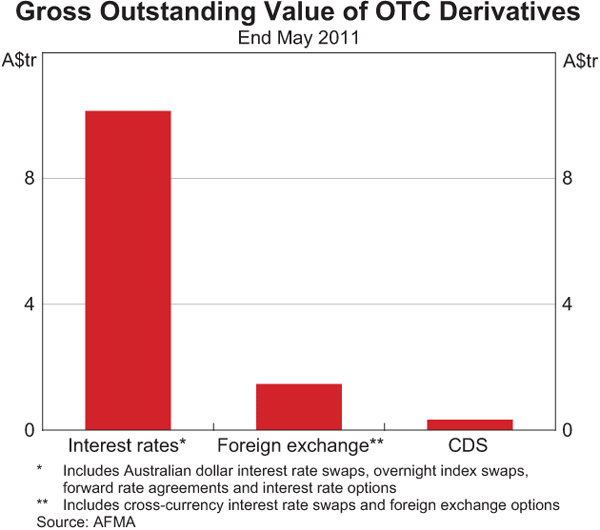
As at end May 2011, CDS accounted for only around 3½ per cent of outstanding OTC derivatives in the Australian market (Graph 4). This suggests that CDS are not a major source of counterparty risk in Australia and that tear-up activity has made a significant contribution to reducing this risk.
Liquidity in CDS and Bond Markets
The reliability of information gleaned from CDS prices is very much a function of the market's liquidity. As noted above, CDS contracts expose market participants not only to the credit risk of the reference entity but also to counterparty risk. The presence of this counterparty risk could have a negative effect on liquidity in the CDS market relative to that in the bond market, particularly when this risk is perceived to be high, such as in recent months in global markets.
On the other hand, other factors promote CDS market liquidity relative to the bond market. CDS contracts are more standardised than bonds, with standard coupon rates that are paid at a common set of dates, and trading activity is concentrated in a small number of maturities (most notably 5-year contracts). In contrast, bonds have a wider range of maturities, some are secured and others are not, while some bonds have embedded options.
Another potential advantage for the CDS market is that trading is not restricted to the size of the physical bond market. All that is required to trade a CDS contract is for there to be another market participant that is willing to take the opposite position. In contrast, trading in bonds is limited to those particular bonds that have been issued and many Australian companies are not regular issuers of bonds. Also, bonds that have been issued may not trade very often as some bond investors have a ‘buy-and-hold’ approach.[8]
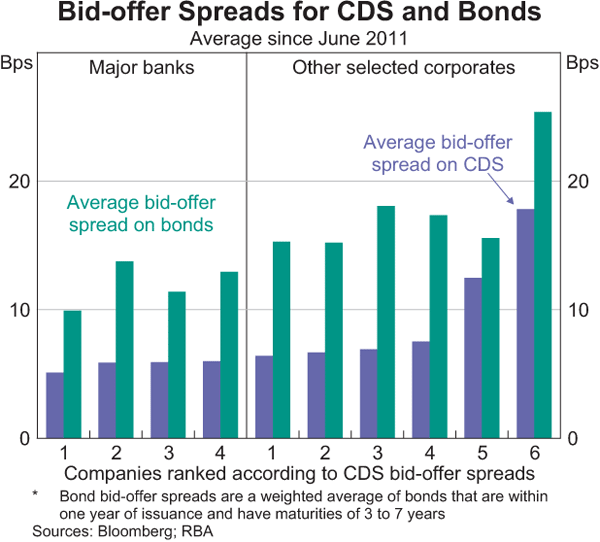
A commonly used gauge of market liquidity is the difference between the best bid and best offer prices in the market, known as the bid-offer spread. Indicative bid-offer spreads quoted by dealers in both the CDS and bond markets are shown in Graph 5. These suggest that for a selection of banks and non-financial corporates, the bid-offer spreads in the CDS market have been lower than in the bond market in recent months.
Another gauge of market liquidity is market depth, which refers to the size of the transaction that can be done without affecting the market price. For instance, it is typical for the larger CDS dealers in the Australian market to quote bid and offer prices for amounts of between US$5 million and US$10 million. While it is difficult to obtain estimates of the typical amounts that are quoted for corporate bonds, for some benchmark bond lines that have a relatively large volume of trading activity, such as those of the major banks, market participants are likely to have the ability to trade larger amounts at a given price than in the CDS market. This reflects the fact that the market for bank bonds is much larger than the market for bank CDS.
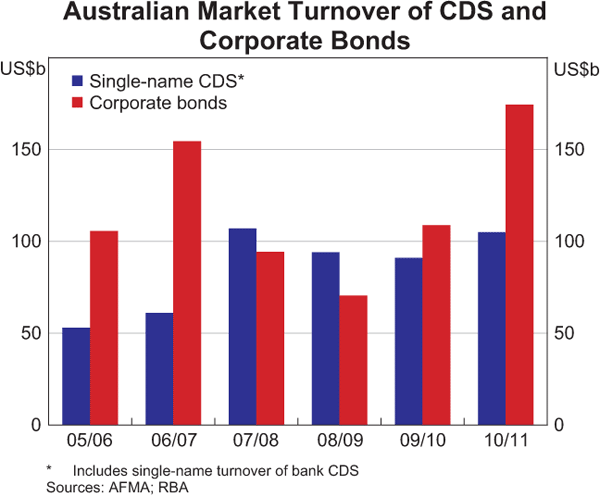
A broad indicator of overall market depth is turnover. In the domestic market, turnover is typically larger in aggregate for corporate bonds than single-name CDS, other than in 2007/08 and 2008/09 when corporate bond turnover fell sharply (Graph 6). Turnover in 2010/11 was significantly larger in corporate bonds than single-name CDS.
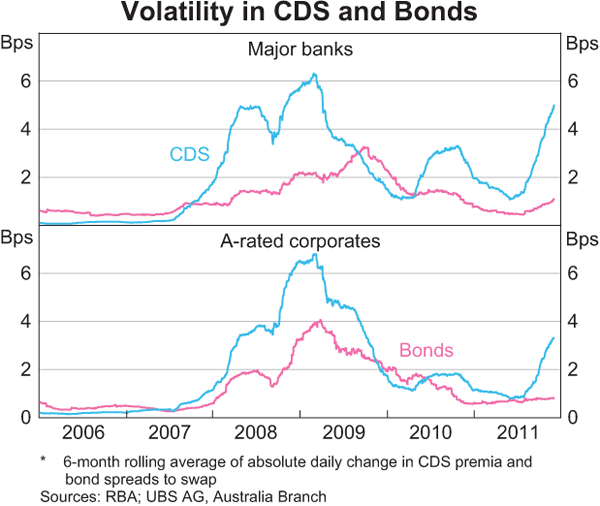
Another indicator of market depth is short-term price volatility. For a given volume of trading activity, a lower level of price volatility is likely to indicate greater market depth. For both the major banks and A-rated corporates, price volatility is consistently higher in the CDS market than in the bond market (Graph 7). Price volatility was also particularly high for CDS relative to bonds during the 2008/09 phase of the crisis and again in recent months. This suggests that during these periods of heightened uncertainty, when perceived counterparty risk also increased, pricing information in the CDS market has tended to be more affected by liquidity issues than the bond market.[9]
In summary, despite the tighter bid-offer spreads in the CDS market relative to the bond market, it appears that there is generally better liquidity in the bond market than in the CDS market, as reflected by the bond market's higher level of turnover and lower level of short-term volatility (notably during periods of market stress). This is particularly the case for the major banks' bonds.
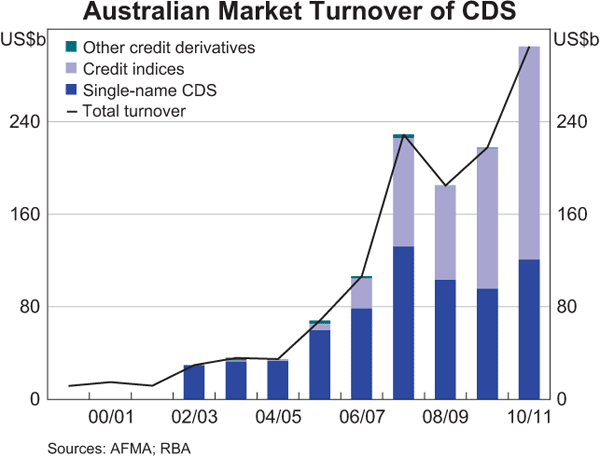
One area of the Australian CDS market where there is greater liquidity is in the CDS indices, with turnover predominantly between banks (including ‘internal’ trades).[10] While there was negligible trading in indices in 2005, they now account for around 60 per cent of total CDS turnover in Australia, and most of this is in the iTraxx Australia index (Graph 8). There are 25 investment-grade constituents in the iTraxx Australia index that are chosen based on the results of a Markit survey of market-makers' trading volumes in single-name CDS. The constituents receive equal weight in the index and there are no more than five banks included. The bid-offer spread on this contract was typically around 2–3 basis points on average in recent months, compared with around 4–5 basis points for single-name contracts with the lowest bid-offer spreads. The bid-offer spread on the iTraxx Australia contract has recently been comparable to that on the iTraxx Japan, but higher than on indices in Europe and the United States where bid-offer spreads are around 1 basis point.
Pricing in CDS and Bond Markets
For a number of Australian companies, credit risk pricing information is available from both the CDS and bond markets. Where this is the case, in principle the two prices should move closely together. Indeed, for some time prior to the financial crisis, CDS and bond pricing were broadly similar for the major banks and A-rated corporates (Graphs 9 and 10).[11] Subsequently, however, there have been periods of significant pricing discrepancies, which seem larger than can be reasonably explained by liquidity differences (such as bid-offer spreads).
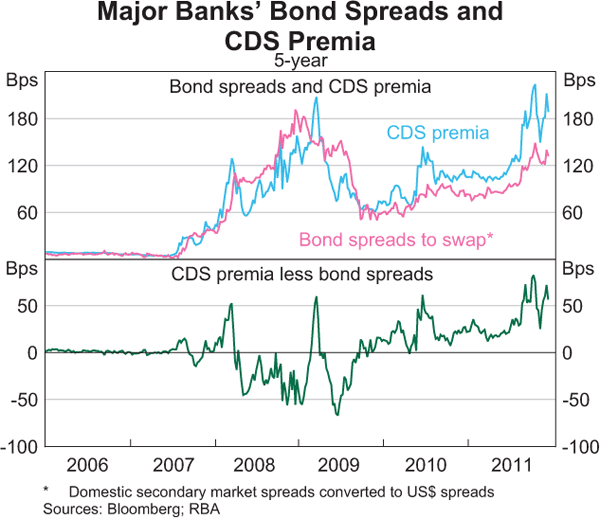
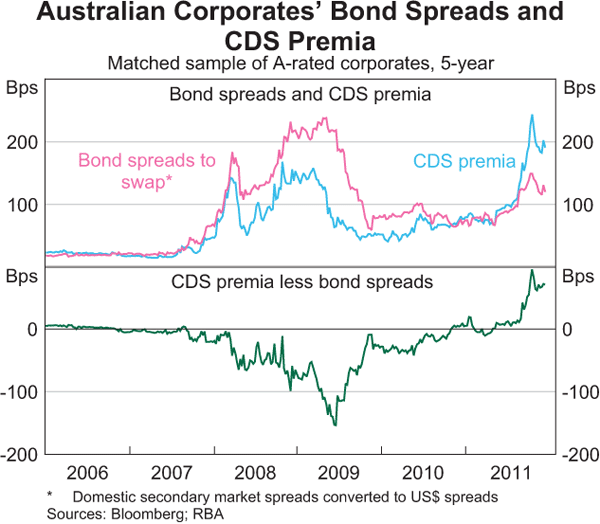
One factor that might explain these pricing differences is market segmentation. The expectation that CDS premia and bond spreads, for the same maturity, will be relatively close for individual companies relies on the ability to arbitrage across these markets. That is, market participants would need to be able to enter into trading positions in both CDS and bonds that would allow them to profit from pricing differences, while taking little or no risk. If arbitrage between the two markets is not possible or is very costly, CDS and bond pricing would only be similar if market participants across the two markets had similar views of credit risk, and other factors, such as liquidity risk, were similar across markets.
In the Australian market, arbitrage between the CDS and bond markets can be difficult to undertake and involves some costs. Arbitrage can be particularly difficult when there is positive ‘basis’ (the CDS premium is above the bond spread) for a particular corporate. A notable recent example of this is credit risk pricing for the major banks, with CDS premia widening significantly relative to bond spreads in recent months. In the case of positive basis, the arbitrage involves selling credit protection in the CDS contract (described as being ‘long’ CDS) and taking a short position in the relevant bond. However, establishing a short position in the bond involves borrowing the bond in the repurchase agreement (repo) market, before selling it. It can be difficult to borrow some corporate bonds, either because investors are not willing to lend them or there is a small stock outstanding. More generally, however, even if the bond can be borrowed, the usual borrowing term is very short, typically between one day and one week. Over this time frame, the arbitrage is not likely to be particularly profitable and maintaining the arbitrage involves rollover risk. If the bond cannot be borrowed continuously, the arbitrage may need to be unwound, potentially resulting in a loss if market prices have moved unfavourably (i.e. the basis has increased further).
When there is negative basis (the bond spread is above the CDS premium) for a particular corporate, arbitrage may be somewhat easier, as it involves buying the corporate bond and buying protection in the CDS market (going ‘short’ CDS). For market participants that have funding available, such as fund managers, this arbitrage would narrow the basis. However, for market participants that are looking to use the repo market to fund the arbitrage trade – by borrowing cash in a repo transaction in order to fund the bond purchase – it can be more difficult given the limited repo activity in corporate bonds in Australia. Probably the most significant issue with arbitrage of negative basis, which is also equally relevant for arbitrage of positive basis, is the transaction costs involved (notably bid-offer spreads), which can be sizeable for some CDS and bonds. These transaction costs can drive a wedge between pricing in the two markets.
Given these costs and difficulties in arbitraging differences between CDS premia and bond spreads, it should not be surprising to find that differences in pricing do occur. One possible reason for the particularly large price differences during periods of heightened uncertainty in recent years is that repo transactions in corporate bonds became more difficult to arrange, as market participants demanded higher quality collateral such as government and semi-government bonds.
Another factor behind pricing differences between CDS and bonds is how participants in these markets form views on credit risk. One of the notable developments in credit risk pricing in the CDS market over the past two years – using a broader range of companies for which comparable maturity bonds are not always available – is that average CDS premia across different credit ratings have converged (Graph 11). This contrasts with the period prior to, and during, the crisis when CDS premia tended to be higher for lower-rated companies. Pricing in the bond market, on the other hand, still tends to show higher credit risk premia for lower-rated companies.
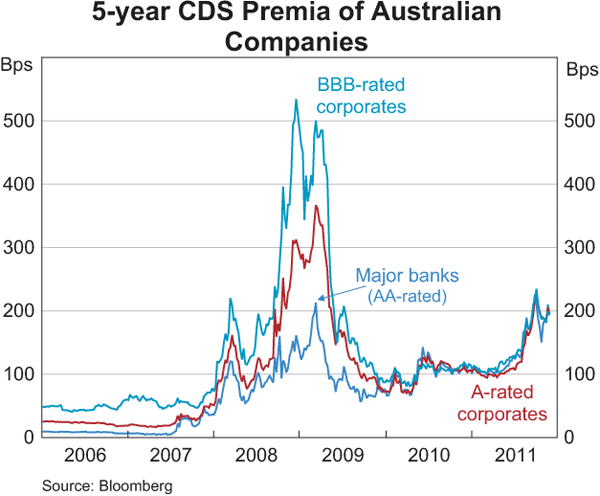
The key driver of this result in the CDS market is changes in credit risk pricing for financial institutions and non-financial corporates. In particular, financial institutions have been perceived as more risky since the onset of the financial crisis. Over the course of 2009, as many A-rated and BBB-rated non-financial corporates reduced their gearing and risk perceptions generally eased, CDS premia for these corporates fell sharply towards those for the major Australian banks (rated AA). Since then, there have also been two notable episodes where the major banks' CDS premia rose above the averages for A-rated and BBB-rated corporates: during the first half of 2010 and over the past few months. Both of these episodes occurred during periods when global financial market volatility picked up significantly amid heightened concern regarding the creditworthiness of some European governments and the potential flow-on effects to their banking systems. This resulted in heightened concerns about financial institutions globally, and led to a widening of their CDS premia, including for the major Australian banks. This occurred despite these institutions remaining profitable and having strong capital positions. One explanation could be that some market participants in recent months have taken ‘short’ positions in CDS contracts (i.e. buying credit protection) in order to hedge against, or speculate on, the occurrence of unlikely but significant events, such as another deep global economic downturn.
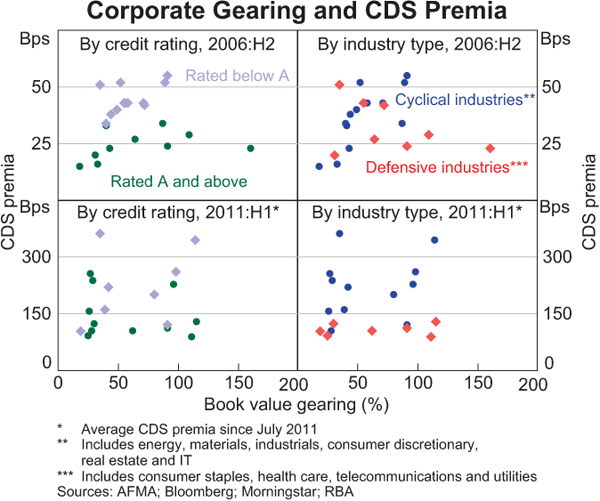
More generally, the industry in which a corporate operates has become more important in determining its CDS premium. Prior to the crisis, non-financial companies with a credit rating of A or above tended to have lower CDS premia than those with a credit rating below A (top left panel of Graph 12). However, more recently, as shown in the bottom left panel of the graph, there are a number of companies with credit ratings of A or above that have higher CDS premia than lower rated companies. The bottom right panel of Graph 12 illustrates the current importance of the industry in which a corporate operates. The CDS premia of most companies in ‘cyclical’ industries (such as consumer discretionary and industrial companies) have recently been higher than the CDS premia of companies in ‘defensive’ industries (such as consumer staples, health care and utilities).[12] Furthermore, the level of gearing appears to have some importance for the CDS premia of cyclical industry companies, but the CDS premia of defensive industry companies tend to have little variation, regardless of the level of gearing.
Conclusion
The pricing information in the CDS market has become more closely watched by financial market participants in Australia over recent years. However, despite the development of the CDS market, there is some evidence to suggest that the bond market is generally deeper and short-term price movements are less affected by market liquidity. More broadly, the CDS market remains relatively small compared with the bond market and other OTC derivatives in terms of credit risk exposure.
Footnotes
The author is from Domestic Markets Department and would like to thank Rwitu Bagchi, Tom Williams and David Lancaster for their assistance in preparing this paper. [*]
The International Swaps and Derivatives Association (ISDA) publishes a list of debt obligations that are eligible to be delivered in the auction. For more details on the auction process used to determine the cash payment from protection sellers to protection buyers, see <http://www.creditfixings.com/information/affiliations/fixings/auctions/docs/credit_event_auction_primer.pdf> [1]
An interesting development recently is that the European Union has agreed to restrictions on which market participants can trade CDS on member states' sovereign debt. Specifically, credit protection will only be able to be bought by a market participant that owns physical debt of a sovereign. [2]
In the global CDS market, ISDA reports that 93 per cent of all credit derivative trades executed in 2010 were subject to margining (collateral) arrangements (ISDA 2011). Also, BIS data as at June 2011 show that 17 per cent of gross outstanding CDS contracts were traded through central counterparties. [3]
The aggregate net bought position is equal to the net sold position for each reference entity, as every CDS contract has a buyer and a seller. [4]
While recovery rates are normally non-zero, recovery rates from many global CDS auction results in late 2008 and early 2009 were between zero and 20 per cent. [5]
Figures are presented in US dollars as this is the most common currency denomination of CDS and bonds. [6]
The Depository Trust & Clearing Corporation (DTCC) is the operator of the Trade Information Warehouse that is the main global repository of global CDS transactions, the vast majority of which are now electronically confirmed (matched). This warehouse facilitates the processing required in trade compression rounds. [7]
Buy-and-hold investors have a less limiting effect on trading activity if they readily lend their stock out to other market participants, who could then trade it. However, there does not appear to be a significant amount of corporate bond lending activity (via repurchase agreements) in Australia. [8]
It is difficult to make a comparison of CDS and bond markets for companies with ratings of BBB or lower, as there are fewer companies for which both CDS and bonds of a similar maturity are available. [9]
Internal trades are trades that are done within banks. For example, to hedge credit risk, a bond trading desk at a bank may trade with the CDS trading desk within the same bank. The CDS trading desk will then likely hedge its risk on this internal trade by trading with another bank. [10]
For corporates and banks, market convention is to compare CDS premia with the spread between bond yields and swap rates referenced to bank bills. This swap rate is used as the benchmark as this is the most appropriate rate to assume would be used in repo transactions required for arbitrage between CDS and bonds on corporates and banks (this arbitrage is explained in more detail below). [11]
Companies described as ‘defensive stocks’ tend to have below-average earnings volatility and lower volatility in their share prices because there is less uncertainty surrounding future earnings. Other companies can be described as ‘cyclical stocks’. Compared with defensive companies, these companies' earnings tend to be more volatile, sresulting in higher share price volatility. [12]
References
AFMA (Australian Financial Markets Association) (2011), ‘2011 Australian Financial Markets Report’. Available at <http://www.afma.com.au/afmawr/_assets/main/lib90013/2011%20afmr.pdf>.
ISDA (International Swaps and Derivatives Association) (2011), ‘ISDA Margin Survey 2011’. Available at <http://www2.isda.org/functional-areas/research/surveys/margin-surveys>.