Bulletin – March 2010 Global Foreign Exchange Turnover
- Download the article 116KB
Abstract
The most recent six-monthly data on global foreign exchange turnover show a rebound in activity between April and October 2009 across all markets and major currency pairs. The broad-based increase in turnover is in line with the improvement in global economic and financial conditions since early 2009. Despite the rebound, turnover remains below the peak in early 2008.
Introduction
This article discusses developments in the global foreign exchange market between April and October 2009. It draws on semi-annual average daily turnover data for the foreign exchange markets of Australia, Canada, Singapore, the United Kingdom and the United States. These data are compiled by foreign exchange committees in each of these markets by surveying financial institutions active in foreign exchange markets.[1] These five markets account for just over 60 per cent of global foreign exchange activity and hence provide a good indication of global trends. In addition, the article discusses more recent developments in the Australian foreign exchange market using monthly turnover data collected by the Reserve Bank of Australia.
The most recent semi-annual data show that turnover in foreign exchange markets rebounded in the half-year to October 2009, following a period when activity declined due to the detrimental effects of the global financial crisis on cross-border investment flows and international trade. This pick-up accords with the general improvement in economic and financial conditions since early 2009. More recent monthly data for Australia confirm the ongoing recovery in foreign exchange turnover.
Global Developments
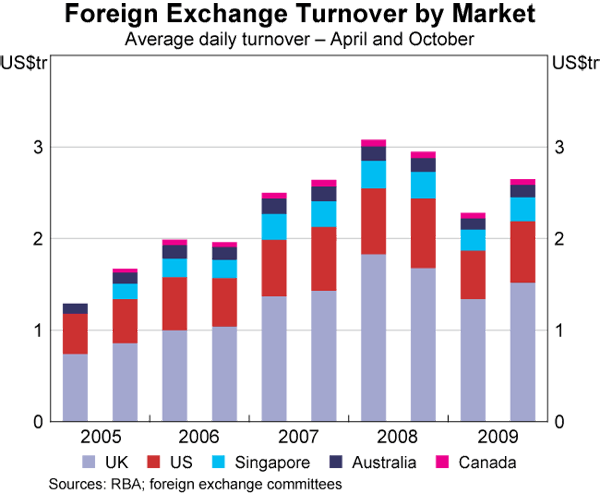
Average daily turnover in the five major foreign exchange markets noted earlier increased by 17 per cent between April and October 2009 to $2.7 trillion (Graph 1). This was the first increase in turnover since the six months to April 2008 and was broad-based across markets and currency pairs, indicating the continued importance of global factors.
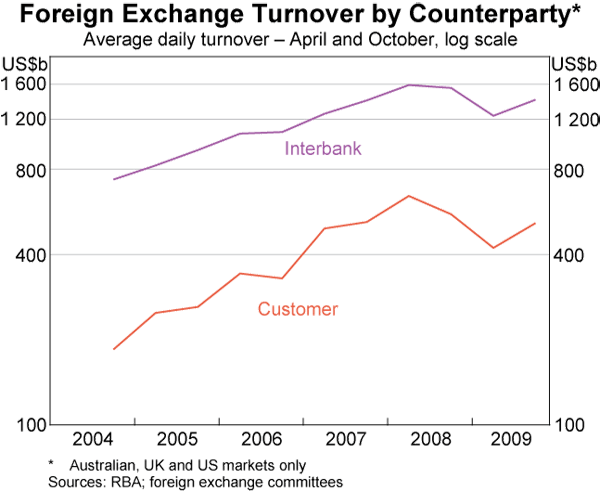
Data on turnover for Australia, the United Kingdom and the United States can be separated into transactions occurring in the interbank market and transactions between foreign exchange dealers and their non-bank customers (which include non-bank financial institutions, importers and exporters). The recovery in the non-bank customer market has been somewhat more pronounced than in the interbank market, with turnover increasing by 22 per cent over the six months to October 2009, compared with a 14 per cent increase in the interbank market (Graph 2). The rebound in customer demand follows a proportionately larger fall in this segment during the crisis period.
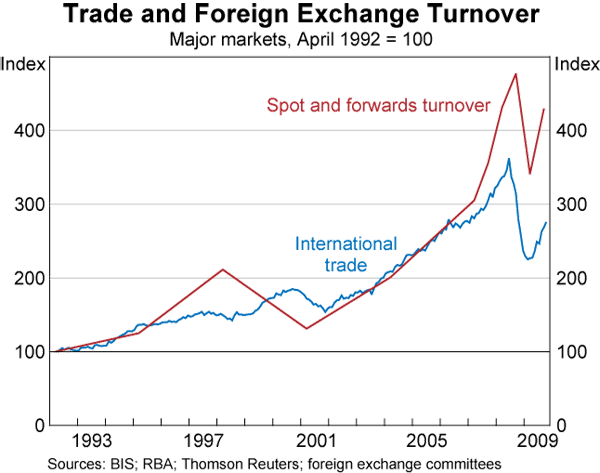
The pick-up in overall turnover was broad-based across all instruments over the six-month period (Graph 3). The rebound in spot and forwards turnover was particularly sharp. One factor driving the rebound in turnover in these instruments was the recovery in international trade from its crisis-related trough in early 2009. International trade generates demand for spot and forward foreign exchange because, for most transactions, one party must exchange their domestic currency for the invoice currency. This can be undertaken in either the spot market or in the forward market ahead of the invoice payment; the latter also provides a hedge against subsequent exchange rate movements. As a result, growth in turnover in spot and forward foreign exchange has historically been closely linked to developments in gross trade (Graph 4).
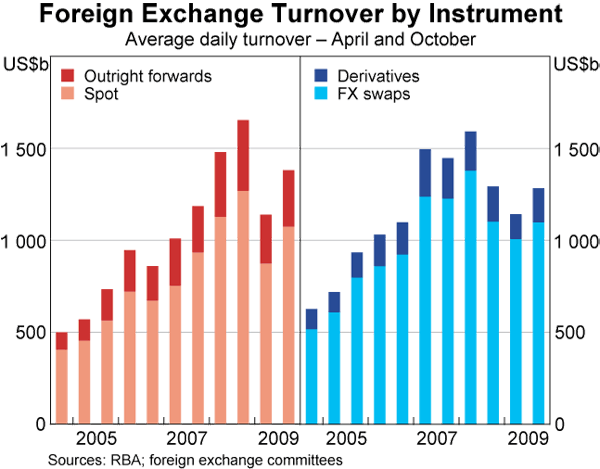
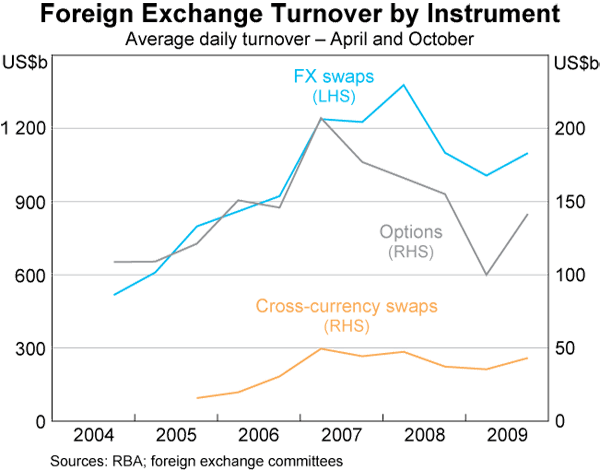
Turnover in foreign exchange swaps, cross-currency swaps and options also increased over the period, but, as for spot and forwards, turnover still remains below its peak in 2008. Turnover in options increased particularly strongly (42 per cent), following sharp falls since April 2007 (Graph 5). The increase in turnover of these instruments (and also turnover in spot and forwards) is likely to be linked to renewed cross-border investment activity in 2009, particularly the recovery in debt flows that are typically hedged using swaps. Data from the Bank for International Settlements (BIS) indicate that cross-border lending by banks, which contracted substantially over 2008, picked up in the second and third quarters of 2009. Likewise, balance of payments data for major economies indicate that gross private cross-border investment flows resumed over the course of 2009, after being scaled back during the crisis period.
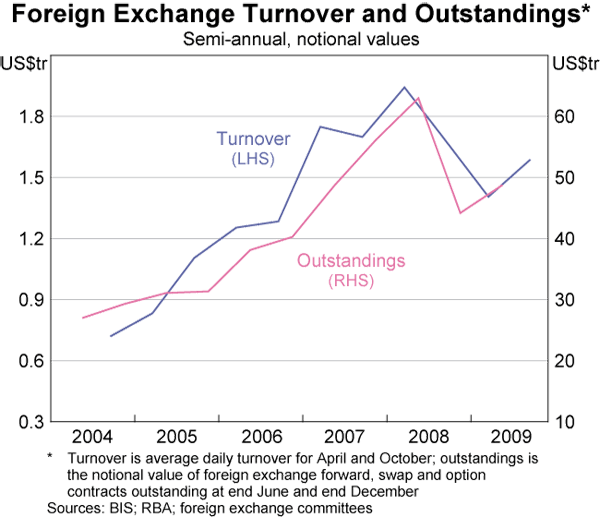
Consistent with the turnover data, data collected by the BIS indicate that the value of foreign exchange derivative contracts (forwards, foreign exchange swaps, cross-currency swaps and foreign exchange options) outstanding in the G10 countries and Switzerland also increased over the first half of 2009, after declining through the crisis period (Graph 6). The notional value of contracts outstanding rose by 10 per cent between December 2008 and June 2009, although it remains 22 per cent below its June 2008 peak. As for the turnover data, changes in the notional value of contracts outstanding were similar across currency pairs.
Australian Developments
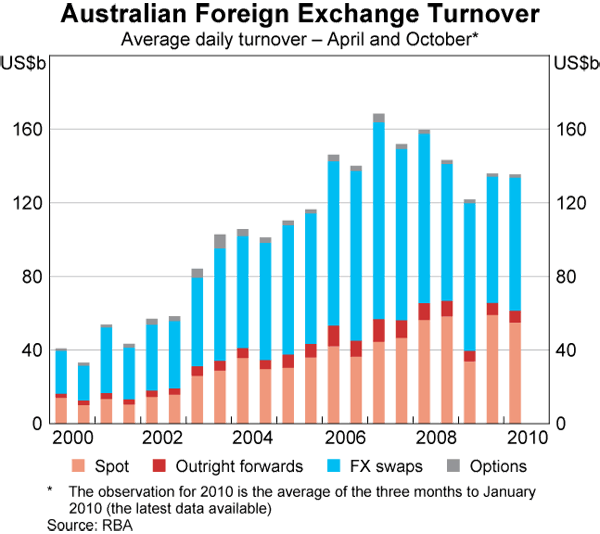
Over the six months to October 2009, developments in the Australian market broadly followed those in the four other markets, suggesting that the same global factors were important in driving recent developments in Australia. As in the other markets, aggregate turnover in the Australian market increased strongly, but remained well below its early 2007 peak (Graph 7). Combined spot and forwards turnover increased by 66 per cent, a somewhat sharper increase than seen in other regional markets, partly reflecting the relatively sharp pick-up in Australia's international trade in late 2009. Turnover of foreign exchange swaps in the Australian market fell over the six months to October 2009. However, consistent with renewed gross cross-border investment flows and the modest growth in turnover of foreign exchange swaps in other regional markets, recent monthly data collected by the Reserve Bank of Australia indicate that average turnover in the Australian foreign exchange swaps market has since increased modestly.[2]
Footnotes
The authors are from International Department. [*]
See <http://www.rba.gov.au/afxc/>. Data for the five markets are collected for the months of April and October each year. The previous article on these data, Zurawski and Ossolinski (2009), included data for Japan that are only published for April each year. Data on turnover for the global foreign exchange market are collected every three years by the Bank for International Settlements (BIS Triennial Survey); the next triennial survey is for April 2010, with data available in late 2010. [1]
For a review of Australian capital flows during the financial crisis, see D’Arcy and Ossolinski (2009). [2]
References
D’Arcy P and C Ossolinski (2009), ‘Australian Capital Flows and the Financial Crisis’, RBA Bulletin, November, pp 1–6.
Zurawski A and C Ossolinski (2009), ‘An Update on Global Foreign Exchange Turnover’, RBA Bulletin, August, pp 5–9.