Bulletin – June 2010 Banking Fees in Australia
- Download the article 237KB
Abstract
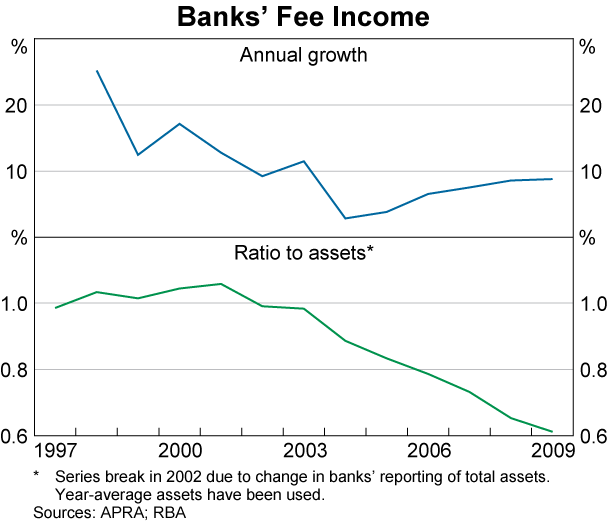
The Reserve Bank has conducted a survey on bank fees each year since 1997. In 2009 growth in fee income increased slightly from recent years though it was again slower than growth in banks' balance sheets. Growth in fee income was higher for businesses than for households. Banks reacted to the financial crisis by competing more aggressively for deposit funding which resulted in total fee income from deposit accounts falling, and repricing loan products which contributed to an increase in fee income from lending.
Fees from Banking Activities
The Reserve Bank's annual bank fee survey provides information on the fees that banks earn from their Australian operations.[1] The focus of the survey is fee income earned by banks in the process of taking deposits, making loans and providing payment services. Other forms of non-interest income, such as from funds management and insurance operations, are excluded from the survey. This article summarises the results of the latest survey, relating to banks' 2009 financial year. The survey covers 18 institutions, which together account for around 90 per cent of the total assets of the Australian banking sector.
For those banks participating in the survey, total domestic fee income grew by 9 per cent in 2009 to $12.7 billion, with fee income from businesses growing much faster than fee income from households (Table 1 and Graph 1). As has been the case since 2002, growth in fee income was slower than the growth in banks' balance sheet assets. Consequently, the ratio of fee income to assets has continued to decline. Income from exception fees, which are charged by a bank when a customer breaches the terms of a banking product – typically by making a late payment, overdrawing a deposit account or exceeding a credit limit – were little changed at $1.2 billion (see below).

| Households | Businesses | Total | ||||
|---|---|---|---|---|---|---|
| $ billion | Growth Per cent |
$ billion | Growth Per cent |
$ billion | Growth Per cent |
|
| 2007 | 4.5 | 8 | 6.2 | 7 | 10.7 | 8 |
| 2008 | 4.9 | 8 | 6.8 | 9 | 11.6 | 9 |
| 2009 | 5.0 | 3 | 7.6 | 13 | 12.7 | 9 |
|
Source: RBA |
||||||
Businesses
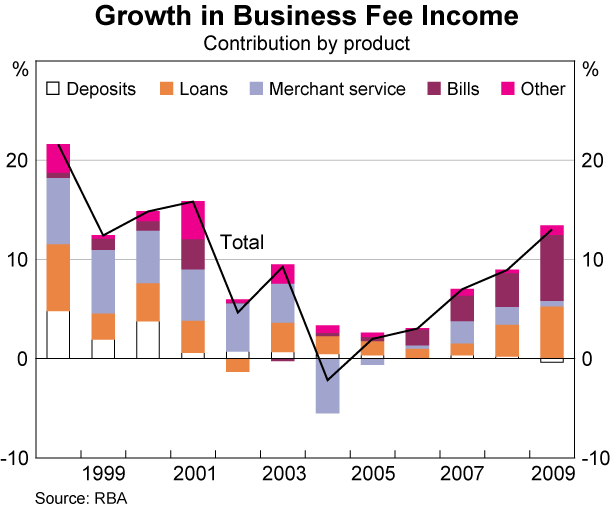
Banks' fee income from businesses increased by 13 per cent in 2009 to $7.6 billion (Table 2 and Graph 2). As was the case in 2008, most of the growth in business fee income resulted from growth in fees from loans and bank bill facilities, while fees on business deposit accounts were little changed.
| 2007 | 2008 | 2009 | Growth 2009 Per cent |
Average growth 2003–2008 Per cent |
|
|---|---|---|---|---|---|
| Deposit accounts | 834 | 850 | 826 | −3 | 2 |
| – of which: exception fees | .. | 126 | 115 | −9 | .. |
| Loans | 1,638 | 1,838 | 2,197 | 20 | 7 |
| – of which: exception fees | .. | 77 | 84 | 9 | .. |
| Merchant service fees | 1,632 | 1,743 | 1,780 | 2 | −1 |
| Bank bills | 1,380 | 1,591 | 2,042 | 28 | 8 |
| Other | 716 | 732 | 790 | 8 | 3 |
| Total | 6,201 | 6,755 | 7,634 | 13 | 4 |
| – of which: exception fees | .. | 203 | 199 | −2 | .. |
|
Source: RBA |
|||||

Fee income from business loans increased by 20 per cent in 2009, while fee income from bank bills (which includes charges for arranging bank bill facilities and accepting or endorsing bank bills) increased by 28 per cent. Banks' lending to the business sector was, however, little changed during the year. The increase in fees on these facilities reflects the repricing of credit and liquidity risks; in particular, fees on undrawn loan facilities appear to have risen significantly.
In contrast to the solid growth in business loan fees, business deposit fee income was broadly stable over 2009, even though business deposits increased significantly over the year. This reflects strong competition for business deposits over the period.
Exception fees paid by businesses declined by 2 per cent in 2009, with growth in exception fees on business loans being more than offset by a fall in exception fees on deposit accounts. Exception fees on business deposits are likely to decline further in the 2010 financial year as a number of banks have undertaken initiatives to lower or remove these fees. Around 16 per cent of total exception fees were levied on businesses (mostly small businesses); this share is little changed from 2008.
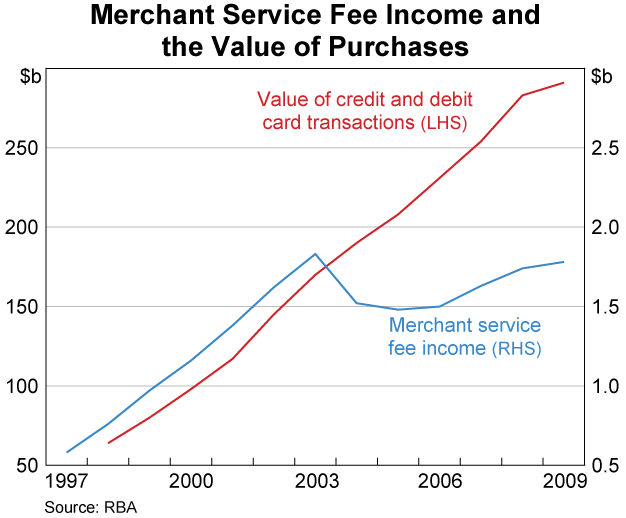
Merchant service fees – which are charged to merchants for providing credit and debit card transaction services – rose by 2 per cent in 2009 (Graph 3). Since the introduction of the Reserve Bank's credit card interchange reforms in 2003, the value of card transactions has increased by 70 per cent, while total merchant service fees remain below their peak in 2003. Small businesses continue to pay around three-quarters of all merchant service fees.

Households
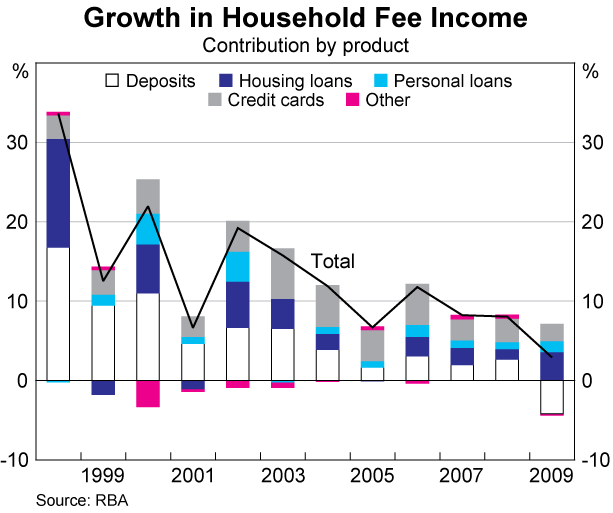
Banks' fee income from households rose by 3 per cent to $5.0 billion in 2009 (Table 3 and Graph 4). This is the slowest rate of growth in household fees since the survey began in 1997, with strong growth in housing loan fee income partially offset by a decline in deposit account fees.
| 2007 | 2008 | 2009 | Growth 2009 Per cent |
Average growth 2003–2008 Per cent |
|
|---|---|---|---|---|---|
| Loans: | |||||
| – Housing | 997 | 1,057 | 1,235 | 17 | 7 |
| – Personal | 445 | 485 | 552 | 14 | 11 |
| – Credit cards | 1,199 | 1,332 | 1,434 | 8 | 17 |
| Deposits | 1,797 | 1,918 | 1,713 | −11 | 6 |
| Other fees | 87 | 107 | 97 | −9 | 9 |
| Total | 4,525 | 4,890 | 5,032 | 3 | 9 |
|
Source: RBA |
|||||

Fee income from housing loans increased by 17 per cent in 2009, much higher than the average annual growth of 7 per cent recorded between 2003 and 2008, and broadly in line with growth in housing lending. The increase in housing fee income was driven by establishment and early exit fees, with the available information suggesting that break fees on fixed-rate loans accounted for a significant proportion of the overall growth in fees. These break fees are charged by banks to recover the costs associated with exiting swap transactions that banks undertake to fund borrowers' fixed-rate loans. Consequently, this component has increased as a number of bank customers chose to refinance their fixed-rate housing loans with variable-rate loans given the significant fall in the cash rate during banks' 2009 financial year. Excluding break fees on fixed-rate loans, it is estimated that housing fee income rose by around 7 per cent. Fee income from personal loans grew by 14 per cent, which is attributable to both an increase in account-servicing fees and an increase in exception fees (see below).
Credit card fee income increased by 8 per cent in 2009, well below the average annual growth of 17 per cent over recent years. Within total credit card fees, other fees (mainly exception fees) grew most strongly at 10 per cent, consistent with growth in the value of non-performing credit card loans over the year (see below). Account-servicing fees rose by 5 per cent, driven by a slight increase in the number of cards and an increase in the annual fees on no-frills cards (Table 4). Credit card transaction fees (such as cash advance fees) also grew by 4 per cent.
| 2007 | 2008 | 2009 | |
|---|---|---|---|
| Annual fees ($)(b) | |||
| – No-frills cards | 48 | 49 | 52 |
| – Standard cards | 29 | 29 | 29 |
| – Standard rewards-based cards | 85 | 85 | 85 |
| – Gold rewards-based cards | 140 | 140 | 140 |
| Cash advance fees(c) | |||
| Own bank's ATM | |||
| – $ charge | 1.4 | 1.4 | 1.2 |
| – Per cent of value | 1.1 | 1.3 | 1.6 |
| Other banks' ATM | |||
| – $ charge | 1.6 | 1.6 | 1.4 |
| – Per cent of value | 1.4 | 1.6 | 1.6 |
| Overseas ATM | |||
| – $ charge | 3.6 | 3.6 | 3.6 |
| – Per cent of value | 1.4 | 1.6 | 1.7 |
| Foreign currency conversion fee (per cent of value) | 2.5 | 2.5 | 2.6 |
| – Late payment fee ($) | 31 | 31 | 31 |
| – Over-limit fee ($) | 30 | 30 | 30 |
|
(a) Simple average fees for cards with interest-free periods issued by
the major banks, except for the annual fee on no-frills cards, which is
based on a wider sample of banks. Note that changes in the sample affect
the average fee.
Sources: Canstar Cannex; RBA |
|||
Fee income from household deposits declined by 11 per cent in 2009, despite a large increase in the value of household deposits. The decline in fees was driven by a fall in transaction fee income, partly reflecting the ATM fee reforms that came into effect in March 2009 (see Filipovski and Flood 2010). While the typical post-reform direct charge is unchanged from the level of the typical pre-reform foreign fee, these reforms have seen a shift in transactions towards the use of cardholders' own institutions' ATMs away from more expensive ‘foreign’ ATMs. In addition, the shift to charges being levied by ATM owners means that some of the fee revenue previously being received by banks is going to non-bank owners of ATMs. Account-servicing and other fees – which are mainly exception fees – also declined in value as banks began to compete more aggressively for deposit funding. In particular, a number of banks began to offer deposit products that waive account fees if the account holder makes regular deposits of funds – such as regular salary payments – above a given threshold.
Exception fee income from households was broadly unchanged at $1.0 billion (Table 5). As for the business sector, there was a shift in household exception fee income away from deposit accounts towards loans. Exception fees on credit cards continue to make up the largest share of exception fees paid by households, growing by 10 per cent over the past year. Exception fees on personal loans also grew significantly. The increase in these fees appears to reflect the rise in the number of borrowers falling into arrears on their loans, albeit from low levels. Exception fees for housing loans fell by 6 per cent.
|
$ million
|
Annual growth | ||
|---|---|---|---|
| 2008 | 2009 | Per cent | |
| Deposit accounts | 516 | 476 | −8 |
| – Transaction | 503 | 465 | −8 |
| – Other deposits | 13 | 11 | −13 |
| Loans | 493 | 536 | 9 |
| – Housing | 45 | 42 | −6 |
| – Personal | 21 | 24 | 13 |
| – Credit cards | 427 | 470 | 10 |
| Total | 1,009 | 1,012 | 0.3 |
|
Source: RBA |
|||
Many institutions removed exception fees on deposit products in the latter half of 2009, though there had been some informal waivers of exception fees in early 2009 in an effort to attract deposit funding. Some of this reduction in fees is likely to have already been reflected in the exception fee income for 2009 reported here, though it is likely that the removal of exception fees by some institutions will also affect figures in the 2010 financial year.
Footnote
The survey relates to fee income earned by each participant bank over the course of their respective financial years. The data from the survey are published in the Reserve Bank's Statistical Table ‘Domestic Banking Fee Income’, F6. [1]
Reference
Filipovski B and D Flood (2010), ‘Reform of the ATM System – One Year On’, RBA Bulletin, June, pp 37–45.