Bulletin – January 2009 The Level and Distribution of Recent Mining Sector Revenue[1]
- Download 173KB
Introduction
From 2003/04 to 2007/08, mining sector revenue increased substantially, with Australian dollar receipts rising by an average of around 20 per cent a year. By 2007/08, mining revenue was at its highest level as a share of GDP in at least four decades. Most of the rise in receipts was the result of the sharp increase in global commodity prices between mid 2004 and mid 2008. This article documents the magnitude of the increase in mining revenue, and how these receipts were used, over the four years to 2007/08, both at the aggregate level and for each of the main industries within the mining sector. The article also comments briefly on the outlook following the large declines in global commodity prices seen in recent months.
Mining Sector Revenue
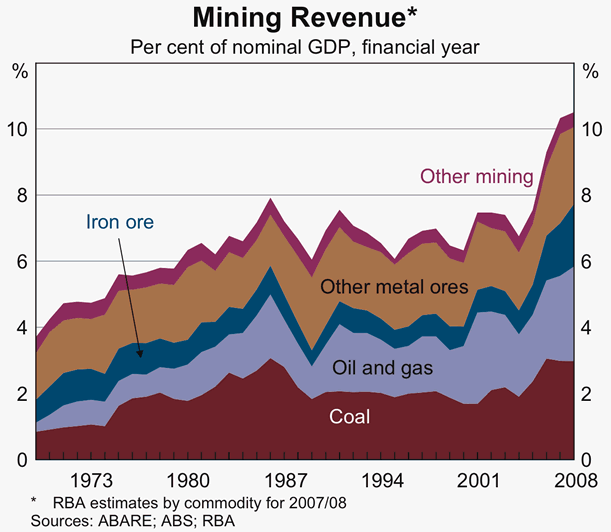
After remaining at around 7 per cent of nominal GDP through much of the 1980s and 1990s, mining receipts started to rise from mid 2004, reaching almost 11 per cent of GDP in 2007/08, to be around $119 billion (Graph 1).[2] The increase in receipts was broad-based across the oil and gas, coal, iron ore and other metal ores industries.
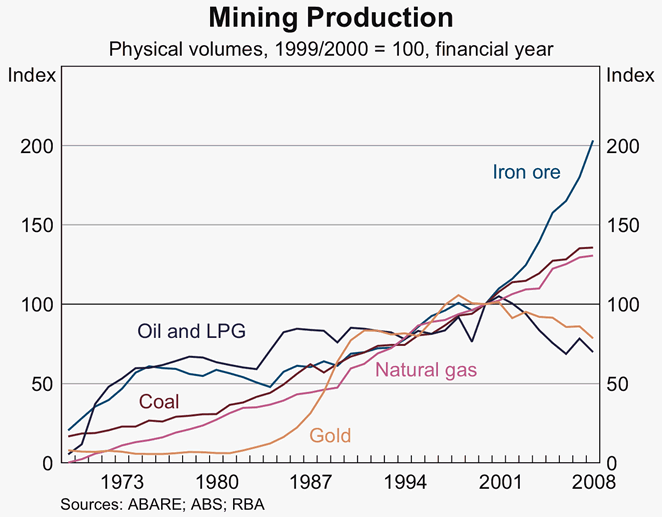
The large rise in mining receipts during this period partly reflected an increase in the volume of production. Mining volume increased by around 3 per cent a year between 2003/04 and 2007/08, with large rises in iron ore, coal and gas production only partly offset by declines in the volume of oil and gold production as Australian oil and gold fields are being gradually exhausted (Graph 2).[3]
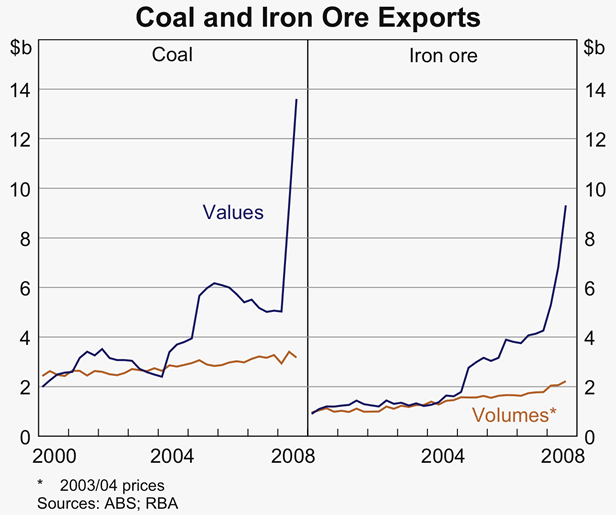
However, the bulk of the increase in mining receipts was due to the large rise in global commodity prices between mid 2004 and mid 2008. Most coal and iron ore exports – which are Australia's two largest exports – are undertaken on the basis of contracts that are negotiated annually, notably with purchasers in Japan, China and Korea. Relative to their level in the 2003/04 Japanese fiscal year, prices for coal in the 2007/08 contract year were around 110 per cent higher while contract prices for iron ore increased by 165 per cent.[4] Further large increases were agreed for the 2008/09 contract year, which boosted coal prices by an average of 180 per cent and iron ore prices by 85 per cent over their 2007/08 contract levels (Graph 3).
Distribution of Mining Sector Revenue
Information on how this mining revenue was distributed can be drawn from the ABS annual releases on Mining Operations and the Australian System of National Accounts, the quarterly mining sector data shown in the Business Indicators release and the Capital Expenditure Survey, and tax data available from the Australian Tax Office's Taxation Statistics. While the data are not always strictly comparable across publications and over time, they are adequate for drawing broad conclusions on the distribution of mining revenue.
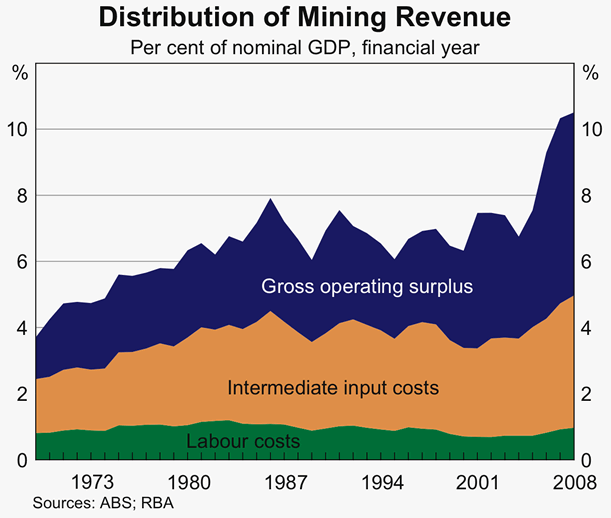
Based on the structure of the national accounts, mining receipts can be distributed as payments for labour and other intermediate inputs and as gross operating surplus (which is similar to profits before interest, tax and depreciation). Labour costs and gross operating surplus contribute directly to GDP since they represent the ‘value added’ component of mining revenue. The intermediate input costs of the mining sector can also contribute indirectly to GDP to the extent they are sourced from other sectors of the domestic economy. Input-output tables suggest that most intermediate inputs to the mining sector are provided by the manufacturing, services to mining, transport, and property & business services sectors. While some manufactured goods used in mining would be imported, most of the services are likely to be domestically sourced. The gross operating surplus of the mining sector is partly used to pay taxes, royalties and dividends, and the balance can be used to fund mining investment, providing a further stimulus to the economy.
Overall, the data suggest around two-fifths of the total increase in mining sector revenue over the four years to 2007/08 was used to fund an increase in labour and intermediate input costs, with the rest accruing to gross operating surplus (Table 1, Graph 4). From this, around one-tenth of the total increase in mining receipts is estimated to have been paid in royalties and taxes. Much of the remaining balance was used to fund the large increase in mining investment, which according to the national accounts was equivalent to almost half of the total increase in mining receipts over the four years. The rest of this article examines each of these components in more detail.
| 1999/2000 | 2003/04 | 2007/08 | |
|---|---|---|---|
| Revenue | 41 | 57 | 119 |
| – Intermediate input costs | 17 | 25 | 45 |
| – Labour costs | 5 | 6 | 11 |
| – Gross operating surplus | 19 | 26 | 63 |
| Memo items | |||
| – Investment | 11 | 16 | 46 |
| – Royalties | 3 | 4 | 7 |
| – Taxes | 1 | 3 | na |
|
Sources: ABS; Australian Taxation Office; RBA; Australian and state government budgets |
|||
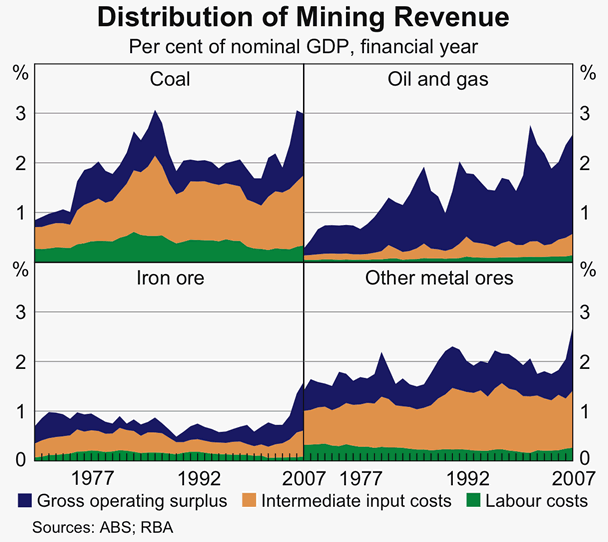
Within the mining sector, there were significant differences as to how the revenue was allocated by industry (Graph 5). There were large increases in intermediate input costs in the coal and iron ore industries – amounting to up to ½ per cent of GDP – partly reflecting rapid input price increases, particularly in the coal industry. Total labour costs, being a significantly smaller share of total costs, remained relatively contained for each industry. Gross operating surplus rose strongly in all industries. While at first glance these data suggest that oil and gas was much more profitable than the other industries, this probably reflects that the oil and gas sector faces higher investment costs up-front, which are not included in intermediate input costs. Nevertheless, oil and gas made a particularly large direct contribution to GDP as a result of having such a large ‘value added’ component in its revenue.
Labour and intermediate input costs
Annual labour costs of the mining sector have grown rapidly, rising on average by 16 per cent a year, or by $5 billion in total, since 2003/04. Despite this rapid growth, the wage and salary bill has remained fairly steady, at around 10 per cent of total mining receipts. Most of the increase in the wage bill over the last four years has reflected the increase in mining employment, which has grown by around 11 per cent a year, to stand at 165,000 people as at the June quarter 2008 according to the labour force survey. According to the ABS wage price index release, wages in the mining sector increased by around 6 per cent a year over the period, although information from business liaison suggests there were larger increases in labour costs for some parts of the sector.
Intermediate input costs are typically around 40 per cent of total mining revenue. The main components are goods and materials, contractors, freight, motor vehicle running costs, rent and repairs. Like labour costs, annual intermediate input costs grew quickly over the period examined, rising by an average of 16 per cent a year, or by $21 billion in total, from 2003/04 to 2007/08. These cost increases partly reflected the significant equipment shortages and fuel price increases faced by the mining sector in recent years, which have also affected mining investment.[5]
Royalties and taxes
The significant increase in mining revenue and profits resulted in a rise in mining royalties and company income taxes, which both flow into government revenue. Collectively, these categories increased significantly from 2003/04, with royalties the larger of the two components (Graph 6). At a little over 1 per cent of GDP in 2005/06, royalties and company taxes paid by mining companies were at their highest level as a share of GDP since at least the late 1960s and are likely to have risen significantly further in the period through to 2007/08.[6]
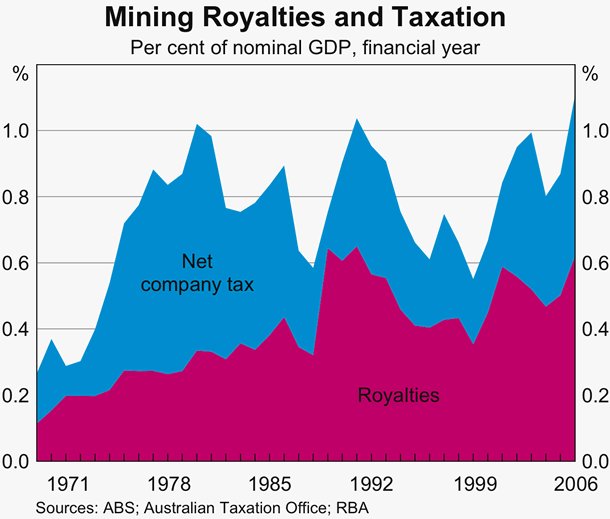
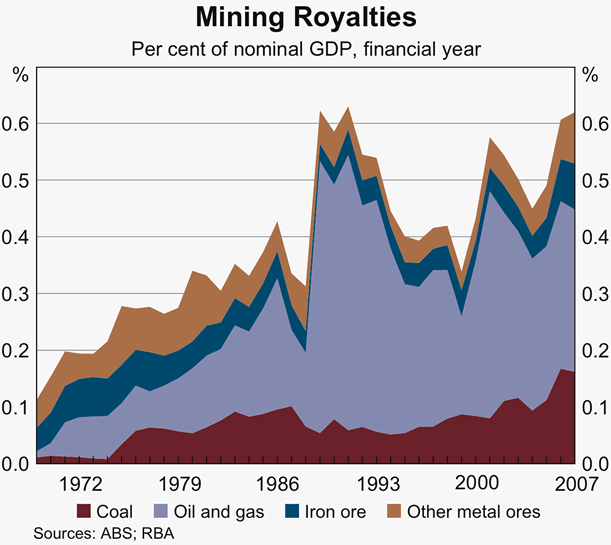
The large increase in royalties over time was mainly due to the introduction of the Petroleum Resource Rent Tax in the late 1980s (Graph 7). In recent years the composition of royalties has started to shift away from the oil and gas industry towards coal and iron ore, reflecting the exhaustion of Australia's oil reserve fields and the significant increases in prices and export volumes for bulk commodities.
After-tax profits and investment
Mining profits after the deduction of royalties and taxes grew at an average of around 25 per cent a year, rising from $20 billion in 2003/04 to an estimated level of approximately $50 billion in 2007/08. After-tax profits can be distributed to shareholders as dividends or retained within the company. Since the mining sector in Australia is majority foreign-owned, most dividends and retained earnings accrue to foreigners and therefore do not add to national income. However, as an alternative to debt financing, a considerable portion of these after-tax profits were used to fund mining investment projects, which stimulated the sectors of the economy that provided investment goods and services.
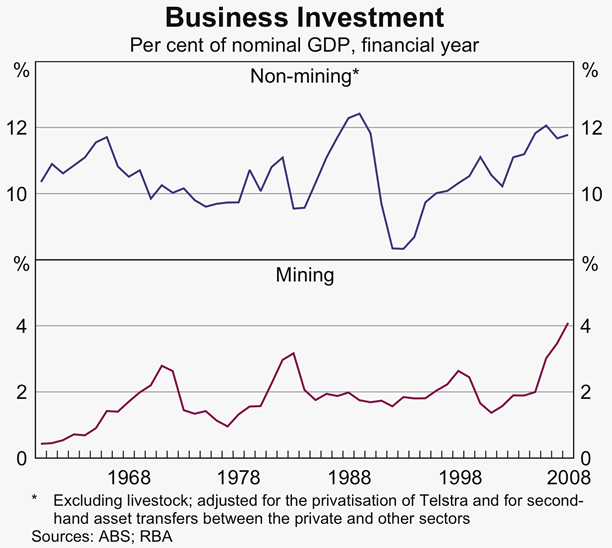
As can be seen from Table 1, over the four years to 2007/08 the level of mining investment increased by an average of around 30 per cent a year, or by $30 billion. Mining investment rose to its highest level as a share of the economy in at least a half century, and in 2007/08 comprised around one-quarter of all private business investment in the economy (Graph 8). This level of mining investment surpassed the previous booms in the early 1970s, early 1980s and mid 1990s. Most of this increase was spent on non-residential construction, which provided a considerable stimulus to the domestic economy; machinery and equipment spending of the mining sector (which is typically imported) did not rise as rapidly. Consistent with this, the value added of the construction sector rose from around 7 per cent of GDP in 2003/04 to 8 per cent in 2007/08.
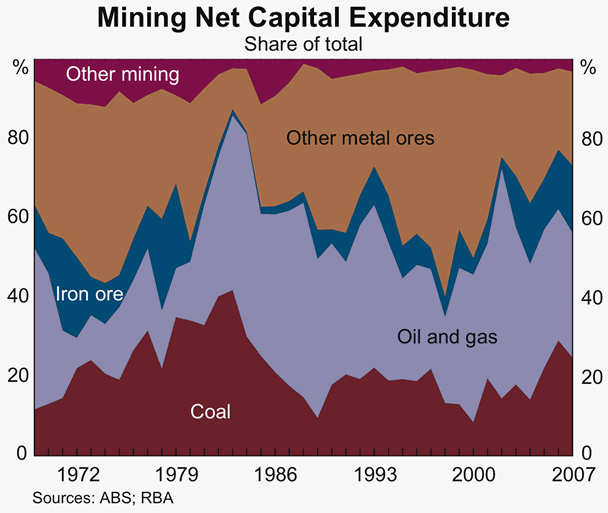
The composition of the investment boom by industry can be examined using data on net capital expenditure. The data indicate that the rapid increase in total mining investment in recent years was mainly due to capacity expansions in the coal and iron ore industries, along with several large natural gas projects (Graph 9).
Looking Ahead
The rapid rise in mining receipts over 2003/04 to 2007/08 provided a significant boost to the Australian economy, with the bulk of the increase in receipts used to pay for intermediate inputs and to fund investment. Looking forward, global demand for commodities has declined sharply in recent months, resulting in lower commodity prices and reduced export volumes. Spot coal and iron ore US dollar-denominated prices are now below the prices agreed under the 2008/09 contracts, mainly reflecting slowing global demand, particularly in the steel industry. The unwinding of much of the most recent price increases is expected to result in a scaling-back of mining investment, with a number of firms having announced reductions in their capital expenditure intentions for 2009. Other things equal, reduced spending by the mining sector, on both investment and inputs to production, would be expected to flow through to slower activity in other sectors of the economy. Nevertheless, given the earlier large run-ups in bulk commodity prices and the recent depreciation of the exchange rate, mining sector receipts in Australian dollar terms are likely to remain at comparatively high levels by historical standards.
Footnotes
This article was written by Ellis Connolly and David Orsmond of Economic Analysis Department. [1]
Mining revenue is defined as turnover plus the change in inventories. To minimise the double counting of the contribution of mining sector revenue to the economy, ‘services to mining’ have been excluded from our definition of the mining sector where possible. [2]
For more information on trends in production, see Topp V, L Soames, D Parham and H Bloch (2008), ‘Productivity in the Mining Industry: Measurement and Interpretation', Productivity Commission Staff Working Paper, December. [3]
For more details on recent trends in Australia's resource exports, see Andrews and Arculus (2008), ‘Australian Exports and Developing Asia’, RBA Bulletin, June, pp 1–11. [4]
To some extent, intermediate input costs reflect the cost of labour services (e.g., for contractors) and expenses that resemble investment. [5]
The ATO data on net company tax have yet to be published beyond 2005/06. [6]