Bulletin – January 2008 The Australian Foreign Exchange and Derivatives Markets[1]
- Download 61KB
Introduction
Activity in Australia's foreign exchange and derivatives markets has continued to increase at a rapid pace in recent years. The Bank for International Settlements (BIS) 2007 Triennial Survey of Foreign Exchange and Derivatives Market Activity[2] shows that total turnover in the Australian foreign exchange market was more than 65 per cent higher than in the previous survey in 2004. Growth was recorded across almost all instruments, counterparties and currencies.
In terms of global turnover, the AUD/USD is the fourth most traded currency pair and the Australian dollar is the sixth most traded currency. The Australian foreign exchange market is the seventh largest in the world.
The Australian Foreign Exchange Market[3]
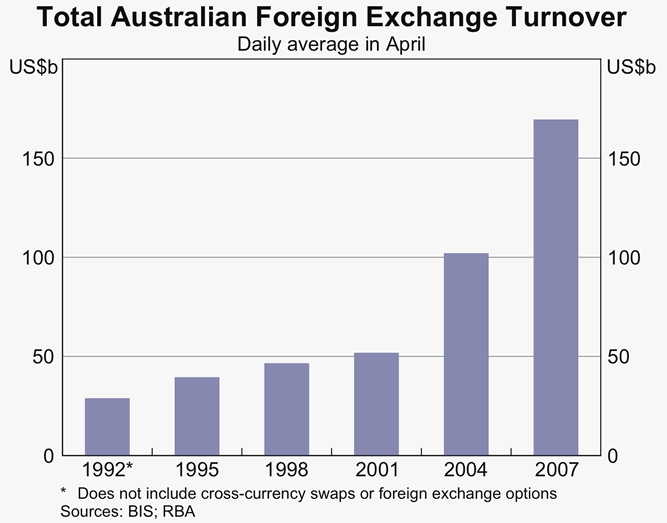
Foreign exchange turnover in all currencies in the Australian market averaged US$170 billion per day in April 2007, an increase of 66 per cent from the time of the previous BIS Triennial Survey conducted in April 2004 (Graph 1). Growth in global turnover over the same period was broadly similar to that in the Australian market, at 71 per cent.[4] Australia's market share of global turnover was 4.3 per cent in 2007, making it the seventh largest in the world (Table 1).

| 1992 | 1995 | 1998 | 2001 | 2004 | 2007 | |
|---|---|---|---|---|---|---|
| United Kingdom | 27.0 | 29.5 | 32.5 | 31.2 | 31.3 | 34.1 |
| United States | 15.5 | 15.5 | 17.9 | 15.7 | 19.2 | 16.6 |
| Switzerland | 6.1 | 5.5 | 4.2 | 4.4 | 3.3 | 6.1 |
| Japan | 11.2 | 10.2 | 6.9 | 9.1 | 8.3 | 6.0 |
| Singapore | 6.9 | 6.7 | 7.1 | 6.2 | 5.2 | 5.8 |
| Hong Kong | 5.6 | 5.7 | 4.0 | 4.1 | 4.2 | 4.4 |
| Australia | 2.7 | 2.5 | 2.4 | 3.2 | 4.2 | 4.3 |
| France | 3.1 | 3.7 | 3.7 | 3.0 | 2.6 | 3.0 |
| Germany | 5.1 | 4.8 | 4.8 | 5.5 | 4.9 | 2.5 |
| Denmark | 2.5 | 2.0 | 1.4 | 1.4 | 1.7 | 2.2 |
| Canada | 2.0 | 1.9 | 1.9 | 2.6 | 2.2 | 1.5 |
| Sweden | 2.0 | 1.3 | 0.8 | 1.5 | 1.3 | 1.1 |
| Netherlands | 1.9 | 1.7 | 2.1 | 1.9 | 2.0 | 0.6 |
|
(a) Turnover of spot, outright forwards and foreign exchange swaps (adjusted for local inter-dealer double-counting) Sources: BIS; RBA |
||||||
The AUD/USD is the most traded currency pair in the Australian market, accounting for 45 per cent of total foreign exchange turnover, a similar proportion to that recorded in the previous survey (Table 2). However, similar to trends seen in the global foreign exchange market, the dispersion of turnover by currency pair has increased since 2004. Australian turnover in the EUR/USD and USD/JPY was proportionately lower compared with three years earlier, but transactions in NZD/USD, USD/CHF and the ‘Other’ currency category (which predominantly involves Asian and other emerging-market currencies) increased noticeably as a proportion of total turnover.
| 1992 | 1995 | 1998 | 2001 | 2004 | 2007 | |
|---|---|---|---|---|---|---|
| AUD/USD | 40.3 | 42.0 | 48.2 | 49.4 | 44.7 | 45.2 |
| AUD/EUR | – | – | – | 0.5 | 1.0 | 1.3 |
| AUD/JPY | – | – | – | 0.8 | 1.0 | 1.0 |
| EUR/USD | – | – | – | 11.4 | 17.0 | 13.8 |
| USD/DEM | 20.7 | 21.7 | 13.5 | – | – | – |
| NZD/USD | 1.3 | 3.2 | 6.7 | 9.0 | 6.0 | 9.1 |
| USD/JPY | 17.8 | 13.3 | 16.0 | 14.0 | 12.7 | 8.0 |
| GBP/USD | 8.6 | 7.0 | 5.4 | 6.4 | 6.2 | 5.8 |
| USD/CHF | 2.5 | 2.6 | 0.9 | 1.2 | 1.3 | 3.7 |
| EUR/JPY | – | – | – | 0.6 | 1.1 | 1.0 |
| Other | 8.8 | 10.2 | 9.3 | 6.7 | 9.0 | 11.1 |
|
(a) From April 1998 turnover is adjusted for local inter-dealer double-counting. Prior to this, turnover is based on gross amounts. Sources: BIS; RBA |
||||||
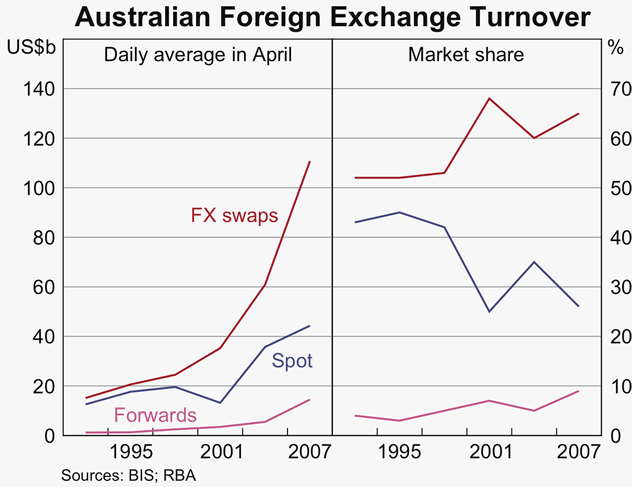
Turnover in all instruments increased in the Australian foreign exchange market (Graph 2). Transactions in the spot market grew by 24 per cent between 2004 and 2007, and accounted for 26 per cent of total turnover. Activity in the outright forwards market increased at a very rapid pace of 163 per cent, but was still a relatively small proportion of total turnover, at 9 per cent. Turnover in the foreign exchange swaps market rose by 82 per cent, and continued to account for the largest share of total turnover, at 65 per cent of the Australian market. Compared with the rest of the world, foreign exchange swaps in Australia represent a larger share of the market, with turnover in spot and outright forwards a correspondingly smaller share. This may reflect relatively greater hedging activity by Australian firms, particularly banks, which hedge 100 per cent of their offshore raisings.[5] Globally, foreign exchange swaps accounted for 56 per cent of turnover in 2007, with spot and outright forwards accounting for 33 per cent and 12 per cent respectively.

Over the late 1990s and early 2000s, consolidation in the Australian financial services industry and the corporate sector led to an increase in the degree of market concentration in segments of the foreign exchange market. However, the degree of concentration seems to have stabilised in recent years. At the time of the 2007 BIS survey, the top 10 foreign exchange dealers accounted for 91 per cent of total turnover in the spot market, 93 per cent of turnover in the outright forwards market, and 79 per cent of total turnover in the foreign exchange swaps market. This was broadly unchanged compared with three years earlier.
Factors Contributing to the Increase in Turnover
The growth of the Australian foreign exchange market is consistent with the global trends reported by the BIS.[6] A key driver has been the expansion of foreign exchange as an asset class in its own right. This has been reflected, for example, in rapid growth in funds under management by hedge funds and other leveraged investors, a significant portion of which have currency-related strategies. Strategies such as the carry trade, which uses leverage to exploit interest rate differentials and exchange rate trends, have earned high returns over recent years. With Australia maintaining positive interest rate differentials relative to most of the major economies over recent years, the Australian dollar has remained a prominent currency for carry trade activity. The attractiveness of yields in Australia has been reflected in the large net inflows into bank and money market instruments.
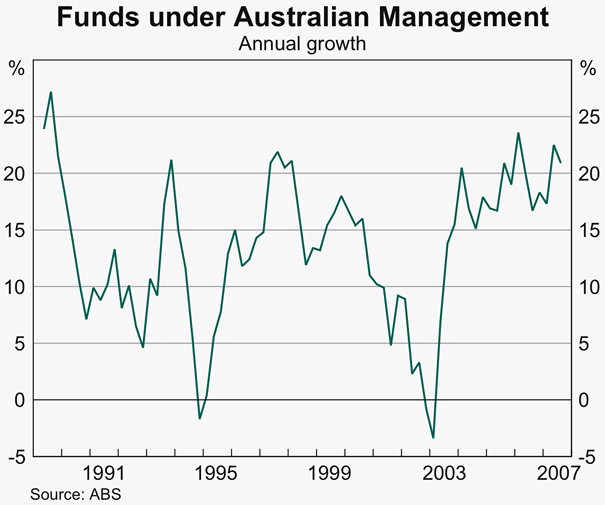
There has also been a global trend towards increased portfolio diversification among longer-term investors, such as pension and other managed funds, which has created direct and indirect demand for foreign exchange. Funds under management in Australia continue to grow strongly, and a significant proportion of these funds have been invested offshore (Graph 3).

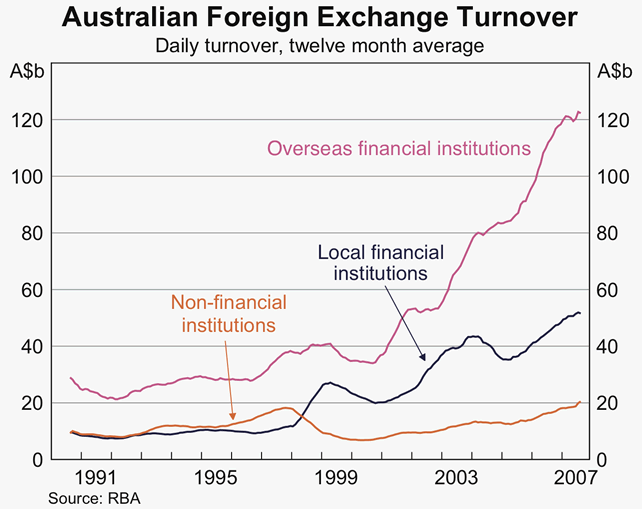
Consistent with these factors, transactions with overseas financial institutions continue to account for the largest share of turnover in the Australian market, at 62 per cent (Graph 4). Turnover between dealers and non-financial institutions almost doubled over the three years to 2007. This may be a result of increased hedging activity by large non-financial firms with significant foreign exchange exposures to manage. The increase was concentrated in the foreign exchange swaps market, with data from the RBA's monthly foreign exchange turnover survey showing a steady rise between 2004 and 2007.

The growth in electronic trading has also attracted a range of new participants to the foreign exchange market, from hedge funds to retail investors. In April 2007, around 30 per cent of all turnover in the Australian foreign exchange market was conducted through electronic broking systems or electronic trading systems.[7] Electronic trading has been a major driver of the growth in algorithmic trading by hedge funds and investment banks. This style of trading is designed to exploit high-frequency movements in exchange rate quotes that are available electronically, based on a set of pre-defined trading rules.
Valuation effects from a depreciation of the US dollar over the period also affected the reported expansion in the foreign exchange market, as the BIS survey is reported in US dollars while local data are collected in Australian dollar terms. At the time of the 2004 survey, the applicable exchange rate was just under US75 cents, rising to over US82 cents at the time of the 2007 survey, an appreciation of around 10 per cent over the period. Using a constant exchange rate, foreign exchange turnover in the Australian market increased by around 50 per cent.
The Australian Derivatives Market
The Australian OTC (over-the-counter) market[8] also expanded, with turnover averaging almost US$30 billion per day in April 2007, an increase of 68 per cent from the previous BIS survey (Table 3). Growth in global derivatives transactions was 66 per cent.
| 1995 | 1998 | 2001 | 2004 | 2007 | |
|---|---|---|---|---|---|
| Interest rate derivatives | |||||
| Forward rate agreements | 2.0 | 1.5 | 5.5 | 5.6 | 3.6 |
| Swaps | 0.5 | 1.3 | 4.0 | 6.7 | 17.8 |
| Options | 0.3 | 0.1 | 0.3 | 0.5 | 1.3 |
| Total | 2.8 | 2.8 | 9.8 | 12.8 | 22.7 |
| Foreign exchange derivatives | |||||
| Currency swaps | 0.3 | 0.4 | 0.5 | 1.2 | 2.1 |
| Options | 0.8 | 1.3 | 1.6 | 3.6 | 4.7 |
| Total | 1.0 | 1.7 | 2.1 | 4.9 | 6.8 |
| Total OTC derivatives | 3.8 | 4.6 | 12.0 | 17.6 | 29.5 |
|
(a) Totals may not sum due to rounding. Sources: BIS; RBA |
|||||
Transactions in interest rate derivatives, which account for the bulk of total derivatives turnover in Australia, averaged US$23 billion per day in April 2007, an increase of 77 per cent compared with three years earlier. Within this category, turnover in forward rate agreements (FRAs) fell by 36 per cent to US$3.6 billion in 2007, while single-currency interest rate swaps and OTC interest rate options rose by 166 per cent and 160 per cent respectively. FRAs account for 16 per cent of turnover in the Australian interest rate derivatives market, compared with 78 per cent for single-currency interest rate swaps and 6 per cent for OTC interest rate options.
In April 2007, the Australian dollar share of all interest rate derivatives transactions in the local market was 69 per cent, down from 83 per cent in 2004. The share of US dollar transactions also decreased to 4 per cent from 10 per cent previously. On the other hand, the New Zealand dollar share of transactions rose to 23 per cent from 5 per cent previously, in part reflecting the broader increase in global demand for assets denominated in high-yielding currencies.
Foreign exchange derivatives (options and cross-currency swaps) turnover increased by 39 per cent to US$7 billion in 2007. The US dollar remained the dominant currency in the Australian foreign exchange derivatives market, on one side of over 80 per cent of transactions. The AUD/USD accounted for over half of all transactions.
The Australian OTC derivatives market continues to become more integrated with global financial markets. Turnover between dealers and overseas financial institutions rose by 86 per cent over the three years to April 2007, accounting for 69 per cent of total turnover compared with 63 per cent in April 2004. Turnover with non-financial institutions almost doubled over the past three years, but remains a relatively small proportion of the total, at 13 per cent. Turnover with local financial institutions rose by 5 per cent, which saw the share of total turnover drop to 18 per cent compared with 28 per cent three years earlier.
Global Trade in the Australian Dollar
The US dollar remained the world's most traded currency in April 2007, though the dispersion of foreign exchange turnover by currency has increased. The share of turnover involving the four most traded currencies – the US dollar, the euro, the yen and the pound sterling – decreased by 8.3 percentage points since 2004.
Global turnover involving the Australian dollar averaged US$215 billion per day in April 2007, more than double that from the previous BIS survey.[9] The Australian dollar was on one side of 6.7 per cent of all global transactions in the traditional foreign exchange market in April 2007, making it the sixth most traded currency.
The AUD/USD remains the fourth most traded currency pair (Table 4). Around 60 per cent of global trade in the Australian dollar occurred outside the Australian market in 2007, a similar proportion as in 2004.
| 1992 | 1995 | 1998 | 2001 | 2004 | 2007 | |
|---|---|---|---|---|---|---|
| EUR/USD | – | – | – | 30 | 28 | 27 |
| USD/DEM | 25 | 22 | 20 | – | – | – |
| USD/FRF | 2 | 4 | 4 | – | – | – |
| USD/JPY | 20 | 21 | 18 | 20 | 17 | 13 |
| GBP/USD | 10 | 7 | 8 | 11 | 14 | 12 |
| AUD/USD | 2 | 3 | 3 | 4 | 5 | 6 |
| USD/CHF | 6 | 5 | 5 | 5 | 4 | 5 |
| CAD/USD | 3 | 3 | 3 | 4 | 4 | 4 |
| USD/SEK | – | – | – | – | – | 2 |
| USD/Other | – | 17 | 25 | 17 | 16 | 19 |
| EUR/JPY | – | – | – | 3 | 3 | 2 |
| EUR/GBP | – | – | – | 2 | 2 | 2 |
| EUR/CHF | – | – | – | 1 | 1 | 2 |
| Other | 32 | 18 | 14 | 3 | 6 | 6 |
|
(a) Adjusted for local and cross-border inter-dealer double-counting Source: BIS |
||||||
Footnotes
This article was prepared by Natasha Cassidy, Kristina Clifton, Michael Plumb and Benn Robertson of International Department. [1]
The most recent BIS survey was conducted in April 2007, with the final global results released in December 2007 (<http://www.bis.org/triennial.htm>). [2]
This section discusses turnover in ‘traditional’ foreign exchange instruments, namely spot, outright forwards and foreign exchange swaps transactions. See below for a discussion of the Australian derivatives market. [3]
Adjusted for both local and cross-border inter-dealer double-counting. [4]
See RBA (2005), ‘Australia's Foreign Currency Exposures and Hedging Practices’, RBA Bulletin, December, pp 1–8. [5]
See G Galati and A Heath (2007), ‘What Drives the Growth in FX Activity? Interpreting the 2007 Triennial Survey’, BIS Quarterly Review, December, pp 63–72 (<http://www.bis.org/publ/qtrpdf/r_qt0712.htm>). [6]
Electronic broking systems include all trades that are executed via automated order matching systems for foreign exchange dealers (e.g. EBS, Reuters Matching 2000/2). Electronic trading systems include all trades executed via a single-bank proprietary platform or multi-bank dealing system (e.g. FXAII, Currenex, FXConnect, Globalink, eSpeed). [7]
This includes turnover in OTC foreign exchange options and cross-currency interest rate swaps, as well as single-currency interest rate derivatives. [8]
The BIS made changes to the reporting template for the Triennial Survey, to include a more comprehensive breakdown of currencies. This is estimated to have increased turnover in the Australian dollar by around 6 per cent. [9]