Bulletin – March 2003 Household Debt: What the Data Show
- Download 83KB
Over the past decade, the debt of the household sector has increased at an average annual rate of 14 per cent, which is well in excess of the growth of household income. As a result, the ratio of household debt to household disposable income in Australia has risen from a level that was low by international standards to one that is in the upper end of the range of other industrial countries.
This has attracted a good deal of attention and has raised questions about why this trend has occurred and whether it will continue. The answers to these questions are not obvious and require further disaggregation of the data and comparison with other financial ratios both here and abroad. The remainder of this article attempts to do this by looking at such subjects as: what sort of debt is it; who holds it; what has happened in other countries; and what has been the influence of broad economic variables such as the rate of interest and the rate of inflation.
The Composition of Household Debt
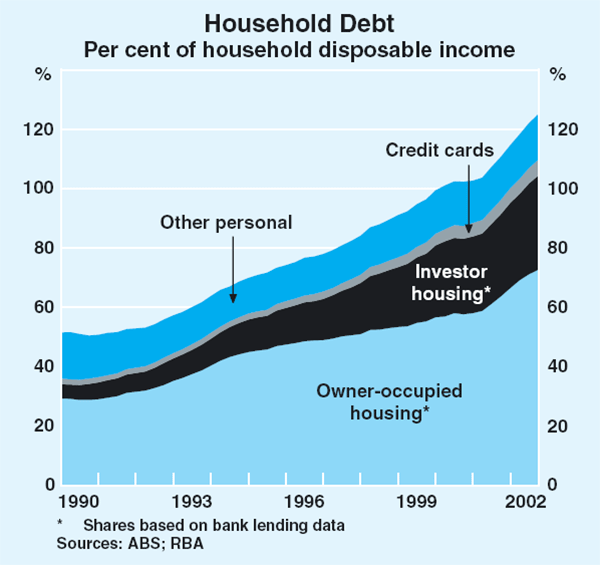
The household debt to income ratio has risen from 56 per cent to 125 per cent over the decade to end 2002. Graph 1 shows a decomposition of this debt into four categories. It is clear from this and the accompanying table that housing debt makes up the major part of household debt. In the December quarter 2002, housing debt accounted for 83½ per cent of total household debt, and this percentage had risen slightly over the decade. Within housing debt, borrowing for owner-occupation was the largest part, but borrowing for investment purposes was the fastest growing (its share of housing debt had risen from 18 per cent in 1992 to 30 per cent in 2002).[1]
| Share of total | Average annual growth Per cent | |||
|---|---|---|---|---|
| Per cent | Past decade | Past 5 years | ||
| Housing(a) | 83.5 | 15.3 | 15.4 | |
| – Owner-occupier | 58.1 | 13.4 | 13.4 | |
| – Investor | 25.4 | 21.6 | 20.7 | |
| Personal | 16.5 | 8.8 | 11.6 | |
| – Credit cards | 4.2 | 17.4 | 20.9 | |
| – Other | 12.3 | 7.0 | 9.3 | |
| Total | 100.0 | 13.9 | 14.7 | |
|
(a) Shares based on bank lending data Sources: ABS; RBA |
||||
Of the 16½ per cent of household debt that was not housing debt, the major item was personal loans to buy cars and other durables. The other item of interest is credit card debt, which grew very rapidly over the decade, particularly the most recent five years, but is still small in absolute terms, accounting for only 4 per cent of household debt.
Why has Household Debt Grown?
(i) Lower interest rates
The principal reason that household debt has grown is that with low interest rates, households can now borrow more when they take out their housing loan. This pushes up the average size of new loans, and in time, pushes up the average size of loans outstanding. The average size of a new loan for owner-occupation has increased from around $82,000 in 1992 to around $175,000 currently.
Housing lenders apply an income test to determine the size of the loan a borrower can obtain. The income test typically requires that the required repayments on the loan not exceed a specified percentage of income (say, 30 per cent of income). It follows that if the interest rate is halved, then the amount a household can borrow and still face the same servicing cost increases markedly; in fact, it nearly doubles.[2] At a first approximation, this is what happened in Australia between the 1980s and the 1990s: in the second half of the 1980s mortgage interest rates averaged 15 per cent, over the past five years they averaged 7 per cent.
(ii) Lower inflation
In examining the rise in the debt to income ratio, a second explanation is also important. The fall in the interest rate was only possible because there had been a significant fall in the rate of inflation of both prices and incomes, which itself exerted an influence on the debt to income ratio independent of the interest rate effect described above. An individual borrower will typically have a declining ratio of debt to income during the life of the loan, as the ratio is reduced by the combination of principal repayments and nominal income growth. In a low inflation environment, nominal income growth will erode the real value of the debt less rapidly than in a high inflation one. In earlier decades, borrowers could rely on inflation to reduce the burden of their debt relative to their income. Now this process happens more slowly, so that at any point in time – say, 10 years after the loan was originally taken out – the ratio will be higher relative to its initial value than in earlier decades. As a result, the average debt to income ratio across all borrowers will be higher.
The sum of the lower interest rate effect and the lower inflation effect, when they fully work their way through the system, could explain an approximate doubling of the aggregate debt to income ratio. That is, even with no relaxation of credit standards by lending institutions, macroeconomic developments could explain why households now have more debt than formerly, and why lending institutions are happy to provide it. A more formal enumeration of this process is given in the appendix to this article. The corollary of this is that, with most of this increased debt being directed towards the purchase of housing, housing prices have risen as the greater availability of debt became capitalised into their price.
(iii) Financial deregulation
Financial deregulation and the accompanying increase in competition among financial intermediaries has contributed to the increase in household debt in several ways.
First, increased competition, much of it provided by mortgage originators, has pushed down the lending margins of financial intermediaries and so provided an additional reduction in mortgage interest rates on top of the reduction provided by the fall in short-term interest rates throughout the economy. This has been a significant factor: of the 8 percentage point reduction in the average mortgage rate between the second half of the 1980s and the past five years, about 2 percentage points can be attributed to the lower lending margins and 6 percentage points to the lower structure of short-term interest rates.
Secondly, deregulation and increased competition have led to financial intermediaries actively chasing the housing borrower and removing many of the quasi-rationing restrictions that were formerly common. An important aspect of this has been the decision by major lenders to encourage lending for investment purposes, by providing loans on equally favourable terms to those enjoyed by owner-occupiers and permitting the consolidation of owner-occupied and investment properties into the one mortgage.[3]
Thirdly, the development of new products, particularly home-equity loans and mortgages with a redraw facility, has enabled borrowers to add to their mortgage over time, rather than to pay it off progressively as in traditional mortgages. These relatively recent developments provide a means for households to gain spending power by accessing the equity in their homes. If the proceeds are spent on non-housing purposes, this process is known as housing equity withdrawal.[4] If it is spent on housing alterations and additions, it is just normal debt-financed housing investment. But either way, it results in households adding to their debt, rather than allowing the debt to decline over time through principal repayment.
The Household Balance Sheet
Graph 2 presents a comparison of household debt to income ratios for eight developed countries. The most obvious feature is that the ratio exhibits an upward trend in all countries with the possible exception of France. In Australia's case the rise in the ratio occurred later than in the other countries, but so did the fall in inflation and interest rates. At its current level, the debt to income ratio in Australia is in the upper end of the range. It is exceeded by Japan and the Netherlands, is similar to the UK and slightly higher than Canada and the US. The Netherlands stands out for the high level of its ratio, which is due, amongst other things, to the tax deductibility of mortgage interest payments there and the prevalence of interest-only loans. To minimise their tax payments, households in the Netherlands have tended to refrain from principal repayments over the life of the loan and instead use the funds to accumulate other assets.
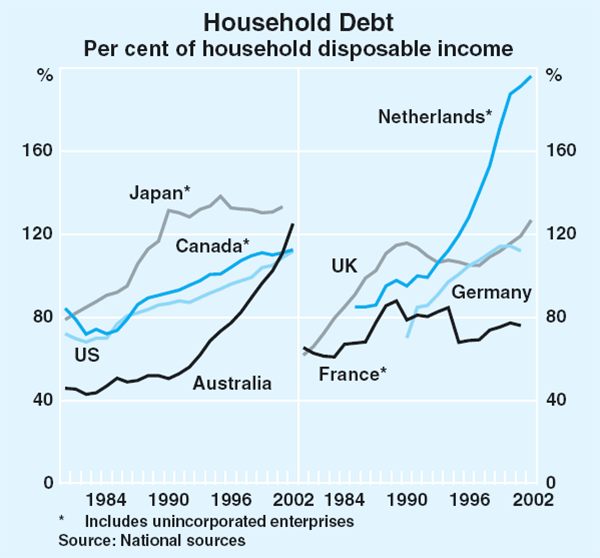
Many financial analysts would take issue with the use of the ratio of household debt to income as an analytical device because it compares a stock (debt) to a flow (income). A more conventional approach would be to either construct a gearing ratio which compares the stock of debt to the stock of assets it supports, or construct a concept such as ‘interest cover’ which compares the flow of interest payments to the flow of income from which it must be paid.
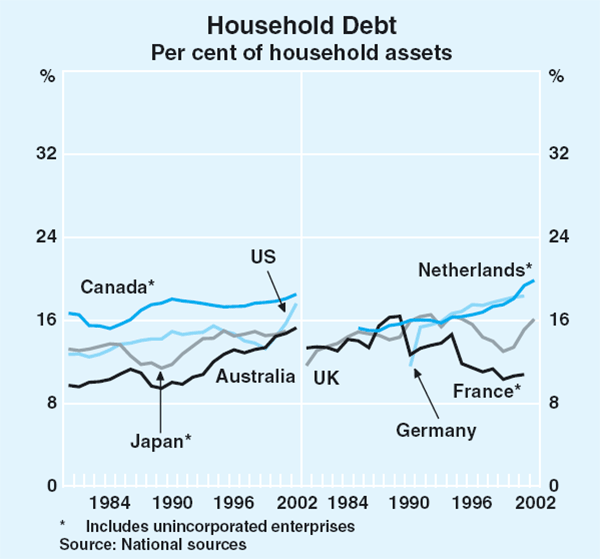
Looking first at the gearing ratio (Graph 3), it is clear that in Australia this has increased proportionately much less than the debt to income ratio, rising from about 10 per cent in 1980 to 15 per cent at present. The main reason for the lesser rise is that the price of the assets (houses) also rose strongly over the period. The international comparison shows a mild upward trend for most countries, and shows that the gearing ratio in Australia is in the lower half of the countries covered.
The second concept – ‘interest cover’ – shows that the interest paid on household debt at present is around its average level of the past 25 years, but lower than that in the late 1980s/early 1990s (Graph 4). What this means is that over the past decade, the fall in nominal interest rates has more than offset the rapid rise in debt.[5]
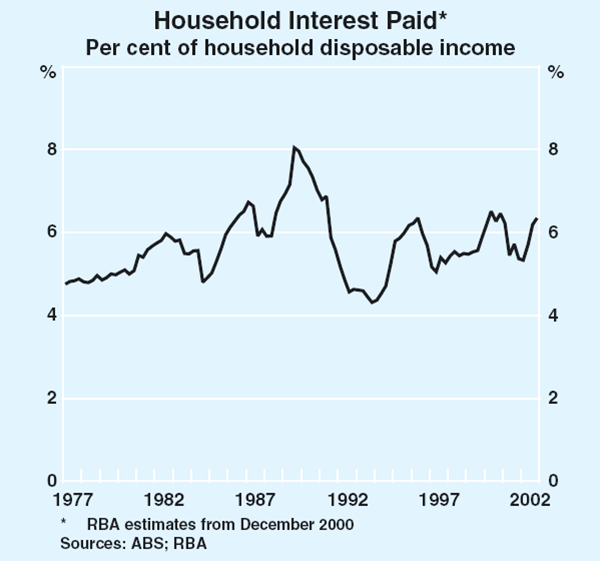
This measure does not include required principal repayments on the loan. While data on total required repayments are unavailable, liaison with banks suggests that required principal repayments probably amount to an additional 2–3 per cent of household income. A number of households also make discretionary excess principal repayments. This is particularly prevalent in a period of falling interest rates as borrowers tend to maintain their scheduled repayments constant, thereby increasing their principal repayments as the required interest payments decline. In Australia, this practice is widespread given the predominance of variable-rate mortgages.
The Distribution of Debt Across Households
The Census contains questions about home ownership and debt which reveal some interesting findings. According to the 2001 Census, 43.0 per cent of Australian households own their home outright; that is, they have paid off their mortgage. A further 28.4 per cent live in rental accommodation, and so they also do not have a mortgage on their home. The remainder – 28.6 per cent – own their own home, but are still paying off the mortgage. It is this last group which has accounted for the growth of owner-occupied housing debt and, by extension, for much of the growth of total household debt.[6]
Another interesting finding is that these shares are almost identical to those recorded in the 1991 Census where 43.0 per cent of households owned their houses outright, 28.5 per cent rented, and 28.5 per cent had a mortgage. Thus, owner-occupied housing debt is concentrated in less than a third of Australian households and this degree of concentration has not materially changed over the past decade. Another way of expressing this is to say that the rise in housing debt is not due to a higher proportion of households acquiring debt, but is primarily due to an increase in the average level of debt per debtor household.
At first glance, this seems surprising because lower interest rates and the chance to borrow larger sums of money might have been expected to open up the opportunity for lower-income households to become owner-occupiers. But this result would only occur if housing prices did not rise commensurately with the increased borrowing capacity. The stability of the aggregate home-ownership rate suggests that the increased availability of credit was largely capitalised into housing prices rather than generating a wider spread of owner-occupation.
Unfortunately, the Census data and the two household surveys discussed below do not provide information on borrowing to purchase an investment property. As a result, there are virtually no official data on the distribution among households of borrowing for investor housing, which is the fastest growing category of household borrowing. Historically, the promotion of home ownership was a widely accepted goal of social policy in Australia, and the statistical collections reflect this priority.[7] Thus, the results presented in this section are subject to the caveat that they do not cover nearly a third of borrowing for housing.
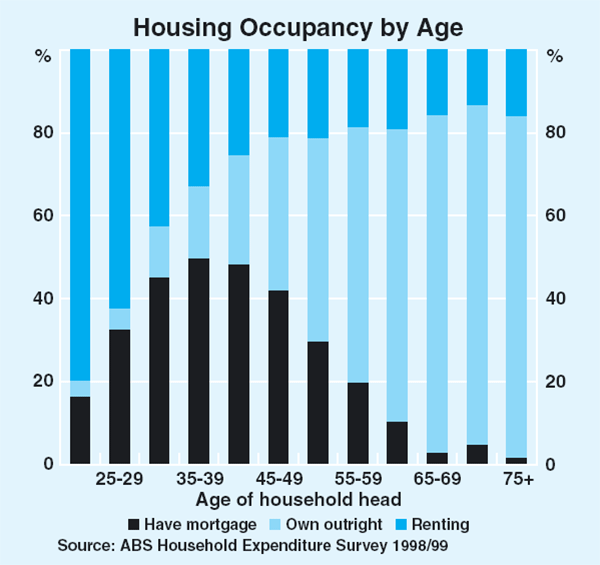
The ABS Household Expenditure Surveys (HES) and the Household Income and Labour Dynamics in Australia (HILDA) Survey provide more detailed information about the distribution of debt across households. The 1998/99 HES shows how home ownership changes during the life cycle (Graph 5). Young households typically have a low level of home ownership and predominantly live in rental accommodation. As people acquire housing, the proportion of households with a mortgage rises sharply and peaks in the 35–39 year age bracket. It then declines to nearly zero by age 65. The share of households owning their home outright also gradually increases such that by retirement, nearly all home owners own their home outright.
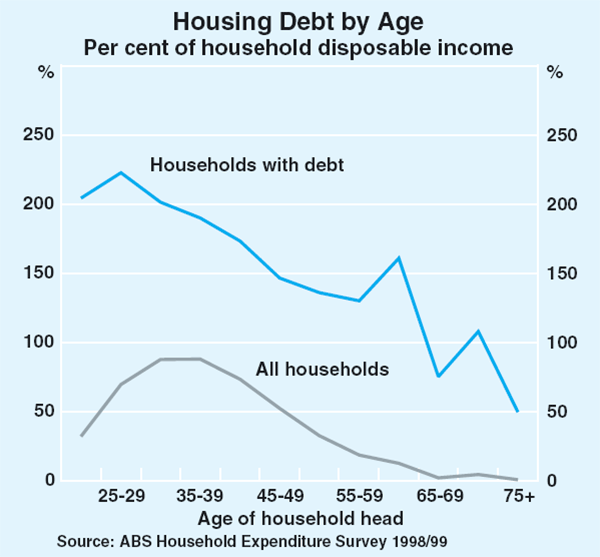
This pattern of home ownership is reflected in the hump-shaped distribution of the value of housing debt across households of different ages (Graph 6). Younger households have a low level of housing debt relative to income, although those younger households that do hold debt tend to have high debt to income ratios, reflecting the recent purchase of their first home. As the home ownership rate rises with age, the debt to income ratio also rises, peaking in the 35–39 age group. But, over time, the repayment of the debt gradually begins to dominate the increase in home ownership and debt to income ratios decline as the age of the household increases. The repayment of the mortgage principal across the life cycle is also reflected in the downward-sloping line showing debt to income ratios of only those households with debt.
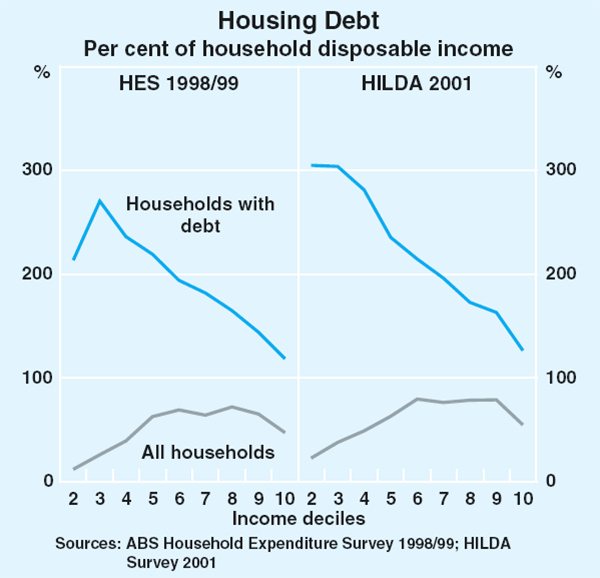
The distribution of debt by household income shows a similar pattern, reflecting the evolution of income across the life cycle (Graph 7).[8] Debt to income ratios gradually rise along with income, reflecting a disproportionately large number of younger households (who have not yet purchased a house) and pensioners (who have already paid off their mortgage) in the lower income deciles. However, amongst only those households with a mortgage, debt to income ratios decline as incomes rise. This reflects the fact that households with higher incomes tend to be older households and hence are further advanced in the repayment of the mortgage. While the results from the HILDA survey are not directly comparable to the HES, they suggest that debt levels have increased at all points across the income distribution between 1998/99 and 2001.
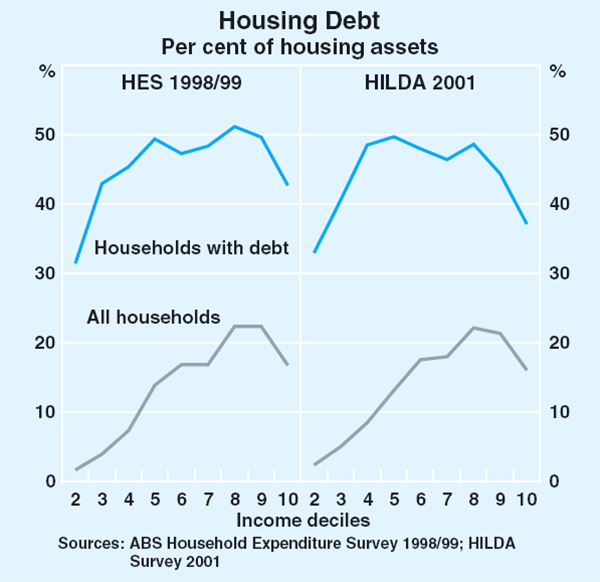
Another perspective on the distribution of debt across households can be obtained by examining household gearing ratios (Graph 8), that is, the ratio of the value of debt to the value of assets for each household. Housing debt as a share of the value of housing assets tends to be highest around the 8th decile of the income distribution. If one only includes those households with a mortgage, the ratio of debt to assets is relatively flat across the income distribution. The 1998/99 HES and the 2001 HILDA survey provide a similar picture in this regard, suggesting that, for each decile, the increase in debt between these two periods was broadly matched by the increase in the value of the housing stock.
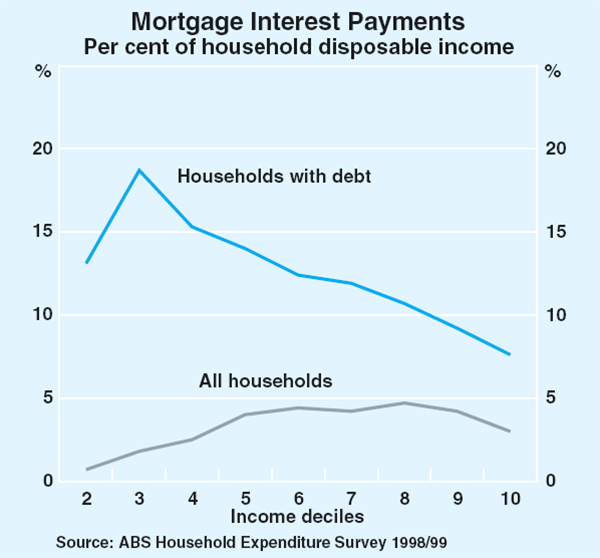
Turning to the distribution of interest cover across households, not surprisingly the profile mimics the distribution of debt by income (Graph 9), given that the bulk of households pay a similar mortgage rate. For all households, interest payments as a share of income rise gradually with income, reflecting the greater tendency to borrow amongst higher-income households. However, for those households with debt, interest payments decline as income increases.
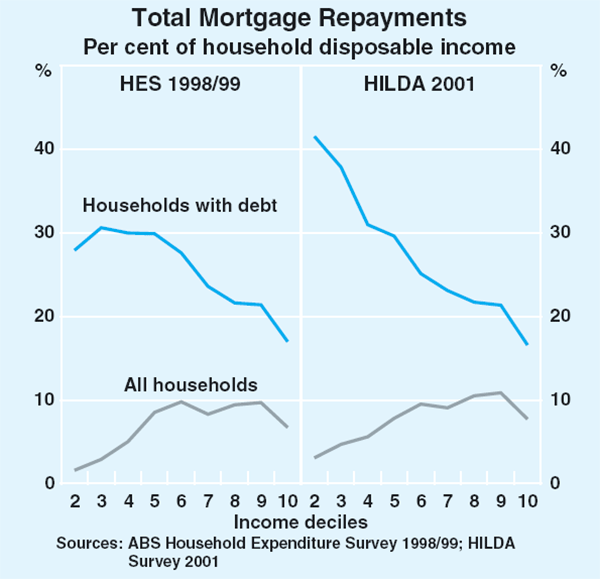
In terms of total mortgage repayments (Graph 10), both the 1998/99 HES and the 2001 HILDA survey indicate a similar profile (the HILDA survey does not separately identify interest and principal repayments). However, in the HILDA survey the level of repayments is higher at nearly every point in the income distribution, especially for those households with lower incomes, despite the level of interest rates being similar in the two periods. This reflects the fact that while debt has grown in line with housing prices (so that household gearing shown in Graph 8 has changed little between the two surveys), both debt and housing prices have grown at a faster pace than income.
As mentioned earlier, neither survey provides information about the distribution of borrowing for investor housing across households. The only information available on this subject comes from data from the Australian Taxation Office (ATO). The most recent data from the ATO show that 12½ per cent of individuals received rental income in 1999/2000, compared with 10¼ per cent in 1993/94. This would suggest that there has been an increase in the share of individuals purchasing housing for investment purposes.
The share of individuals receiving rent increases with income, rising from 9 per cent of individuals with taxable income of $20,700 or less (some of whom are likely to be retirees) to 30 per cent of those with a taxable income exceeding $100,000. The ATO data show that nearly three-quarters of those with rental income claimed interest deductions, indicating that at least this share of investors had an outstanding loan on their investment property. The tendency to claim an interest deduction was prevalent across the income distribution but tended to increase with income, as did the average size of the interest deduction, suggesting that individuals with higher incomes tended to have a larger loan on their investment property.
Conclusion
Borrowing by Australian households has expanded rapidly over the past decade, rising at an annual rate of around 14 per cent, and more than doubling as a ratio to household income. The increase is nearly all accounted for by borrowing for housing. Borrowing for owner-occupation is still the largest component of this, though the fastest growing has been borrowing for investment purposes.
In international terms the Australian household sector is by no means unique in expanding its debt more quickly than the growth in incomes. The same has occurred in most industrial countries over the past couple of decades, though in Australia the increase has been relatively rapid and occurred more recently. In broad terms the debt to income ratio of Australian households is now around the upper end of the range among industrial countries, whereas it had been well below average in the 1980s.
Most of the rise in Australia's household debt in the period since the 1980s can be explained by the shift to an environment of lower interest rates and lower inflation. These two macroeconomic developments have had the effect of increasing the size of a standard loan available to mortgage borrowers and reducing the speed with which inflation erodes the real value of the debt. Both factors have contributed to a higher average ratio of debt to income than was previously the case. An additional factor has been the effect of financial deregulation and increased competition, which has made housing credit cheaper and easier to access.
| Non- taxable |
$20,700 or less |
$20,701 –29,999 |
$30,000 –49,999 |
$50,000 –99,999 |
$100,000 and greater |
Total | |
|---|---|---|---|---|---|---|---|
| Receiving rent | 9 | 9 | 10 | 14 | 22 | 30 | 13 |
| Deducting interest from rent | 5 | 5 | 7 | 11 | 18 | 23 | 9 |
| Share of those receiving rent that deducted interest |
58 | 60 | 72 | 80 | 82 | 76 | 73 |
|
Source: Australian Taxation Office |
|||||||
While there has been a substantial increase in the aggregate debt of the household sector, there is still a wide disparity among households in the use of credit, with only about 30 per cent of households at any given time having a mortgage. This ratio has not changed noticeably since the 1980s. Hence the large rise in the availability of housing credit has not resulted in a larger proportion of households obtaining housing credit, but instead shows up in a stable proportion obtaining a much higher level of credit per household.
Despite the strong rise in the aggregate ratio of debt to income, other measures of the household balance sheet have shown less pronounced changes over the past decade. Household gearing ratios have increased but are still not high in comparison with those in other countries. Household interest payments as a proportion of income remain below the peak levels seen in the 1980s, though they have trended upwards in recent years.
Appendix: The Effect of Lower Interest Rates and Lower Inflation on the Aggregate Debt to Income Ratio
As outlined in the body of this article, the shift to a low interest rate/low inflation environment can explain a significant part of the rise in the aggregate housing debt to income ratio, firstly by allowing individual households to borrow more and secondly because slower nominal income growth erodes the real value of debt more slowly. This appendix provides a guide to the approximate magnitude of these influences.
Individual household
A traditional benchmark used by banks in deciding how much to lend to customers is that the required repayment should not exceed 30 per cent of gross income. Using this benchmark (or any other constant benchmark) means the maximum amount intermediaries will lend increases as interest rates decline. Nominal mortgage interest rates averaged 15 per cent in the second half of the 1980s but have declined to an average of 7 per cent over the past five years, as a result of lower inflation and a compression in lending margins. A comparison of the first points in the two panels of Graph A1 shows that a reduction in nominal mortgage interest rates of this magnitude can increase the ratio of initial debt to initial income for an individual household from around 2.1 to around 3.6.
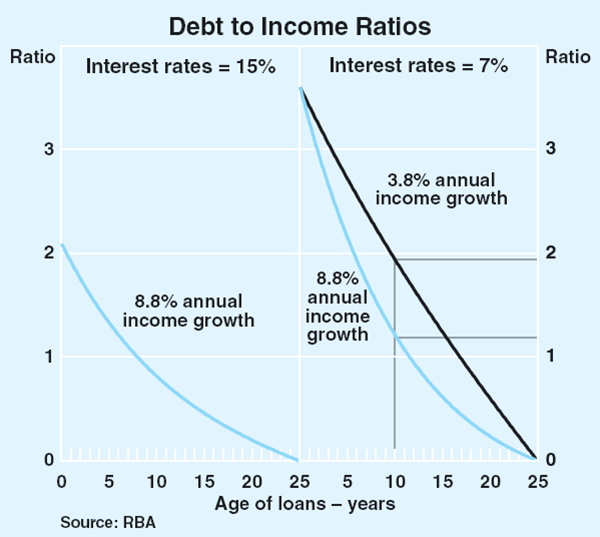
Although interest rates fall by more than half in this example, the maximum allowable loan does not double in size. This is because the total repayment on which the benchmark lending criterion depends includes a component of principal repayment, which does not vary proportionately with the interest rate.
The effect of lower nominal income growth on housing debt to income ratios is evident in the second panel. Nominal income growth per household has declined from just under 9 per cent in the second half of the 1980s to just under 4 per cent currently. This slower income growth implies that the debt to income ratio will be higher for the life of the loan than would be the case if income growth were higher. This is shown by the move to the higher of the two downward-sloping lines in panel 2. For example after 10 years, the debt to income ratio would be 1.9 on the low-income growth path and 1.2 on the high-income growth path.
Household sector
To determine the effect of these changes on the aggregate debt to income ratio, the individual profiles shown in Graph A1 must be aggregated across households with loans of different ages. This allows a comparison to be made between debt to income ratios for the whole household sector that are consistent with the averages for nominal income growth and interest rates observed in the late 1980s and those observed in recent years.
A number of assumptions have been made in order to focus on the effects of the falls in interest rates and inflation, without changes in other factors complicating the comparison. Households that have paid off their mortgage completely or that do not own their homes, and thus have no housing debt, have been excluded from the calculation of aggregate income.
This exercise assumes that the population is evenly spread across age groups in the long run and that the income distribution does not change. It is also assumed that households do not change their repayment patterns, make excess repayments of principal, or refinance their loans later in life. Thus the only feature of loan contracts that changes between the two examples is the interest rate. Financial intermediaries are assumed to offer only a 25-year fixed-term mortgage, and apply the same lending standards based on the benchmark ratio of repayments to income in both cases.
The combined effect of the shift to the low inflation/low interest rate environment would roughly generate a doubling in the aggregate ratio of housing debt to income, if all borrowers continued to borrow the maximum amount consistent with an initial repayment of 30 per cent of income. Table A1 shows the debt to income ratio that would result from various combinations of interest rates and rates of growth of nominal income. The element in the top left-hand corner (approximately representing the conditions of the second half of the 1980s) has been standardised to 1, and each combination of lower interest rates and/or lower rate of growth of nominal income is a multiple thereof. The figure of 2.15 (in bold) represents the multiple applicable to the past five years.
| Nominal income growth (per cent) | |||||
|---|---|---|---|---|---|
| Interest rates (per cent) | 9 | 7 | 5 | 4 | 3 |
| 15 | 1 | 1.14 | 1.32 | 1.42 | 1.55 |
| 13 | 1.10 | 1.25 | 1.44 | 1.56 | 1.69 |
| 11 | 1.22 | 1.38 | 1.59 | 1.71 | 1.86 |
| 9 | 1.37 | 1.55 | 1.77 | 1.91 | 2.06 |
| 7 | 1.56 | 1.75 | 2.00 | 2.15 | 2.32 |
| 5 | 1.80 | 2.02 | 2.29 | 2.45 | 2.64 |
Any transition from one configuration of average inflation and interest rates to another will take a number of years to have its full effect on the aggregate debt to income ratio. Over time, the initially smaller loans taken out when interest rates were higher will be fully paid out, and replaced in the stock of outstanding debt by loans taken out since interest rates fell. The table presented here is a comparative statics analysis showing the result after all the lags had worked their way out.
Footnotes
While most of the increase in housing borrowing has been for that purpose, it is likely that some of the rise has been for consumption and other purposes. Financial institutions are required to classify their loans according to purpose, but the increased use of products such as home-equity loans and redraw facilities has made it more difficult to determine the end use of the borrowed funds. [1]
Most mortgages in Australia are credit foncier loans. With this type of loan, the increase in loan size when interest rates halve is less than a doubling because the total repayment per period includes the repayment of principal which does not vary proportionately with the interest rate. [2]
See ‘Innovations in the Provision of Finance for Investor Housing’, Reserve Bank of Australia Bulletin, December 2002, pp 1–5. [3]
See ‘Housing Equity Withdrawal’, Reserve Bank of Australia Bulletin, February 2003, pp 50–54. [4]
These numbers are net of the amount of the interest charge that the Statistician estimates as representing payment for financial services (FISIM). Including this estimate increases household interest paid throughout the history of this series, and by an average of 1 percentage point of disposable income over the past five years. [5]
The aggregate rate of home ownership of 71½ per cent in Australia compares to 69½ per cent in the UK, 67½ per cent in the US and 64 per cent in Canada. [6]
The 2002 wave of the HILDA survey contains information on households' ownership of investment properties and borrowings for this purpose. These data are expected to be released later this year. [7]
Outcomes for the lowest decile of the income distribution are excluded because of substantial misreporting of incomes at low levels. [8]