Bulletin – June 2002 Overnight Indexed Swap Rates
- Download 63KB
Overnight indexed swaps are a form of bilaterally traded, or over-the-counter (OTC), derivative in which one party agrees to pay the other party a fixed interest rate in exchange for receiving the average cash rate recorded over the term of the swap. In this respect, overnight indexed swaps are similar to other forms of fixed-to-floating rate swaps. Their two distinguishing features compared with other such swaps are that they are for relatively short terms (generally only out to one year) and the benchmark for the floating rate is the overnight cash rate rather than the 90-day bank bill rate which is typically used in other fixed-to-floating swaps in Australia.
Financial institutions enter into overnight indexed swaps to manage their exposures to movements in the cash rate. For example, a bank that had relatively strong expectations that the cash rate was going to rise would seek to pay the fixed rate and receive the actual cash rate over the period of the swap, while a bank that had relatively little expectation of a rise in the cash rate would seek to do the reverse.
The market for overnight indexed swaps has grown rapidly in Australia since it began in late 1999. Daily turnover was about $2 billion in 2000/01. This compares with turnover of about $34 billion a day in bank bill futures contracts and $6 billion a day in physical bank bills, the other main ways in which institutions can take views on movements in short-term interest rates. The main participants in the overnight interest rate swaps market are banks, reflecting the relatively specialised nature of the market.
The terms to maturity for overnight indexed swaps typically are between one week to one year, with the bulk of the trading concentrated in relatively short maturities. For example, 50 per cent of daily turnover is in maturities out to three months.
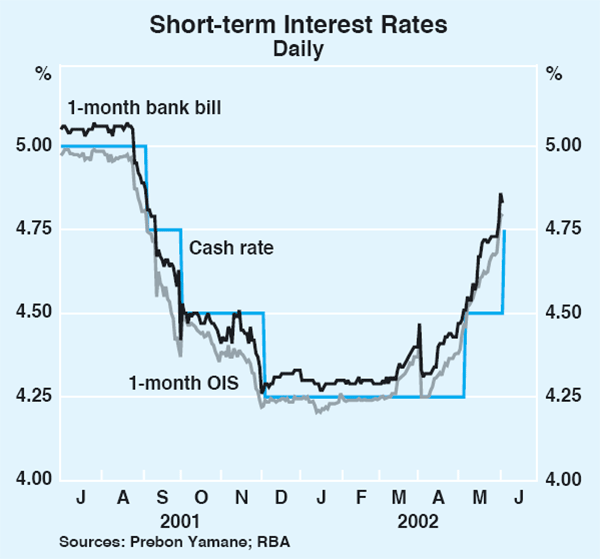
Overnight indexed swaps carry very little credit risk as there is no exchange of principal. The only payment is that which takes place at the maturity of the swap to reflect the net interest obligation of one party to the other. In this respect, overnight interest rate swaps have advantages over bank bills in terms of managing exposure to changes in short-term interest rates. A bank seeking to lock in the current interest rate for three months, for example, could either buy a 3-month bank bill or enter into a 3-month overnight indexed swap in which it would receive the fixed rate. If it did the former, it would take on a risk that the issuer of the bill will fail before the bill matures, in which case it could lose its principal. If, on the other hand, it enters into an overnight indexed swap, its only exposure is the net payment that arises from any difference between the fixed and floating sides of the swap. Consistent with their low credit risk, the fixed interest rate on overnight indexed swaps are systematically lower than bill yields of similar maturity (Graph 1).

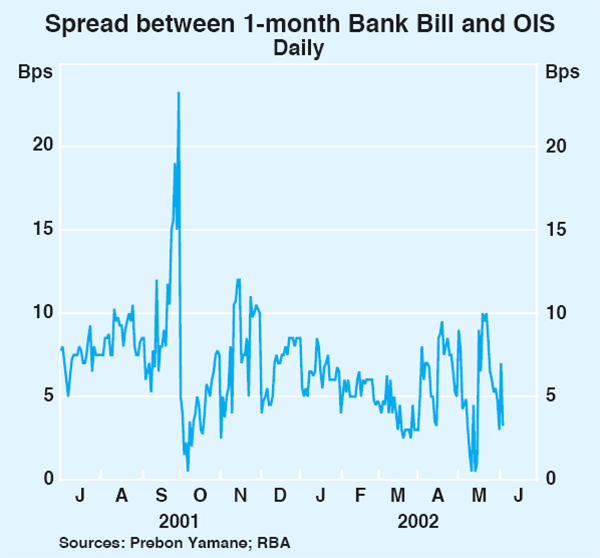
The difference in pricing that arises because of this difference in credit risk can be seen by comparing interest rates on the two instruments during periods when there are no expectations of changes to the overnight cash rate. During 2000 and 2001, for example, there were nine periods when there were more than 30 days between RBA Board meetings – that is, 30-day periods in which it would have been reasonably expected that there would be no change in interest rates, given that monetary policy is typically changed only at Board meetings. During these periods, yields on 30-day overnight indexed swaps were generally in a 2–3 basis point range around cash, with no evidence of any systematic bias. Thirty-day bank bill yields, on the other hand, were between 5 to 15 basis points above the prevailing cash rate during these periods. This is indicative of the relatively higher credit risk premium built into bill yields. This premium can vary substantially, depending on market conditions. For example, after the events in September of last year, bill yields rose sharply relative to overnight indexed swap rates (Graph 2).

The key characteristics of overnight indexed swaps – short maturities and a lack of credit risk – make them particularly useful for analysing market expectations about future movements in the cash rate. If, for example, the fixed rate in such swaps is trading above the current cash rate, this would indicate that, on average, market participants are expecting a rise in the cash rate over the term of the swap.
Further, by comparing the fixed rates for swaps of different maturities, it is possible to assess not only the magnitude of the expected change in the cash rate but also the timing of these changes. Assume, for example, that on the day before a RBA Board meeting:
- the current cash rate is 4.5 per cent;
- the 30-day overnight indexed swap rate (i.e., the fixed rate) is 4.75 per cent; and
- the 60-day overnight indexed swap rate is 4.875 per cent.
The 30-day swap rate of 4.75 per cent suggests that market participants are, on balance, expecting the overnight cash rate over the next 30 days to average that rate. Since monetary policy is typically reviewed only at Board meetings, we can deduce that markets expect the Bank to raise the cash rate by 0.25 per cent at the next day's Board meeting.
By comparing the 30-day and 60-day swap rates, we can also deduce what markets are expecting to happen to monetary policy at the subsequent Board meeting. If the market is expecting that the cash rate will average 4.75 per cent for the next 30 days and 4.875 per cent for the next 60 days, then it follows that the market must be expecting the cash rate during the second lot of 30 days to average 5.0 per cent (in simple terms, (4.75 + 5.00) ÷ 2 = 4.875).
Table 1 summarises outcomes for the cash rate predicted by 1–6 month overnight indexed swap rates since January 2000. The means represent the average difference between the expected cash rate, derived from the relevant overnight indexed swap rates, in the first, second, etc month ahead, and the actual cash rate in each of those future months. Readings greater than zero indicate that the overnight indexed swap rate ‘over predicted’ where the actual cash rate would be in the future.
| Mean | Standard deviation |
|
|---|---|---|
| One month | −1.3 | 6.6 |
| Two months | −0.6 | 15.8 |
| Three months | 1.1 | 21.7 |
| Four months | 4.0 | 29.0 |
| Five months | 13.1 | 38.1 |
| Six months | 23.4 | 44.9 |
|
Sources: RBA; Prebon Yamane |
||
The standard deviations show that forecasts become increasingly wide of the mark as the forecast horizon lengthens. At short horizons, there is a tendency for the errors – though widening – to be offsetting, so that the mean error at three months' horizon is really no greater than at one month's horizon. Beyond that, however, there is a clear tendency for errors associated with predicted outcomes to be positive. This can be attributed to the fact that risk premia in overnight indexed swaps, even though they are relatively small, do become larger as the term of an investment increases. As a result, the derived expectations of the cash rate beyond several months' horizon are biased upwards.
Table 2 compares expectations of the cash rate for the month ahead, as measured by overnight indexed swaps and the median response to Reuters' regular survey of around 20 economists. Both measures are taken on the Friday before each RBA Board meeting (with the survey-based expectations for the post-Board cash rate adjusted accordingly).
| Target cash rate (%) | 30-day average cash rate(a) | |||||||
|---|---|---|---|---|---|---|---|---|
| Pre-Board | Post-Board | 30-day average(a) |
Expectations based on Reuters survey % |
Expectations less actual Bps |
Expectations based on overnight indexed swaps % |
Expectations less actual Bps |
||
| 2001 | ||||||||
| Feb | 6.25 | 5.75 | 5.83 | 5.83 | – | 5.83 | – | |
| Mar | 5.75 | 5.50 | 5.54 | 5.68 | 14 | 5.67 | 13 | |
| Apr | 5.50 | 5.00 | 5.08 | 5.17 | 9 | 5.15 | 7 | |
| May | 5.00 | 5.00 | 5.00 | 4.92 | −8 | 4.85 | −15 | |
| Jun | 5.00 | 5.00 | 5.00 | 4.94 | −6 | 4.92 | −8 | |
| Jul | 5.00 | 5.00 | 5.00 | 4.94 | −6 | 4.96 | −4 | |
| Aug | 5.00 | 5.00 | 5.00 | 4.98 | −2 | 4.98 | −2 | |
| Sep | 5.00 | 4.75 | 4.79 | 4.91 | 12 | 4.81 | 2 | |
| Oct | 4.75 | 4.50 | 4.54 | 4.59 | 5 | 4.40 | −14 | |
| Nov | 4.50 | 4.50 | 4.50 | 4.45 | −5 | 4.38 | −2 | |
| Dec | 4.50 | 4.25 | 4.29 | 4.33 | 4 | 4.24 | −5 | |
| 2002 | ||||||||
| Feb | 4.25 | 4.25 | 4.25 | 4.26 | 1 | 4.24 | −1 | |
| Mar | 4.25 | 4.25 | 4.25 | 4.26 | 1 | 4.24 | −1 | |
| Apr | 4.25 | 4.25 | 4.25 | 4.33 | 8 | 4.36 | 11 | |
| May | 4.25 | 4.50 | 4.46 | 4.40 | −6 | 4.43 | −3 | |
|
(a) For the 30-day period following the Friday before the RBA Board meeting. Sources: RBA, Prebon Yamane, Reuters |
||||||||
The table shows that neither measure clearly predicts monetary policy more reliably than the other. For example, both perfectly predicted the February 2001 easing, though largely missed the easing the following month. In most months, the expectations derived from both sources are very similar, although some significant differences arose in September-October 2001. The early September 2001 easing in response to a further weakening in the global outlook was better predicted by the overnight indexed swaps market whereas the October easing was over-predicted by the overnight indexed swaps market. On average over the whole period, the absolute forecast error for both is about 6 basis points.
Overnight indexed swap rates are clearly not a perfect indicator of future movements in the cash rate. But they seem to provide as good an indicator as survey data – to be expected if market economists' views are continually sought and acted on by their employers – and are available in real time, unlike the survey data.
As from the June 2002 issue of the RBA Bulletin, data on overnight indexed swap rates will be published in Table F.1.