Bulletin – December 2001 City Sizes, House Prices and Wealth[1]
- Download 59KB
Introduction
Average dwelling prices in Australia are high relative to household income and Australian households hold a greater proportion of their wealth in dwellings than households in other countries. These facts and some competing explanations for them are explored in a recent research project within the Economic Research Department of the Bank. The research considers a range of factors, including variations in government policies and individuals' preferences, but concludes that it is differences in urban structures across countries that have a more important influence on average dwelling prices and levels of dwelling wealth.
This demographic explanation seems to be particularly relevant for Australia, where the population is much more concentrated in the largest cities than is the case for most other countries. Since in Australia, as elsewhere, dwelling prices tend to be higher in larger cities, the analysis concludes that the higher concentration of the population in the major capital cities is likely to have contributed to average dwelling prices being relatively higher and households having a higher share of their wealth concentrated in housing assets than in other countries.
This has not, however, always been the case. In the early 1980s, although Australia's urban structure was relatively similar, average dwelling prices were comparable to those in other countries. At that time, regulated financial markets combined with high inflation limited some households' capacity to participate in the housing market, and held dwelling prices lower than they would otherwise have been. Financial deregulation and the move to low inflation are argued to have released this pent-up demand enabling dwelling wealth to rise towards its higher long-run equilibrium.
Australia's High Dwelling Wealth: Rival Explanations
In 1980 and 1985, Australia's dwelling wealth to income ratio was roughly comparable with that in other countries (Table 1).[2] Since then, however, this ratio has grown in a sustained manner, such that by 1998, it was relatively high by international standards. While a somewhat similar increase has been experienced in New Zealand, it has not been evident in most other countries.
| Country | 1980 | 1985 | 1990 | 1995 | 1998 |
|---|---|---|---|---|---|
| Australia | 248 | 239 | 281 | 303 | 355 |
| Canada | 123 | – | 118 | 129 | 129 |
| France(a) | 172 | – | 218 | 218 | 227 |
| Germany(a) | – | – | 331 | 302 | 301 |
| Italy | 133 | – | 170 | 172 | 166 |
| Japan(b) | 380 | 397 | 641 | 429 | 381 |
| UK | 343 | 357 | 361 | 252 | 293 |
| US | 169 | 170 | 173 | 155 | 163 |
| Sweden(b) | 208 | 184 | 245 | 182 | 198 |
| New Zealand | 185 | 237 | 243 | 278 | 283 |
|
(a) 1998 data refer to 1997 Sources: Bundesbank; Mylonas, Schich and Wehinger (2000); OECD; RBA; RBNZ |
|||||
One possible explanation for Australia's relatively high dwelling wealth is that government policies have made housing in Australia relatively more attractive than in other countries. Housing investment in Australia is certainly encouraged by favourable taxation arrangements, particularly capital gains tax exemptions and negative gearing provisions, but this occurs in most countries (Table 2). In contrast to many countries, in fact, Australia does not provide for mortgage interest deductibility, which has been shown in earlier studies to have a significant impact on the housing market, particularly during times of high inflation.[3] On balance, it thus seems unlikely that government policies are much more supportive of dwelling investment in Australia than elsewhere.
| Country | Mortgage interest deductibility(a) |
Capital gains exemptions on the family home(a) |
Negative gearing tax provisions(b) |
Memo item: home ownership rates Per cent |
|---|---|---|---|---|
| Australia | No | Yes | Yes | 70.1 |
| Canada | No | Yes | Yes | 63.7 |
| France | Yes | Yes | Yes | 56.0 |
| Germany | Yes | Yes | Yes | 43.0 |
| Italy | Yes | Yes | Yes | 68.0 |
| Japan | No | Yes | Yes | 60.3 |
| UK | Yes(c) | Yes | No | 69.0 |
| US | Yes | Yes | Yes | 67.4 |
| Sweden | Yes | Yes | Yes | 56.0 |
| New Zealand | No | Yes | Yes | 71.2 |
| (a) Refers to owner-occupied housing (b) Refers to investment housing (c) Abolished in April 2000 |
||||
Another argument that is often made is that Australians simply have a stronger preference for housing than residents in other countries. If this were true, we may expect the quality of dwellings in Australia to be higher than in other countries. While there are a greater proportion of detached houses in Australia than other countries, suggesting more land-intensive housing patterns, the average size of an Australian dwelling is somewhat smaller than that in the USA, and roughly similar to that in New Zealand and Canada. Home ownership rates, arguably another indicator of households' preferences, are also not significantly higher in Australia than in many other English-speaking countries.
The Urban Structure and Dwelling Prices
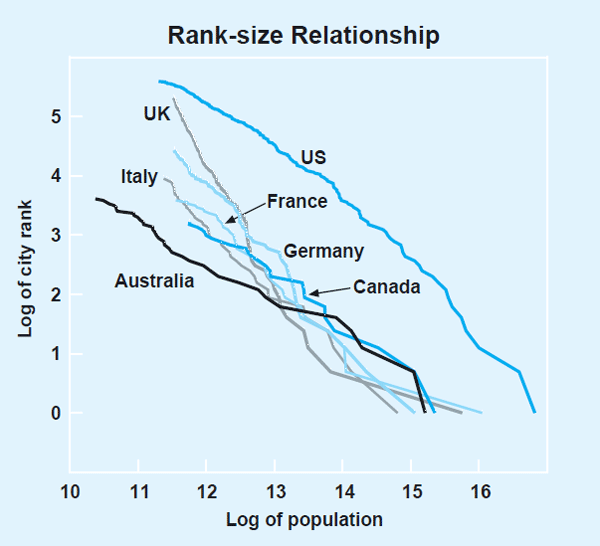
In this research project, an alternative driver of dwelling prices is explored, which relates the level of house prices to the distribution of city sizes or urban structure. A revealing way to illustrate different countries' urban structures is to examine the relationship between the rank of each city and its population size.[4] This is commonly termed the log rank-size relationship. In the US, the slope of the rank-size relationship is roughly one, which means that the largest city is about twice the size of the second largest; three times the size of the third largest and so on (Graph 1). For most other countries, the slope of the rank-size relationship ranges between 1 and 1.3.

In Australia's case, however, the rank-size relationship is considerably flatter, with a slope of about 0.6, indicating that Australia has an unusually high concentration of its urban population in its largest cities. Fifty-five per cent of the urban population reside in Sydney and Melbourne – the two largest cities. This is well above the average of most countries (Table 3).[5] Canada and France also rank quite highly by this measure, but can be distinguished from Australia since their medium-sized cities (500,000 to 1 million residents) command a considerably greater share of the population.
| Country | Share of urban population in two largest cities |
Share of urban population in medium-sized cities(a) |
Dwelling wealth-household income ratio (1998) |
|---|---|---|---|
| Australia | 54.2 | 0 | 355.0 |
| Canada | 42.6 | 20.3 | 128.8 |
| France | 48.8 | 13.0 | 226.8 |
| Germany | 20.0 | 21.6 | 301.1 |
| Italy | 27.1 | 15.6 | 166.0 |
| UK | 19.0 | 4.6 | 293.0 |
| USA | 15.7 | 16.8 | 162.9 |
| NZ | 59.1 | 0 | 283.0 |
| Average | 35.8 | 11.5 | 239.6 |
| (a) The United Nations defines a medium-sized city as one with a population between 500,000 and 1 million | |||
Why is Australia's urban structure so unusual? A comparison with Canada, a country that also has a flatter than average rank-size relationship, suggests that transport costs and federal political systems might be important. Both countries have small populations spread over large regions, and fairly sparse transport infrastructure compared with more densely populated countries. This might encourage the formation of large centres in order to minimise transport costs.[6] A federal political structure would further encourage this tendency to agglomeration, as provincial/state capitals might attract residents from other parts of the country because their role as the seat of provincial/state government results in employment opportunities in administration and policy that are not available elsewhere. In Canada, but not in Australia, this effect is moderated by the fact that there tend to be two large cities in each province, one being an economic centre and the other a political centre, which may help explain why Canada has more medium-sized cities than Australia.
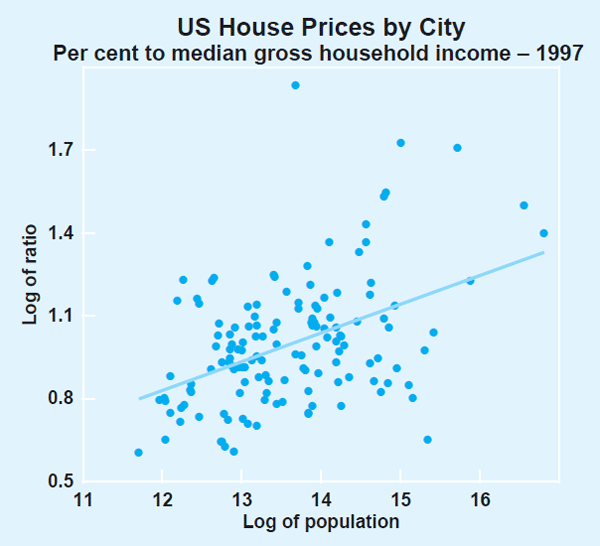
Australia's unusual urban structure implies that its dwelling price to income ratio will be higher in equilibrium than in other countries. This argument is based on the observation that dwelling prices are higher in larger cities than smaller ones, even after controlling for income. Graph 2 shows that this relationship holds in the US – the country for which the broadest range of data is available – and data for the capital cities show that it holds in Australia too. Given this relationship, it is then a matter of simple aggregation that the national average dwelling price will be higher in countries with a larger share of population concentrated in large cities. While it is possible that having a higher average dwelling price may lead some households to reduce their demand for housing services, it seems likely that any demand response would only provide a partial offset.

The urban-structure explanation is consistent with the data for a number of countries. The urban populations of both Australia and New Zealand are highly concentrated in the largest cities and dwelling wealth is relatively high. In Italy and the US by contrast, the large cities command a small share of the urban population and dwelling wealth is relatively low. Urban structure, however, cannot be the only factor since, on this basis, we would expect Germany's dwelling wealth to be lower and Canada's wealth to be higher.
The Dynamics of Dwelling Wealth
If the share of dwelling wealth in Australia had always been relatively high, the story would end here. But as shown in Table 1, in 1980, Australia's ratio of dwelling wealth to income was comparable to other countries' and household debt was relatively low. It is therefore of interest to ask why dwelling prices have undergone such a sustained increase in Australia in the last 15 years, and why this phenomenon has not been observed in most other countries.
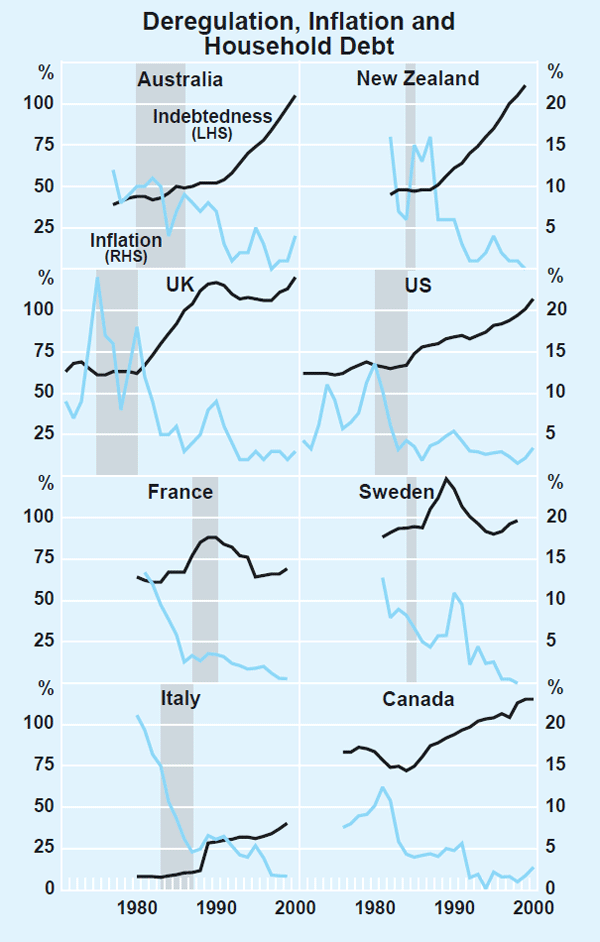
In the 1970s and early 1980s, the level of household debt in Australia was constrained by financial regulations and high inflation. A regulated financial sector implies that credit is rationed and households cannot borrow as much as they would like at the current interest rate. High inflation constrains household debt because it implies that some households are denied access to the mortgage market and others are limited to taking out smaller-sized loans than they desire.[7] In Graph 3 we illustrate that across most countries, the deregulation of the financial system (which occurred during the periods identified by the grey panels) combined with the move to low inflation preceded a rapid increase in household indebtedness. The most substantial increases in debt were evident in Australia, New Zealand and the UK, while in Canada, where the loan market was always fairly deregulated, the increase in debt was less pronounced. The removal of credit constraints and the reduction in nominal interest rates associated with the decline in inflation thus enabled some renters to purchase and existing home owners to upgrade, and this, in turn, is likely to have increased the effective demand for housing, placing upward pressure on dwelling prices.

Dwelling wealth to income ratios, however, did not increase in all countries following the financial deregulation and disinflation. The research argues that because of the prevalence of mortgage interest deductibility in other countries, such as the US and UK, the demand for housing may have been less constrained by financial regulations and high inflation. This meant that in the US and UK, the adjustment required to reach the new housing market equilibrium in the deregulated low-inflation environment was probably quite small. In Australia and New Zealand, by contrast, these factors disproportionately constrained dwelling prices in the larger cities, leading to a major adjustment both to dwelling prices and the dwelling wealth-income ratio when these constraints were removed.
Conclusion
This analysis provides a geographical explanation for Australia's high dwelling wealth. Since larger cities have higher housing prices, the national average housing price will be higher in countries like Australia, where a larger share of the population is concentrated in large cities. This effect would have manifested itself earlier, had it not been for the constraints that regulation and high inflation placed on the financial behaviour of households.
Footnotes
This article was prepared by Dan Andrews, Economic Research Department. It summarises the results of research undertaken with Luci Ellis that was published in RBA Research Discussion Paper No 2001-08, entitled ‘City Sizes, Housing Costs, and Wealth’. Staff research published by the Bank is intended to contribute to debate, and does not necessarily reflect the views of the Bank. [1]
The ratio of aggregate dwelling wealth to disposable income is roughly equivalent to the ratio of average dwelling prices to average disposable income. [2]
See Poterba (1984) and Britten-Jones and McKibbin (1989). [3]
The rank is obtained by ordering cities by their population size, where the largest city is ranked one, the second-largest is ranked two and so on. This relationship is typically examined in logs. [4]
Table 3 includes all countries in Table 1, except Japan and Sweden whose data refer to non-financial assets. [5]
See Ades and Glaeser (1995). [6]
This distortion is driven by the fact that lenders typically determine maximum loan sizes based on initial repayment to income ratios. See Stevens (1997) for a further explanation of these effects. [7]
References
Ades AF and EL Glaeser (1995), ‘Trade and Circuses: Explaining Urban Giants’, Quarterly Journal of Economics, 110(1), pp 195–227.
Britten-Jones M and WJ McKibbin (1989), ‘Tax Policy and Housing Investment in Australia’, Reserve Bank of Australia Research Discussion Paper No 8907.
Ellis L and D Andrews (2001), ‘City Sizes, Housing Costs, and Wealth’, Reserve Bank of Australia Research Discussion Paper No 2001-08.
Mylonas P, S Schich and G Wehinger (2000), ‘A Changing Financial Environment and the Implications for Monetary Policy’, OECD Economics Department Working Paper No 243.
Poterba JM (1984), ‘Tax Subsidies to Owner-Occupied Housing: an Asset-Market Approach’, Quarterly Journal of Economics, 99(4), pp 729–752.
Stevens G (1997), ‘Some Observations on Low Inflation and Household Finances’, Reserve Bank of Australia Bulletin, October, pp 38–47.