Bulletin – July 2000 Developments in the Mining Sector[*]
- Download 58KB
Conditions in the mining industry have diverged significantly in recent years from those in the rest of the economy. In particular, after several years of strong performance in the mid 1990s, the industry entered a sharp downturn in the wake of the Asian economic crisis, stemming from weaker external demand and lower commodity prices. One consequence of this has been a steep cut-back in mining investment, which in turn has been an important contributing factor to a decline in investment growth for the economy as a whole. This article examines some of the key developments in the mining industry over the past few years and assesses its outlook.
The mining sector has traditionally made an important contribution to the Australian economy, particularly in terms of investment and exports. Coal and oil and gas are the largest individual sectors, though the gold, iron ore and base metal sectors each account for more than 10 per cent of total mining production (Table 1).
| Production | Exports | |
|---|---|---|
| Coal | 9.9 | 9.5 |
| Oil and gas | 9.3 | 4.2 |
| Base metal & other minerals(b) | 6.0 | 5.3 |
| Gold | 4.9 | 4.5 |
| Iron ore | 4.0 | 3.8 |
| Total | 34.1 | 27.3 |
|
Notes: (a) Sources: ABARE, ABS Cat No 5302.0 and 8415.0 (b) Includes copper, lead, zinc, bauxite, mineral sands and other unrefined ores and minerals. |
||
Recent Developments
Output from the mining sector increased steadily for much of the 1990s in line with increased investment in the sector (Table 2). The growth was broadly based, with significant increases in output of metal ores and coal in particular. In the year to the December quarter 1998, however, output declined by around 8 per cent, coinciding with weak external demand and historically low world commodity prices. Temporary factors (in particular, the Longford explosion and large scale maintenance at the Wanaea-Cossack fields) also had a significant negative impact on the extraction of oil and gas towards the end of 1998 and the first half of 1999. More recently, mining output has rebounded, increasing by nearly 10 per cent during 1999.
| 1999 Share, % |
1992–1997 Year to Dec, % pa |
1998 Year to Dec, % change |
1999 Year to Dec, % change |
||
|---|---|---|---|---|---|
| Output(a) | – volumes | 4 | 6.3 | −8.3 | 9.5 |
| Investment | – volumes | 16(b) | 15.5 | −24.4 | −47.7 |
| Exploration | – values | — | 7.6 | −5.0 | −25.6 |
| Exports(c) | – values | 25 | 5.2 | 5.0 | −2.5 |
| – volumes | — | 5.4 | 7.8 | −3.9 | |
| Profits | – values | 20 | 2.6 | −9.0 | 73.4 |
| Employment | 1 | −0.8 | −1.6 | −3.8 | |
|
Notes: (a) Excludes simply transformed manufactures such as refined petroleum. (b) Values. (c) Excludes the re-export of imported gold. |
|||||
In the period up until the Asian crisis, growth in exports (excluding re-exports of imported gold) generally exhibited a similar pattern to growth in mining output, reflecting the high export intensity of the sector. Given the importance of the Asian region as a destination for Australian exports, it was to be expected that with the onset of the crisis in East Asia, mining exports would be adversely affected. However, for much of 1998 both export values and volumes increased, as exporters drew down stocks, particularly of coal, and successfully diverted products to alternative markets, assisted by the decline in the Australian dollar and the contract-related delay in effecting large cuts to coal and iron ore prices (Graph 1). It was not until early 1999 that both the value and volume of mining exports fell significantly. Most categories of mining exports experienced a fall in values reflecting the significant fall in prices for most commodities in Australian dollar terms as the earlier depreciation of the currency began to be reversed. There was also a significant fall in volume terms, particularly for metal ores and gold.
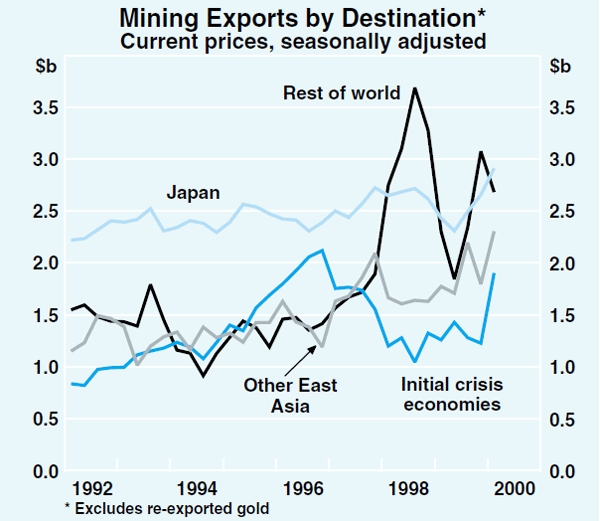
There were also a number of commodity-specific reasons for the relatively good performance of Australia's mining exports in 1997 and 1998. New supply capacity, reflecting the high levels of investment in the mid 1990s, (particularly for base metals) and high initial stock levels provided scope for some offset of the effect of mine closures (both temporary and permanent) on exports. Historically low international freight rates also assisted the competitiveness of these commodities in more distant markets. In the case of the bulk ores, Australia's reputation as a quality, reliable producer and the fixed structure of the export contracts meant that export volumes were initially supported following the onset of the crisis. In addition, the economies of scale faced by Korean manufacturers resulted in the volume of their resource imports being maintained initially, up to the point where manufactured stocks in Korea built up to historically high levels. Following this, total demand was reduced, or in some cases a lower grade product was demanded.
The strong increase in investment in the mining industry over most of the 1990s accounted for around 30 per cent of the economy-wide increase in investment over the period and reflected favourable fundamentals for investment during that time. The low inflation environment reduced the disincentive to invest in projects with long time horizons. This was assisted by a recovery in world growth and commodity prices, elements of the tax system[1], microeconomic reforms that reduced input costs, such as for electricity, and continual advances in technology that improved the viability of some sites and increased productivity.
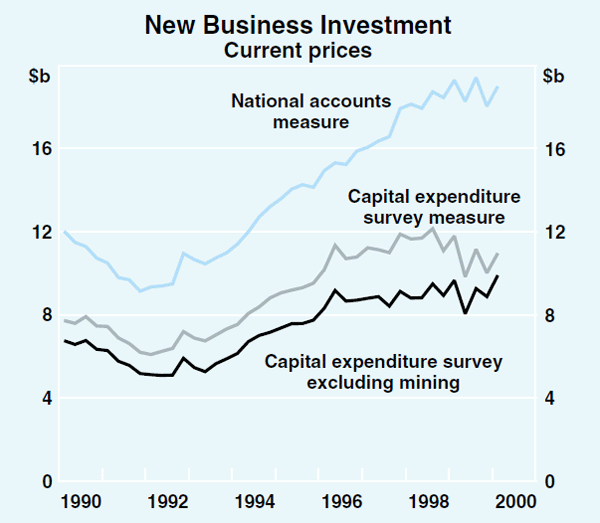
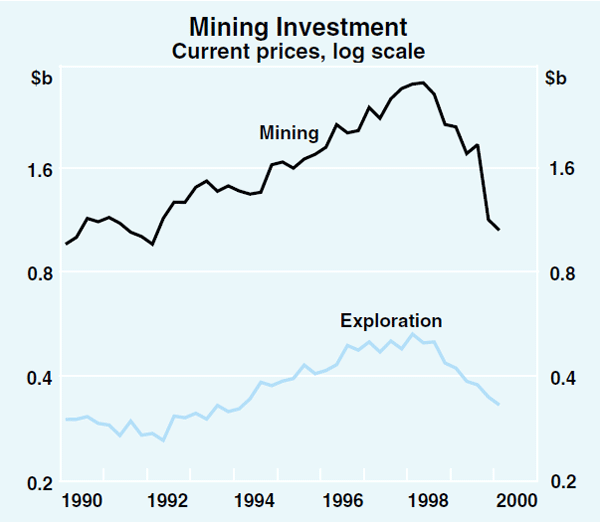
Throughout 1998, however, investment in new mining capital fell sharply, accounting for a large part of the slowing in total business investment in that year (Graph 2). Investment by the mining industry fell further through 1999 (Graph 3) and at the end of the year, mining investment as a share of GDP, at 0.7 per cent, was at a level last seen in the late 1970s. Mining investment fell further in the March quarter 2000, while a slight rise is in prospect in the June quarter according to the latest ABS Capex survey and the second expectation for 2000/01 implies that investment by the mining industry should pick up from the recent low levels. Even so, mining investment as a share of GDP in 2000/01 is expected to remain well below the average for the past decade. The large decline in mining investment in the second half of 1998 was accompanied by a fall in exploration expenditure. Expenditure on exploration is a more discretionary element of companies' costs and can be altered more quickly than is the case for capital expenditure. Around 80 per cent of expenditure is concentrated in gold and petroleum exploration and the fall in exploration coincided with the prices of both of these reaching historical lows during 1999.
Profits of the mining industry were adversely affected by the Asian crisis but, more recently, have benefited from a clear improvement in international trading conditions (Graph 4). According to the ABS company profits survey, mining profits peaked in early 1997, and subsequently declined by around 4 per cent over the following two years. Trends in commodity prices have been an important driver of these developments, although there are a number of factors that complicate the relationship between commodity-price movements and the overall profitability of the industry.
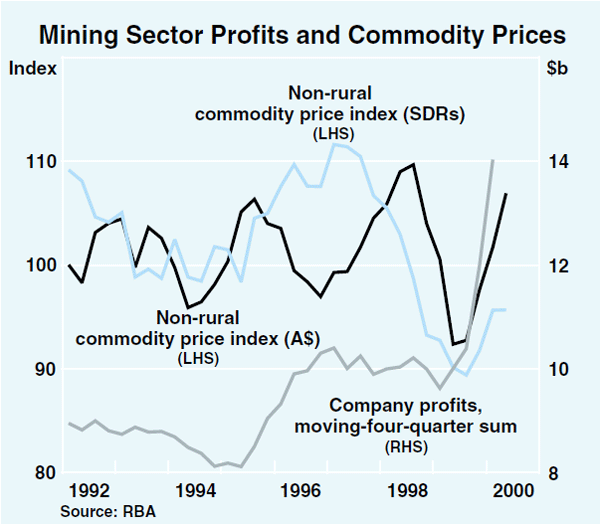
In the early part of the crisis period, currency depreciation meant that prices of many commodities were increasing in Australian dollar terms. This initially helped to support profits, although the overall impact on profits will have depended on the currency and commodity-price hedging practices of individual businesses. High contract prices for coal and iron ore, increased export volumes and reductions in costs, achieved through reductions in employment and other discretionary spending cuts, were probably also important in cushioning the initial impact of the fall in world commodity prices. The survey suggests that the low point for mining profits was reached in early 1999 and that they have since rebounded strongly. This most likely reflects a combination of factors. Commodity prices have increased in both world and Australian dollar terms since late 1999 and oil prices, which are not included in the RBA index shown, doubled over the year to the December quarter 1999. In addition, stronger output growth and continued rationalisation in the industry, with some of the more high cost producers leaving the industry, should have also acted to boost profit growth for the industry as a whole.
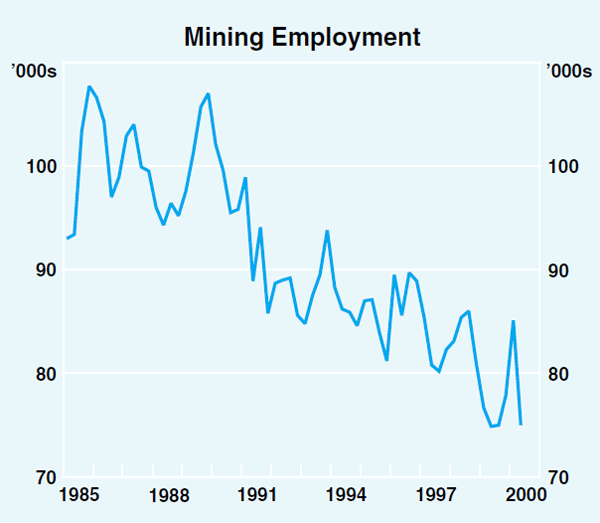
Despite the large increase in output of the mining sector over the last decade, employment in the industry has been trending down (Graph 5). This reflects the impact of productivity improvements in an industry that is by its nature very capital intensive. The impact of contracting out services previously undertaken in-house is also relevant. After increasing through much of 1998, there was a significant decline in total mining employment in 1999 and abstracting from quarterly volatility, it is at or near historical lows. Almost all of the recent fall was due to reductions in employment in the coal industry, such that in 1999 it accounted for 25 per cent of total mining employment, compared with over 30 per cent in earlier years. This reflected the combination of labour shedding and the closure of some mines.
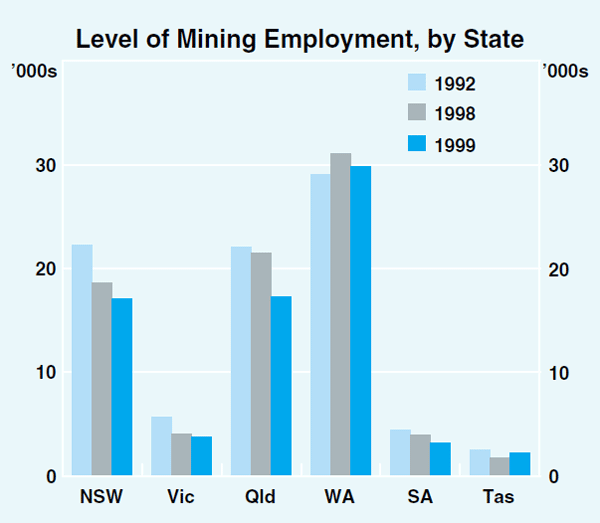
The downward trend in employment has not been uniform across all states (Graph 6). For example, a large part of the fall in mining employment over the last seven years has occurred in New South Wales (with a significant amount of that reflecting downsizing in the coal industry) and Queensland, while employment in Western Australia increased over the same period.
Prospects
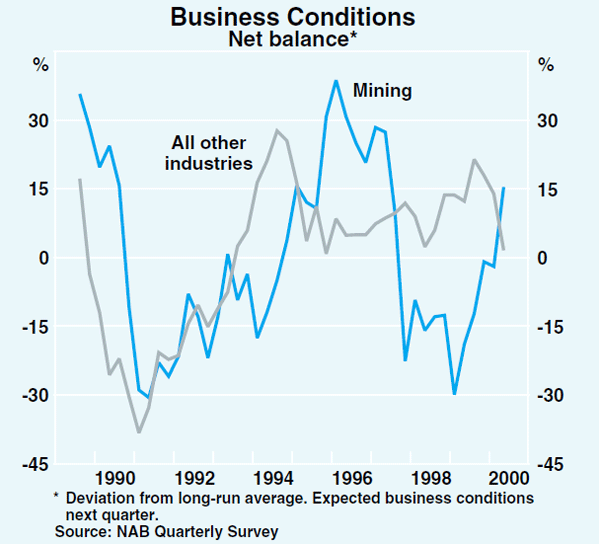
The mining sector in aggregate appears well placed to expand production as demand increases. The NAB Survey measure of capacity utilisation in the mining sector fell to a record low in the June quarter of last year, and while it recovered somewhat later in the year, it remains significantly below its historical average. This suggests that any pick-up in external demand could in many areas be met by further increases in production at existing mines, or the reopening of closed mines. The completion of a number of new projects late in 1999 also points to potential increases in production through 2000. Expected business conditions have improved progressively over the past 12 months, in line with increases in the volume of output and exports and a more favourable outlook for prices and external demand, such that they are now at their highest level for several years (Graph 7). In addition, most commodity analysts, including the Australian Bureau of Agriculture and Resource Economics (ABARE), have revised up further their forecasts for exports. ABARE expects the increase to be broadly based, with export volumes of base metals, iron ore and coal all increasing strongly.
Existing surplus capacity has probably been an important factor behind the relatively weak outlook for mining investment recorded in business surveys. In addition, despite their recent increases, world prices of some commodities (such as for the bulk ores) are still well below previous years' levels. There is also the possibility that companies will continue to focus on achieving productivity improvements from existing assets in the short to medium term rather than committing to new large scale projects. Nonetheless, there remain a large number of possible projects, particularly LNG and base metal projects, which could drive a bounce-back in investment if conditions were to improve further. While there is no evidence yet of significantly stronger investment intentions, surveys do suggest that the period of successive downward revisions to investment intentions in the industry may now have run its course, as business conditions have improved. This has significant implications for the investment outlook of the economy as a whole.