Bulletin – June 1999 Bank Fees in Australia
- Download 63KB
Introduction
It is common to view banks as financial intermediaries which take deposits and lend funds, thereby earning profit primarily from the difference between the interest rates they charge for loans and those they pay on deposits. Banks, however, provide a range of other financial services. Each of the major banks, for example, offers insurance, funds management, advisory services, financial markets products, and a wide range of transaction services, as well as earning money from its in-house trading activities and provision of products such as foreign exchange to customers. The income earnt from all these activities is known as ‘non-interest income’ and there is a reasonable amount of data on this going back quite a few years. Within the category ‘non-interest income’, there is a smaller component which covers fees for account-servicing, loans and transactions. It is this component which has attracted a good deal of public interest recently and which is investigated in the present paper.
Fees have long been a feature of banking relationships. In 1900, for example, banks in New South Wales and Victoria imposed a charge of ten shillings (about $50 at 1999 prices) a year for keeping a current (cheque) account.[1] For much of Australia's post-Second World War history, however, many banking services were provided free or at very low cost as they were cross-subsidised by the wide interest margins banks earned on their intermediation. This was most evident during the period in which bank interest rates were heavily regulated as such regulation ruled out competition via interest rates. The main avenue of competition left for banks was to provide payments and other services at low, or no, charge to customers in order to attract deposits.
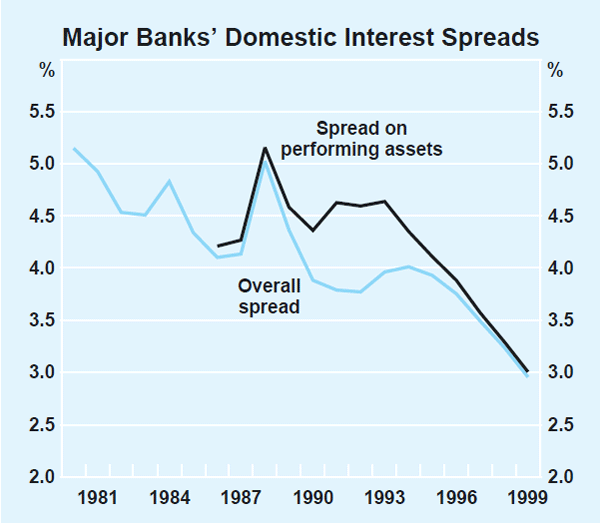
Financial deregulation, a process which gathered momentum in Australia in the early 1980s, allowed banks greater scope to compete for deposits and loans on the basis of interest rates. As a result, banks' net interest spreads – the difference between the average interest rate received and the average interest rate paid – should have begun to contract.[2] This process was slow at first and took a setback in the early 1990s as banks restored their profitability to offset the high levels of bad debts they had incurred at that time (Graph 1). The Reserve Bank first began researching the subject of interest margins at this stage, in response to public disappointment at the apparent failure of deregulation to reduce margins.[3] But, by the mid 1990s, as non-bank competitors emerged to challenge banks' most profitable activities, especially in housing lending, margins began to narrow again; interest spreads were subsequently reduced across a range of other lending products, both household and business.[4] Since the early 1980s, major banks' overall interest spread has narrowed from around 5 percentage points to 3 percentage points. Although this has been a desirable development, it has considerably reduced the scope for banks to use the margins earned from traditional financial intermediation to cross-subsidise the other services they provide.
There has been a tendency for new banks and non-bank rivals to compete selectively for the more profitable banking activities, which had the capacity to leave the longstanding banks with a disproportionate share of low-profit or loss-making activities. In response, banks have ‘unbundled’ financial services, and priced them separately. This has meant that prices of these services have risen and now more closely reflect their economic cost. One purpose of this was to provide customers with incentives to use lower cost services, and to economise on expensive activities and accounts.
Although there is now no dispute that banks' interest margins have narrowed, there is considerable public unease about bank fees. Many people feel that fees have risen too quickly or are too high. Others would like to know how Australian banks' fees compare with those overseas, or whether the increase in fees has offset the narrowing of margins. This article makes a first attempt at answering these questions but, because of data limitations, its conclusions can at this stage be regarded only as preliminary. The major limitations are that detailed data are only available since 1997, and that these data cover only the four major banks and two large regional banks. Like the Reserve Bank's earlier work on bank margins, two or three iterations may be required before enough information is available to reach conclusive answers.
Bank Fees
Most concern about bank fees centres on the cost to households of running a bank account and making transactions. Table 1 attempts to summarise the changes in such fees that have occurred over the 1990s. The fees represent the average of the charges of the major four banks, although there is a good deal of variation within these averages (for example, one bank does not charge an account-servicing fee, and there is a range of circumstances in which fees are waived altogether).
| 1991 | 1995 | 1999 | |
|---|---|---|---|
|
Account-servicing(b)
(per month) |
0.00 | 2.00 | 4.00 |
|
Transaction fees(c)
(per transaction) |
|||
| Own bank's ATM | 0.30 | 0.40 | 0.60 |
| Other bank's ATM | 0.30 | 0.40 | 1.30 |
| EFTPOS | 0.30 | 0.40 | 0.50 |
| Cheques | 0.50 | 0.70 | 0.75 |
| Counter withdrawal | 0.50 | 1.00 | 2.15 |
| Memo items: | |||
|
Number of free transactions(d)
(monthly) |
11 | 11 | 8 |
|
Range of minimum balances required
to waive account-servicing fees |
0–500 | 300–500 | 0–1,000 |
|
(a) This table is based on public information on ANZ Bank Access Account,
Commonwealth Bank Streamline Account,
NAB National FlexiAccount, and Westpac Classic Account, or comparable
accounts in earlier years. The fees are based on costs after the number
of free transactions have been exceeded. Transaction fees can also be
waived if combined specified deposit and loan balances meet minimum levels.
The averages are rounded to the nearest 5 cents.
Sources: Inquiry into Fees and Charges Imposed on Retail Accounts by Banks and Other Financial Institutions and Retailers on EFTPOS Transactions, Prices Surveillance Authority, 1995; and banks' brochures. |
|||
While it is important to keep the above qualifications in mind, some trends seem apparent. Account-servicing fees, introduced early in the 1990s, have increased (unless customers meet the minimum balance required for the fee to be waived); this minimum balance has also increased at some banks. When customers exceed the threshold of fee-free transactions, the largest increase in fees has been for withdrawals conducted across the counter at branches. Other fees on transactions have increased but more slowly than those for counter withdrawals. Charges for withdrawals from ATMs are higher and have increased more quickly than those for EFTPOS transactions. The average charge for payments made by cheque is higher than for EFTPOS or own bank's ATM withdrawals, but has grown more slowly than charges for other payments instruments. The average number of free transactions has fallen, with the three banks with such a facility now permitting eight free transactions a month. (The major bank with no free transactions has no account-servicing fees.)
Some banks advertise exemptions or concessions from fees for particular groups. For example, each bank exempts customers with a housing loan at the bank concerned; some exempt people younger than eighteen, tertiary students and those with a loan other than for housing. In rural locations in which no ATM facilities are available, some banks charge for over-the-counter transactions as if they were being conducted electronically; a number of banks apply a similar, or cheaper, approach to customers with a disability. Some banks have concessions for pensioners or accounts specifically tailored to meet their needs.
Fees paid by households are not confined to charges on transactions and account-servicing on deposits. Credit cards and other loan accounts also have fees applying to them, and banks also charge for other services provided.
Fees and commissions also apply to banking relationships with businesses, on loans, bill lines, and merchant-servicing, as well as on custodial, commercial and syndication activities and the like. Such fees are usually subject to negotiation between banks and their business customers and less information is available publicly about them than retail accounts.
How Much Do Banks Earn in Fees?
A group comprising six large Australian banks has made available to the Reserve Bank details of fees earned from their operations in Australia since 1997.[5] These figures contain more detail than the aggregates published in banks' financial statements and allow an assessment of the incidence of fees between households and businesses. In making such assessments, however, it has to be recognised that, because the information largely comes from internal management sources, there may be differences in how some items are classified. As time passes, it should be possible to iron out any such differences between banks.
Households
For this group of six banks, fees earned from households, from all domestic sources, amounted to about $1.4 billion in 1998 (Table 2); this represented about 30 per cent of banks' domestic fee income.
| 1997 | 1998 |
Per cent of total fees earned from households in 1998 |
|
|---|---|---|---|
| Deposits | |||
| Account-servicing | 165 | 180 | 13 |
| Other | 10 | 10 | 1 |
| Total | 175 | 190 | 14 |
| Loans | |||
| Housing – Account-servicing |
175 | 275 | 20 |
| – Other | 50 | 75 | 5 |
| Credit cards – Account-servicing |
95 | 105 | 7 |
| – Other | 5 | 5 | .. |
| Other personal – Account-servicing |
140 | 140 | 10 |
| – Other | 45 | 50 | 4 |
| Total | 510 | 650 | 46 |
| Transactions | 150 | 270 | 19 |
| Other fees | 260 | 300 | 21 |
| Total households | 1,095 | 1,410 | 100 |
| (a) For the six banks surveyed. | |||
Revenue from households comes from fees on deposit and loan accounts as well as from charges on transactions. Banks earned $190 million from fees on deposit accounts in 1998 (representing 0.1 per cent of household deposits), and about $650 million from loan accounts (representing 0.3 per cent of household loans). Banks also earned a total of $270 million from fees on retail transactions.
Business
Banks earned fees of about $3.1 billion from businesses in 1998, about 70 per cent of banks' domestic fee income. Of this, a bit more than half comes from small business. Banks' fee income from businesses is summarised in Table 3.
| 1997 | 1998 | Per cent of total fees earned from businesses in 1998 |
|
|---|---|---|---|
| Small business | |||
| Deposits | 150 | 165 | 5 |
| Loans | 475 | 585 | 19 |
| Bills | 285 | 265 | 9 |
| Total | 910 | 1,015 | 33 |
| Large business | |||
| Deposits | 45 | 45 | 1 |
| Loans | 345 | 340 | 11 |
| Bills | 530 | 540 | 17 |
| Total | 920 | 925 | 29 |
| Merchant-service fees | 585 | 750 | 24 |
| Other | 380 | 410 | 14 |
| Total business | 2,795 | 3,100 | 100 |
| (a) For the six banks surveyed. | |||
Fees on loans and bill lines account for more than half of bank fees from business. About a quarter comes from merchant-service fees, which banks typically earn from card transactions; fees earned from this source amount to around 2 per cent of the value of transactions conducted on credit cards. Only about 6 per cent of fees from business is earned from deposit accounts.
Other non-interest income
As well as fee income of the sort discussed for households and businesses, banks also earn non-interest income from providing a range of other services such as funds management, insurance, advisory services, as well as from foreign exchange and trading in financial instruments. In addition to fee income of $4.5 billion in 1998, the group of six banks earned $2.7 billion in other non-interest income from these activities (Table 4). Altogether, non-interest income for this group of banks amounted to about $7.2 billion from their operations in Australia in 1998.
| 1997 | 1998 | Per cent of domestic non-interest income in 1998 |
|
|---|---|---|---|
| Total fees | 3,890 | 4,510 | 62 |
| Other non-interest income | |||
| Funds management | 260 | 315 | 4 |
| Insurance | 255 | 310 | 4 |
| Advisory | 65 | 90 | 1 |
| Net interbank fees and commissions | 80 | 85 | 1 |
| Other non-interest income(b) | 1,520 | 1,925 | 27 |
| Total | 2,180 | 2,725 | 38 |
| Total domestic non-interest income | 6,070 | 7,235 | 100 |
|
(a) For the six banks surveyed.
(b) Including foreign exchange, trading and other non-interest income as classified in banks' annual reports. |
|||
Australian banks also earn fee and other non-interest income from their operations abroad; this amounted to about $3.4 billion in 1998. In other words, non-interest income from these banks' global operations, i.e. from those in Australia and abroad, amounted to about $10.6 billion in 1998. This measure, of course, represents non-interest income from all local and international sources; it is a much wider measure than fees charged on households and businesses in Australia, the usual focus of public discussion.
Have Banks Relied Increasingly on Fee Income?
Since the detailed data on domestic fees is for the latest two years only, we have to fall back on some broader figures for total non-interest income if we wish to get a historical perspective. However, a long-run of data is available only for the four major banks, a subset of the group of six banks which is the subject of the foregoing discussion.
Over the past two decades, a rising proportion of major banks' earnings has come from non-interest income (Graph 2). As a proportion of global operating income, non-interest income increased from around 30 per cent in 1980 to around 38 per cent in 1998.[6] A more pronounced rise is evident in the ratio for banks' domestic operations. The recent rise seems to have been concentrated in banks' fee income.
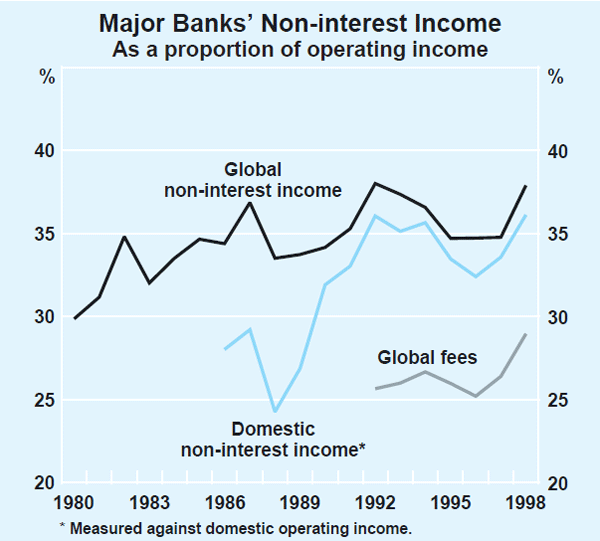
The rising share of non-interest income reflects two main factors. The first is that growth in the other main source of income – interest earnings – has been restrained by falling interest margins. Second, banks are charging more explicitly for their services, and growth in many activities on which fees are charged has been very strong. Table 5 shows that some significant activities – such as trading operations, securitisation, funds management and transaction services – have grown more quickly in the 1990s than the traditional business of financial intermediation, as measured by growth in banks' assets. Banks' assets have grown at an average rate of about 8 per cent a year in the 1990s, whereas other activities have increased by between 10 and 25 per cent.
| Banks' assets | 8 |
|---|---|
| Number of transactions | |
| Retail | |
| – Paper-based | 0 |
| – Electronic | 17 |
| Wholesale | 22 |
| Funds under management | 25 |
| Foreign exchange turnover | 11 |
| Securities turnover | 19 |
| Securitisation of assets | 25 |
| (a) In calculating these growth rates, the latest observation is for the year ending in 1998. Due to data limitations, starting points vary. Data for banks' assets, foreign exchange turnover and securitisation of assets begin in 1990; those for paper-based and electronic retail transactions begin in 1991; those for wholesale transactions, funds under management and securities turnover are available since 1993. | |
That said, growth in non-interest income, or more specifically, fee income, has been no faster than growth in banks' assets. The ratio of non-interest income to assets tended to fall through much of the 1990s, as did the ratio of fees to assets (Graph 3).
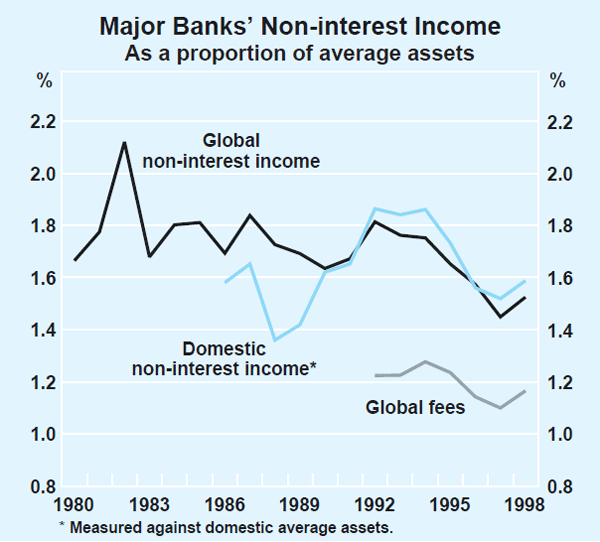
In 1998, this trend was partly reversed. Non-interest income of major banks grew by 20 per cent and, within that, fee income grew by 21 per cent. These growth rates are more than double their previous averages. In the case of fees, the growth appears to have come from three main sources:
- fee revenue from housing loans, which increased by 56 per cent;
- fee revenue from household transactions, which increased by 80 per cent; and
- revenue from merchant-service fees, which increased by 28 per cent.
Unfortunately, because we only have two years of data, it is hard to judge the significance of these developments. It is possible that they reflect classification changes and changes in approach to pricing services. For example, in the case of one bank, the rapid growth of transaction fees was due to the fact that it switched from charging account-servicing fees to a greater emphasis on transaction fees; this was also reflected in reduced revenue from account-servicing fees. At the aggregate level, preliminary data for the first half of 1999 suggest that growth in fee income has returned toward its longer-run average.
Have Increases in Fees Offset Reductions in Interest Margins?
In order to answer this question, we need to express the rise in fees and the fall in interest margins in terms of a common denominator. This is done in Table 6 by expressing the dollar value of account-servicing and loan fees as a percentage of the dollar value of deposits or loans outstanding.
| Current level of fees As a per cent of deposits or loans |
Change in interest margins since 1996 Percentage points |
|
|---|---|---|
| Households | ||
| Deposits | 0.1 | .. |
| Loans | ||
| – Housing | 0.2 | −1.25 |
| – Credit cards | 1.4 | 1.35(a) |
| – Other personal | 0.8 | −2.15(b) |
| Weighted-average | 0.3 | −1.25 |
| Business | ||
| Small business loans | 1.4 | −1.30(c) |
| Large business loans | 0.7 | −0.25(c) |
| Weighted-average | 1.0 | −1.00 |
|
(a) Credit cards with an interest-free period and an annual fee.
(b) ‘Home equity’ loans. (c) Weighted-average interest rate on variable-rate business loans. |
||
The cost to households of account-servicing fees on deposits ($180 million) is estimated to be about 0.1 per cent of household deposits. On loans, fees add a total of about 0.2 of a percentage point to the cost of housing loans, 1.4 percentage points to the cost of credit cards,[7] and 0.8 of a percentage point to that of other personal loans. Overall, these fees are estimated to add about 0.3 of a percentage point to the cost of household borrowing. This is significantly smaller than the contraction in recent years in interest margins on household lending, estimated at 1.25 percentage points.
Table 6 only includes account-servicing and other fees directly levied on deposit and loan accounts as these are the only ones required to run a deposit or loan account. But to get a broader measure, transaction fees should also be added, particularly since they increased appreciably in 1998. The dollar value of transaction fees ($270 million) on retail accounts amounts to about 0.1 per cent of loans. Thus, when the cost of retail transactions of 0.1 per cent is added to all other fees on household loans (amounting to 0.3 per cent of such loans), the level of fees remains well short of the decline in interest margins.
The cost of fees is larger for businesses than households. Fees add about 1 percentage point to business borrowing costs which is comparable with the reduction in margins on business lending in recent years, although loan fees relative to loans outstanding have been around their present level for a number of years and predate the recent fall in margins.
Because the reduction in margins has not been offset by the increase in fees, on average, bank customers have gained from increased competition in banking. But this does not mean that all bank customers have gained. The benefits seem clearest for borrowers, especially household borrowers. Depositors with low balances and a high number of transactions could be worse off.
Why Have Banks' Profits Remained High?
The combination of declining net interest spreads with the steady growth in non-interest income has resulted in operating income of the major banks declining relative to assets for most of the past twenty years – from over 5.5 per cent, in the early 1980s, to 4 per cent in 1998 (Graph 4). There is reason to believe that a similar pattern in this ratio is evident for banks' domestic operations. Other things equal, a fall of this size in income could be expected to result in falling bank profitability. This has clearly not been the case, as bank profitability, however measured, has remained high in recent years.
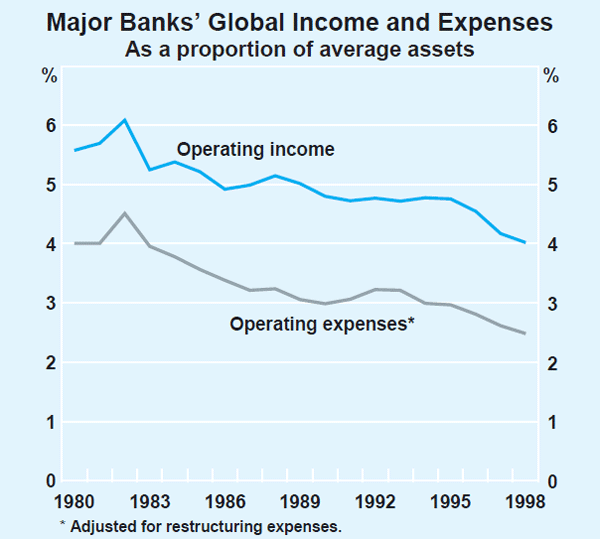
The main explanation for this is that banks have also been able to reduce costs. Relative to banks' assets, expenses have fallen from 4.0 per cent in 1980, to 2.5 per cent in 1998, with a noticeable reduction since the mid 1990s. This cost reduction has, to an important extent, been due to the introduction of new technologies which have enabled banks to reduce the number of staff, and the size and number of branches. One important reason which has allowed staff numbers to be reduced is that customers now rely less on labour-intensive activities than they used to.
Part of the explanation for this is that fees have encouraged individuals and businesses to change their banking habits, by exercising greater economy in the use of transaction services and in the number of bank accounts they run. Growth in the volume of retail transactions has been concentrated in lower-cost, electronic channels, at the expense of cheques (see Table 5 above). Such changes of behaviour would tend to limit the rise in banks' fee-income, while at the same time reducing banks' costs.
How Do Australian Banks Compare Internationally?
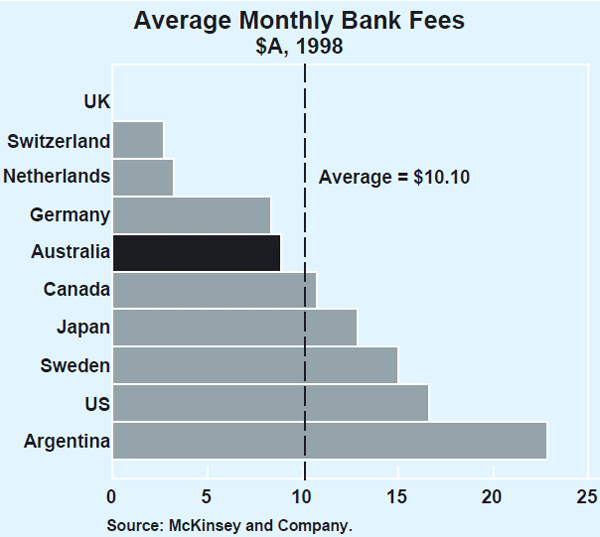
It is difficult to make international comparisons of fee income because of differences in banks' approaches to charging for services in different countries. The best approach to measuring the cost to consumers of bank fees is to take a standard basket of transactions undertaken through different channels, assume an account-servicing fee applies, and find the total cost for a range of countries. This approach was followed in a recent international survey conducted for the Task Force on the Future of the Canadian Financial Services Sector. This survey estimated the level of banking fees that a typical consumer would pay for the same level of banking services in a number of countries (Graph 5). It concluded that such consumers in Australia would pay slightly less than the international average.[8] Of English-speaking countries, Australian consumers would pay more than their British counterparts but less than in Canada and the United States.
Conclusion
While there are some inadequacies in the data, it is possible to reach some tentative conclusions about the role of bank fees. Further research will be required, however. As that proceeds, and a run of yearly data becomes available, the findings should become more definite as they did with the Bank's earlier research on bank interest margins. Bearing this in mind, the main conclusions to date are as follows.
Banks earned about $1.4 billion in 1998 from fees levied on the household sector for account-servicing, loans and transactions. In addition, they earned a further $3.1 billion from fees on businesses, mainly on loans, bill lines and merchant-service fees.
Over the past decade, banks have earned a rising proportion of their total income from non-interest income, with the increase largely coming from fees as opposed to other non-interest income. A major reason for both of these findings is the slower growth of interest income due to declining margins. When the growth of fee income is compared to the growth of banks' total assets, fees have grown no faster than assets for much of the past decade.
The gains in income that banks have made from increases in fees have not been sufficient to offset the decline in margins. In approximate orders of magnitude, since 1996, household customers have benefited to the tune of 1.25 percentage points of total loans from the fall in margins. We do not have the increase in fees over this period as historical data are not available, but it would be smaller than this, as the level of fees from households is only now 0.4 per cent of loans. Thus, on average, customers are better off, although those with small balances and a lot of transactions could be worse off.
Banks have maintained their profitability in the face of falling interest margins, mainly by cutting costs, rather than by raising fees. The imposition of fees may have had its largest impact in deterring customers from many labour-intensive services, rather than by directly raising large amounts of revenue.
From the very limited information available, it seems that Australian banks may now have a structure of fees that would place them toward the middle of the range of comparable countries.
Footnotes
Blainey, G. and G. Hutton (1983), Gold and Paper 1858–1982: A History of the National Bank of Australasia Ltd. [1]
A more complete discussion of banks' interest spreads is contained in Box E of the Semi-Annual Statement on Monetary Policy, November 1997. [2]
See ‘Bank Interest Rate Margins’, Reserve Bank of Australia Bulletin, May 1992. Also see International Comparisons of Bank Margins, a submission by the Reserve Bank of Australia to the House of Representatives Standing Committee on Banking, Finance and Public Administration, August 1994. [3]
See ‘Recent Developments in Interest Rates on Bank Lending’, Reserve Bank of Australia Bulletin, April 1999. [4]
The six banks are the ANZ Bank, the Colonial State Bank, the Commonwealth Bank, the National Australia Bank, St. George Bank and Westpac Banking Corporation; the Reserve Bank had sought information for 1995, 1997 and 1998. Some banks were unable to provide all of these data, however, since several had changed their accounting systems in recent years. Information was available, on a consistent basis, for 1997 and 1998. The six banks account for about three-quarters of deposits in Australia. [5]
Operating income is defined as net interest income (interest received less interest paid) plus non-interest income. [6]
While fees on credit cards look relatively high, as discussed in ‘Consumer Credit and Household Finances’ in this issue of the Bulletin, such fees are the only cost that many borrowers via credit cards pay, since a high proportion of credit card users these days appear to repay such borrowings before they actually incur interest. [7]
See Exhibit 6–25 of The Changing Landscape for Canadian Financial Services, McKinsey and Company, a research paper prepared for the Task Force on the Future of the Canadian Financial Services Sector, September 1998. The general conclusion of the Canadian study is consistent with earlier findings of the Reserve Bank in the submission on International Comparisons of Bank Margins of August 1994 cited above. This submission concluded that, by international standards, Australian banks had relatively less reliance on non-interest income than banks in other English-speaking countries. [8]