Bulletin – April 1997 Supervisory Aspects of Options Pricing
- Download 61KB
Introduction
Derivatives trading, and the trading of options in particular, raises special challenges both for market participants and for supervisory agencies. In contrast to traditional financial instruments, which typically involve outright sales or purchases of assets, options are unique in that they confer the right, but not the obligation, to buy or sell some underlying asset at a pre-agreed price in the future. That novel feature of options makes them an effective and often relatively inexpensive means of providing insurance against uncertain future events. For the buyer of an option downside risk is limited – the most that can be lost is the up-front premium paid for the option. Conversely, the profit to a seller of an option is capped at the premium value, while losses, in theory, may be infinite.
It is the asymmetry in the option's payout, which derives from the uncertainty as to whether an option will or will not be exercised by a buyer, that greatly complicates the task of determining the value of the option and how it will change over time as events unfold. The factors explaining the price of any option are encapsulated in option pricing models. These models have been developed largely from the framework devised by Black and Scholes in the early 1970s.[1]
Using option pricing models, it can be shown that the value of an option depends on five key factors: the current price of the asset to which the option refers, the future price at which the option can be exercised (the strike or exercise price), the time remaining to expiry of the option, a ‘risk-free’ interest rate and the future volatility of the underlying asset price – the extent to which the asset price in question fluctuates over time. This article does not attempt to examine in detail those influences, but it concentrates on the most interesting and complex of the factors – volatility.
Options are now widely used by financial institutions, government bodies, corporates and even individuals both as a means of insuring against future events in asset markets (both physical and financial) and to take outright positions in markets. An understanding of the technical characteristics of options is necessary in order to use options efficiently and prudently. This is especially so for those institutions actively trading options as a means of generating profitability. There are a number of overseas examples of the extent of losses which can result from option trading and it is widely accepted that these activities need to be surrounded by a strong, effective risk management framework.
Volatility and Implied Volatility
Volatility is a measure of the fluctuation in price of an asset over time. There are two closely related ways of looking at volatility: historical volatility and implied volatility.
Historical volatility is the fluctuation of an asset's price over some previous period and it is measured by the observed standard deviation of the asset price over that period. Historical volatility may vary significantly when measured over different time periods. For example, the historical volatility of the All Ordinaries Index of share prices is quite different if measured over the period 1993–97 as compared to 1987–97 which includes the very large price movements associated with the 1987 share market collapse (Table 1).
| Interest rates | Exchange rates | All Ordinaries Index |
Gold | |||
|---|---|---|---|---|---|---|
| 90-day bank bills |
10-year bonds |
AUD/USD | AUD/JPY | |||
| 1995–1997 | 10.41 | 16.53 | 7.28 | 14.34 | 10.90 | 9.33 |
| 1993–1997 | 12.22 | 17.62 | 7.70 | 14.34 | 11.90 | 11.24 |
| 1991–1997 | 12.05 | 16.34 | 7.27 | 13.06 | 12.16 | 19.90 |
| 1989–1997 | 11.39 | 14.89 | 8.13 | 12.99 | 12.62 | 19.27 |
| 1987–1997 | 14.34 | 14.20 | 8.44 | 12.71 | 17.21 | 18.70 |
| Data Sample: 2 January 1987 to 19 March 1997 (90-day bank bills, 10-year bonds, USD/AUD, JPY/AUD, All Ordinaries), 2 January 1987 to 4 March 1997 (Gold). | ||||||
The value of an option is not, however, a function of past price volatility but of the expected price volatility of the underlying asset over the life of the option. The higher the expected volatility, the larger the expected asset price movements and the greater the value of the option. The market's assessment of volatility can be implied from observed market prices for options. All the other variables that go into valuing an option are known, so it is possible to use the option pricing model to obtain an estimate of volatility that the market expects to prevail. Volatility, not price, is the basis on which many standardised options are traded in the market.
Like historical volatilities, implied volatilities vary considerably over time. Graph 1 shows historical volatility based on the daily movement of the All Ordinaries Index over the previous month and implied volatilities derived from options on futures on the All Ordinaries Index from 1987 to 1996. The graph shows periods of quite significant shifts in actual and expected volatility, the most pronounced being around the time of the share market crash in 1987.[2] However, options markets appear to have significantly underestimated the volatility surrounding the crash itself and were also slow to readjust to the lower volatility following October 1987.
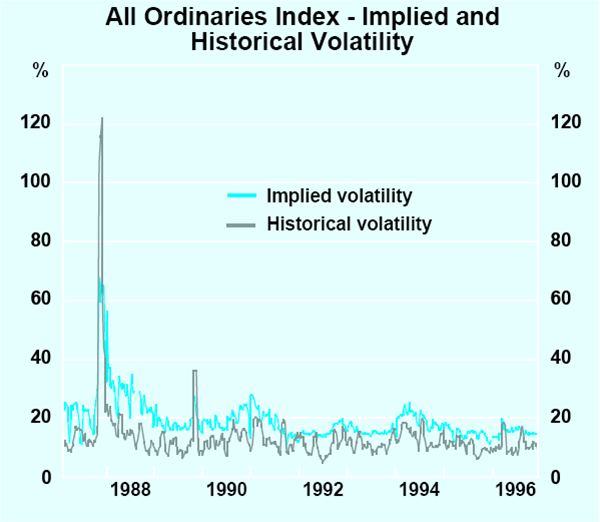
There has been more stability in recent years. Since 1990, the implied volatility on share price index futures has averaged around 17 per cent (which is a little higher than the historical volatility of the index itself over the same period). At current levels of the All Ordinaries of around 2,400, an expectation of 17 per cent volatility means that traders believe that there is around a 70 per cent chance that the All Ordinaries will remain within a range between 1992 and 2808 over the coming year.[3]
Complexities in pricing: the option's strike price
Commonly used option pricing models often assume that volatilities are constant across different strike or exercise prices. In practice, these models are not a perfect representation of the real world and market traders adjust option prices (and hence implied volatilities) to compensate for this simplification.
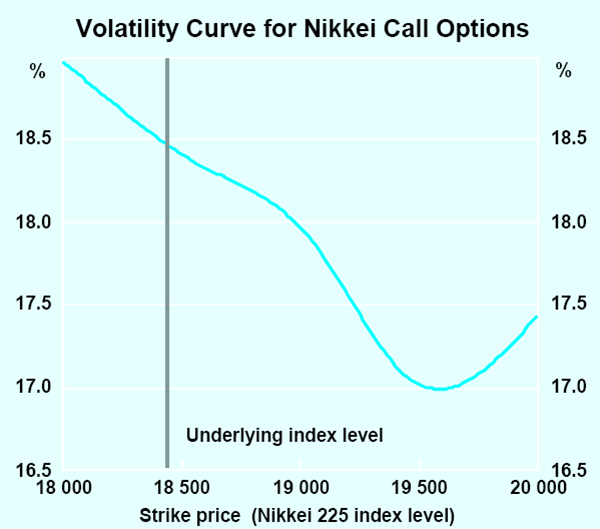
One reason for such departures from the pricing implied by simple option models is that, for some assets, large price movements – both upward and downward – are seen more frequently than the statistical theory underlying most option pricing models would predict (this is known as ‘kurtosis’). The pricing models, therefore, understate the likelihood of options with strike prices well away from the current underlying price being exercised profitably. Markets adjust for this by inflating the implied volatilities. Secondly, in many asset markets there tends to be a predominance of either large falls or large rises in prices. In equity markets, for example, large falls in prices tend to be observed more often than sharp rises: ‘up by the stairs, down by the lift’. The tendency for larger falls than rises in some asset prices results in one side of the volatility curve being higher than the other.
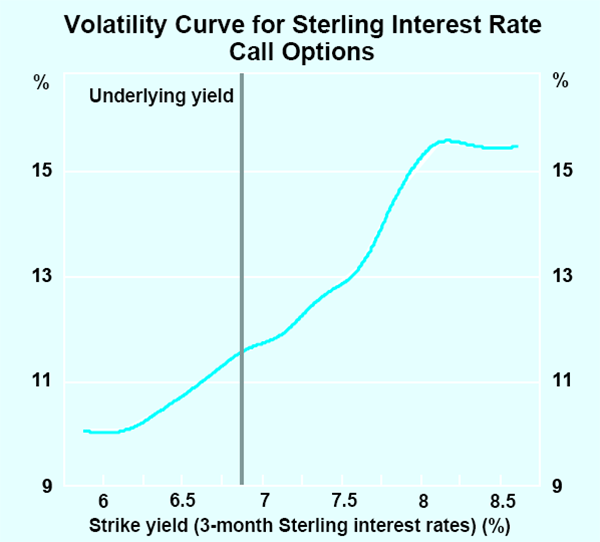
Graphs 2 and 3 show examples of these profiles. The first shows the implied volatilities for options written over Nikkei 225 stock market index futures.[4] Consistent with the pattern described above, options traders appear to attach a greater probability to observing large falls in the Nikkei than large rises. The second volatility curve (Graph 3) is based on options traded on the UK 3-month Sterling interest rate.[5] In this case, the curve exhibits a distinct positive skew, perhaps indicating that the options market traders are expecting rises in the Sterling interest rate over the coming six months.
Other complexities: the term structure of implied volatility
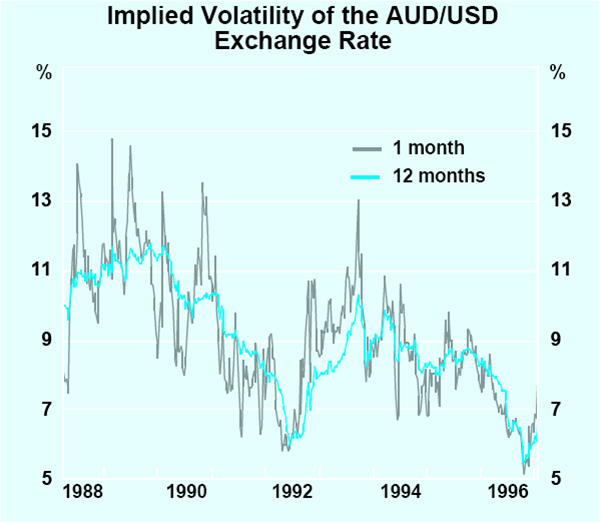
Implied volatility also varies according to the time to expiry of an option. In theory, implied volatility on options with a longer time to expiry should be more stable than that on options with a shorter time to expiry. This is because spikes in the movement of the underlying asset price are more likely to average out over time as the forecast horizon lengthens. Graph 4, which shows implied volatilities quoted for foreign exchange options with one month and with one year to expiry, broadly confirms this pattern.
In the case of options over interest rate instruments, the term structure of implied volatility presents an additional complication. As well as the time to expiry of an option itself, the time to maturity of the underlying debt instrument must also be taken into account. An option which expires in one year's time written over a three month security will have quite a different implied volatility to an option which expires in one year's time written over a ten year security.
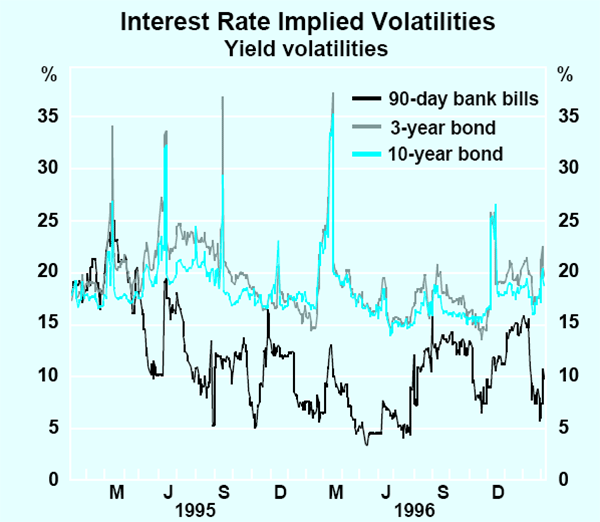
Graph 5 shows implied volatilities for options written over interest rate instruments of different maturities – 90-day bank bills, 3-year government bonds and 10-year government bonds. Consistent with the historical volatilities shown in Table 1 over the past two years the volatility on 90-day bank bills has tended to be lower (averaging 11.7 per cent) than that of 10-year bonds (which averaged 18.2 per cent). The sharp upward spikes in the implied volatilities of the bond option contracts correspond to the maturity of the contracts, reflecting the fact that as the option contracts approach maturity the market for these options become relatively illiquid as the bulk of market activity is rolled into longer dated contracts. As the market becomes less liquid these very short dated options become very expensive, the high price being expressed in terms of high volatilities.
Implied Volatility and Option Values
Changes in implied volatility of a magnitude regularly seen in the markets can lead to very large differences in option price. For example, Graph 1 showed that implied volatilities on All Ordinaries Index futures ranged between 12.75 per cent and 21.5 per cent during 1996. For an at-the-money call option with a term to expiry of three months over the All Ordinaries Index futures, increasing volatility from the lowest to the highest 1996 level would have led to a 57 per cent increase in the value of the option.
Similar results can be obtained from considering the effects of a change in implied volatility on an option over a $1 million bank bill futures contract. Following the easing in monetary policy in July 1996, implied volatility fell by almost half – from 12.2 per cent to 7.3 per cent. Given a market interest rate of 6%, an exercise price of 6%, a risk free rate of interest of 4% and time to expiry of one year, and using the standard Black model for pricing options over futures,[6] the value of the option would fall 45 per cent in response to the drop in volatility.
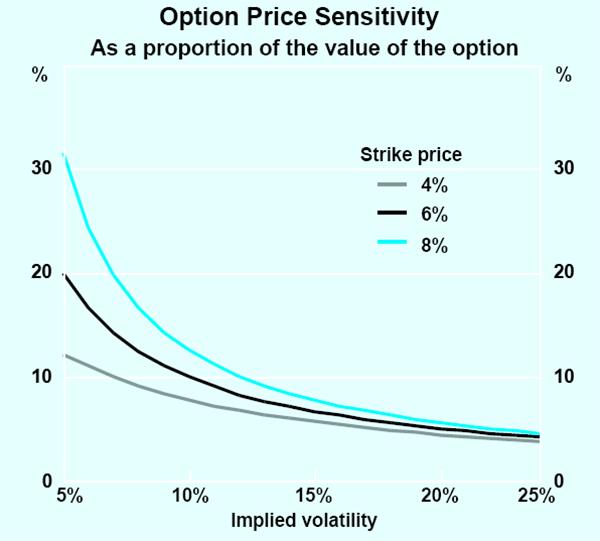
The sensitivity of an option's value to misquoting will depend not only on the absolute size of the position but also on other characteristics of the instrument. For example, Graph 6 shows the change in the value of an option, relative to its original value, for changes in implied volatility. The comparison is made for three options over bank bill futures with strike prices of 4, 6 and 8 per cent respectively (while the underlying market rate is 6 per cent). This sensitivity to a change in implied volatility is quite different at different levels of volatility and varies with the different strike prices.
Policy Implications
The complexity of the relationship between option prices and market factors is at the heart of much of options risk management. For example, as a short-cut traders may assume that all options over a given asset have the same implied volatility, regardless of the option's time to expiry. This could result in mispricing of individual option contracts and errors in the valuation of a total portfolio. Ultimately, systems of risk measurement (both for credit and market risk) rely heavily on accurate portfolio valuation. Risk managers need to have a good understanding therefore of the effects of such simplifying assumptions on the accuracy of portfolio valuations and risk measurements. Supervisors emphasise the need for risk managers to review regularly the assumptions that form the basis of option pricing models to ensure that they remain appropriate.
Similarly, risk managers must be mindful of the known shortcomings of pricing models and situations where the underlying assumptions do not hold. There is no such thing as a perfect option pricing model at present, nor is there likely to be in the future – all models are based on some simplifying assumptions. It is up to risk managers to ensure that those simplifications do not result in material misstatement of risk exposures.
The complexity associated with the use of options underscores the need for any option trader to have risk managers and back-office staff with strong expertise and a good understanding of the technicalities surrounding the operation of options markets if they are to adequately act as a check on dealers' risk taking.
Just as it is important for the institutions trading options to verify the accuracy of their pricing and risk management models, it is equally important for supervisor s to understand how institutions price and manage these products. Over recent years, the Reserve Bank has moved to strengthen its analysis of banks' trading activities, including trading of options. The development of the market risk capital requirements and on-site visits conducted by the Bank to review the market risk taking activities of banks (both in their trading activities and in their broader banking business) has mirrored closer scrutiny of such activities by supervisory bodies internationally.
Since 1988 banks have been required to hold capital against credit risks, including on their options portfolios. From the end of 1997, banks will be required to hold capital explicitly against the market price exposures arising from options and other trading positions. Moreover, for any options trading other than trading of very simple options portfolios, the market risk arrangements will also require that the models banks use to price options be subject to Reserve Bank scrutiny before they may be used to assess how much capital must be held.
A central bank's interest in option pricing and volatility does not derive solely from its supervisory responsibilities. Implied volatilities reflect market participants' expectations about future asset prices and may therefore be useful in indicating market views about future monetary policy directions and fluctuations in the rate of inflation. The shape of volatility curves can also provide some indication of the relative probabilities markets are attaching to different market outcomes. Central banks can gain information from the analysis of implied volatilities for different assets in order to improve their assessment of financial market and asset market conditions and in setting and implementing policy changes.[7]
Footnotes
Black, F. and M. Scholes (1973), ‘The Pricing of Options and Corporate Liabilities’, Journal of Political Economy, 81, May/June, pp. 637–654. [1]
It should be noted that these two series are not exactly comparable. The historical volatilities were calculated using the index itself while the implied volatilities were derived from options over share price index futures. It is to be expected that there will be greater uncertainty surrounding the futures price than the index itself, hence the tendency for the implied volatility in Graph 1 to lie slightly above the historical volatility. [2]
This range is based on the assumption that traders believe that changes in the All Ordinaries Index follow a normal statistical distribution. The following sections demonstrate that may not be a good assumption. [3]
The implied volatilities were calculated based on options prices reported in the Asian Wall Street Journal for close of business on the 3rd of March 1997. The options had one month until expiry. [4]
The volatilities were obtained from the London International Financial Futures Exchange (LIFFE) end of day pricing sheets for close of business on the 18th of March 1997 as posted on LIFFE's internet site. The options have six months until expiry. [5]
Black, F. (1976), ‘The Pricing of Commodity Contracts’, Journal of Financial Economics, September, pp. 167–179. [6]
For further discussion see, for example, Söderlind, P. and L. Svensson (1997), ‘New Techniques to Extract Market Expectations from Financial Instruments’, Centre for Economic Policy Research, Discussion Paper No. 1556. [7]