Bulletin – April 1993 Financial Markets and the Economy in the March Quarter
- Download 549KB
Overview
The world economy is still characterised by divergence among key regions, and sluggish growth overall. Recovery in the United States is consolidating and growth in East Asia remains robust. The Japanese and German economies, on the other hand, have contracted further over recent months.
The Australian economy is growing at around 2½ per cent, with some modest acceleration in prospect. Substantial excess capacity and high unemployment continue to restrain price and labour cost pressures, and are likely to do so for some time. The ‘headline’ CPI will rise more quickly in 1993 than in 1992 as a result of increases in State Government taxes and charges, the diminished influence of falling interest rates on mortgage costs and the absorption of the fall in the exchange rate over the past year. Low underlying inflation should still be maintained, however, and medium-term prospects for low inflation are good. Inflationary expectations are still coming down.
The Bank had been of the view for some months that a fall in cash rates would lend some support to the recovery without jeopardising medium-term inflation prospects. The improved tone of financial markets during February and March lifted the main constraint on earlier action and cash rates were reduced by 0.5 percentage point, to around 5.25 per cent, on 23 March.
The International Economy
Economic Activity and Prices
Trends in economic activity in the three major economies are diverging further during 1993 (Graph 1).
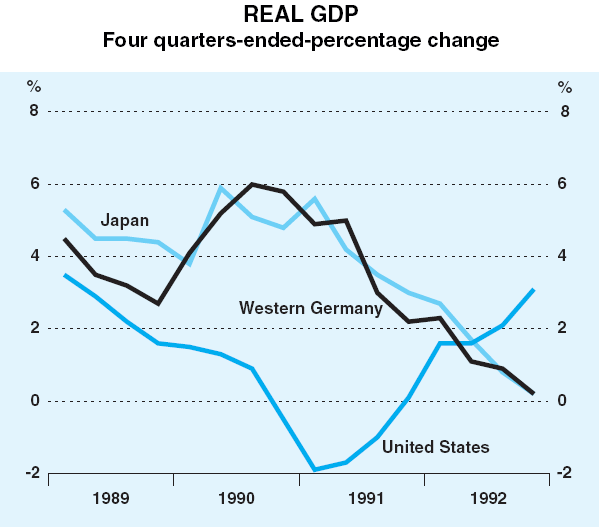
Economic recovery in the United States has continued, with real GDP expanding by 4.7 per cent (at an annual rate) in the December quarter of 1992. This unusually strong pace has not carried over into the March quarter, but key indicators such as industrial production and retail sales are clearly still on an upward trend. Non-farm employment, which had been the weak point of the recovery to date, rose sharply in February but dropped back slightly in March. The unemployment rate has fallen from a peak of 7.7 per cent to 7 per cent currently.
The medium-term fiscal policy of the Clinton Administration took shape in the President's Economic Statement in mid February. A short-term stimulus package was announced, together with measures to reduce the Federal budget deficit over a four-year period. The strategy was well received by the markets.
In contrast to the recovery in the United States, economic conditions in Japan and especially Germany are very weak. In the fourth quarter of 1992, real GDP fell by 0.8 per cent in western Germany and by 0.1 per cent in Japan. For both economies, this was the third consecutive quarterly fall. Available indicators suggest that the weakness continued in the March quarter (Graphs 2 and 3). As a result, demand for labour has weakened. In Germany, the unemployment rate and the number of workers on short shifts have risen sharply. The level of unemployment in Japan has also risen in recent months, and a certain amount of pessimism persists.
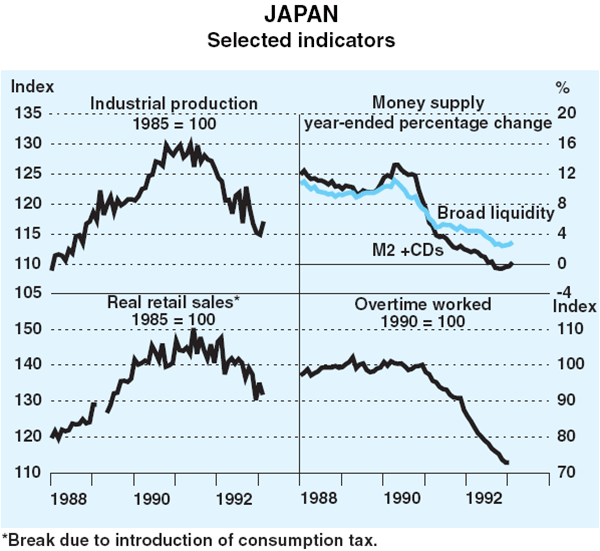
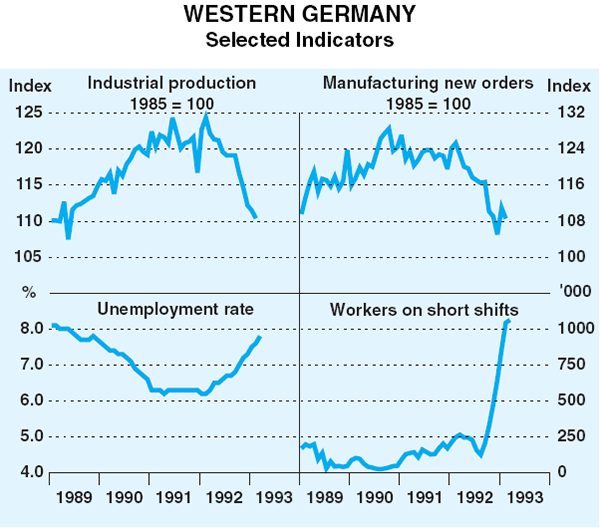
Inflationary pressures remain subdued in most countries and are probably easing a little in Germany despite poor results in the first few months of 1993. Given two years of below-capacity output in the United States, the moderate pick-up in activity should not quickly create inflationary pressures. The CPI is currently increasing at an annual rate of a little over 3 per cent. Inflation remains very low in Japan at just over 1 per cent per year. The growing slack in German labour markets appears to be exerting some downward pressure on wages, which should result in a reduction in underlying inflation in due course.
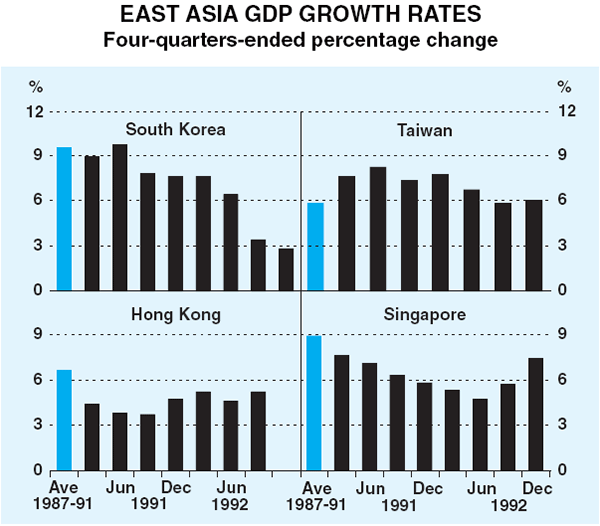
Growth rates of Australia's main Asian trading partners continue to be faster than those of the major industrialised countries in the OECD (Graph 4). While the Korean economy has slowed noticeably, real GDP in Hong Kong, Taiwan and Singapore expanded at a rapid pace in the year to the December quarter 1992. China recorded growth of around 12 per cent in 1992, although this has prompted concerns over strong price pressures. As growth in the South-East Asian region is underpinned by strong domestic demand and intra-Asian trade, this augurs well for Australian exporters, and should complement a pick-up in demand from the United States as the recovery there progresses.
Financial Markets
The changing economic outlook in Germany saw the Bundesbank take steps to ease monetary conditions several times during the quarter. The adjustments were, however, smaller than expected. Short-term interest rates in Japan also declined as official interest rates were lowered in February in response to weakening economic conditions. There was little change in short-term rates in the United States.
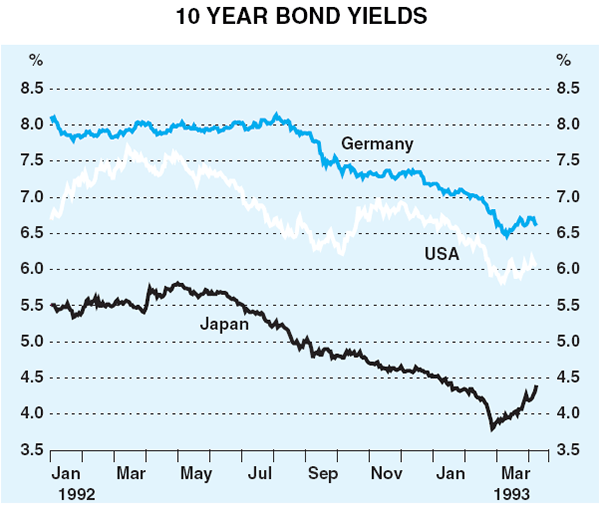
A feature of the first two months of the March quarter was the rally in major bond markets (Graph 5). In the US, the main factor was the new Administration's fiscal policies. Easier monetary policy and domestic economic weakness were contributing influences to lower bond yields in Japan, Germany and most other European countries.
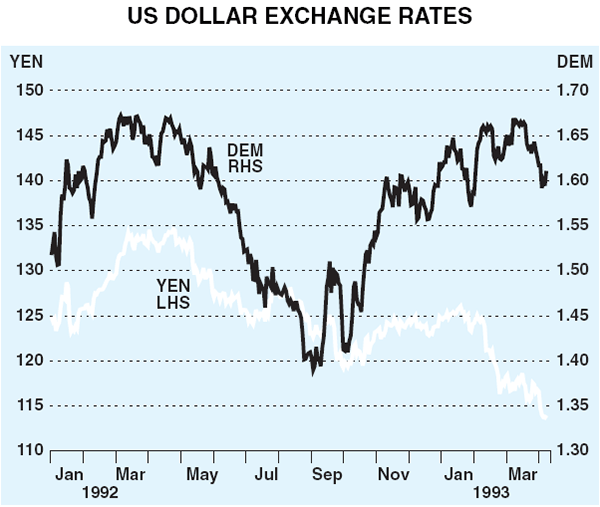
Signs of a pick-up in economic recovery in the United States and expectations of cuts in interest rates in Germany caused the US dollar to rise against the German mark over the first two months of the quarter (Graph 6). This was reversed in March and early April, however, as it became apparent that reductions in German rates would be smaller than earlier expectations. The yen strengthened sharply against all currencies during the quarter. Part of the rise reflected buying of yen by market participants in anticipation of co-ordinated intervention by major countries to move the yen higher as a way of dealing with the large Japanese current account surplus. The rise gathered pace late in the quarter, amid reports that Japanese investors were cutting back on their overseas investments ahead of the end of their financial year. Over the quarter, the yen rose by 8 per cent against both the US dollar and the German mark.
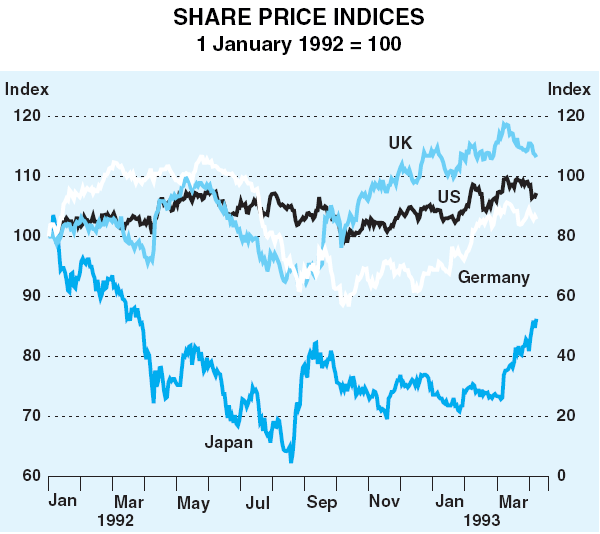
Most major share markets rose over the quarter in response to expectations of lower interest rates in Europe, signs of sustainable recovery in the US and further substantial fiscal stimulus in Japan (Graph 7). Share prices rose by 10 per cent in Japan, 11 per cent in Germany and 4 per cent in the US. In the UK, they rose strongly for much of the period, but fell back following the Budget Statement in mid March to end 1 per cent higher.
The Domestic Economy
Demand and Output
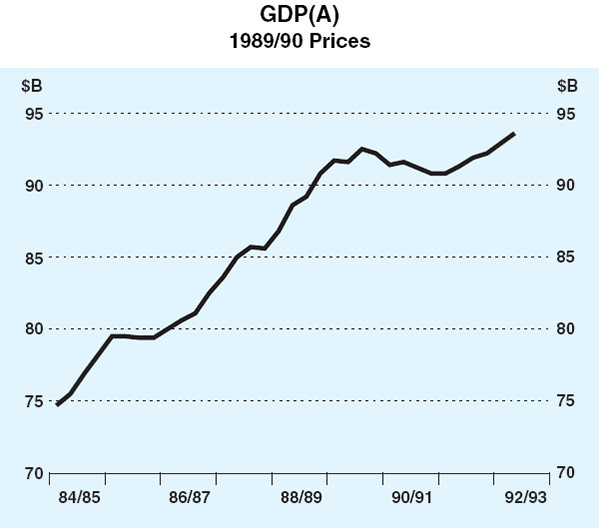
National Accounts data for the December quarter point to a continuation of the 2 to 3 per cent rate of growth recorded over the past year (Graph 8). The average measure of GDP grew by 0.7 per cent in the quarter. Consumer spending was relatively sluggish, in part reflecting a change in shopping patterns (see below). The cyclical expansion in dwelling investment continued and there was a large rise in business investment. Although this latter change reflected a number of one-off factors, underlying investment appears to have increased for the first time since mid 1989. Exports of goods and services recorded a solid rise, more than offsetting a moderate rise in imports, so that net external demand contributed strongly to growth. The expansion in domestic and foreign demand was partially met by a rundown of stocks, however, equivalent to half a per cent of GDP.
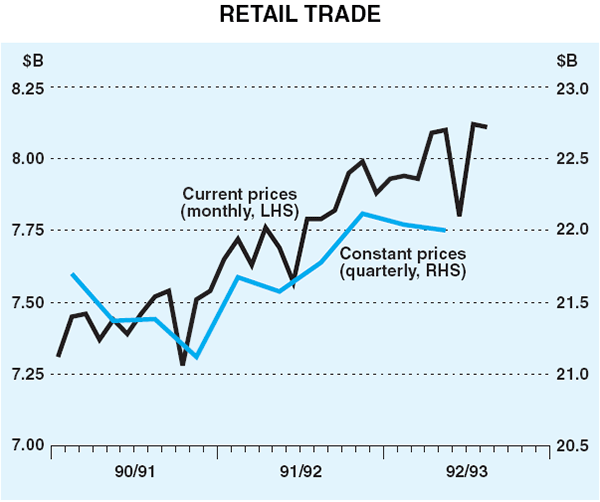
Partial indicators for the March quarter point to the continuation of moderate growth, although changes to seasonal patterns have complicated the interpretation of some series. The value of retail trade rose by 4.2 per cent in January, more than reversing the large fall recorded in December (Graph 9). This pattern reflects a deferral of purchases traditionally made in December until the sales in January. February figures recorded a marginal fall. Taken together, these figures suggest a moderate rise in the March quarter, after two weak quarters.
Registrations of passenger vehicles fell by 2.6 per cent in January and a further 0.6 per cent in February. Average registrations in the first two months of 1993 were 2 per cent below the monthly average for the December quarter. There have been sharp swings in consumer sentiment, as measured by the Westpac/Melbourne Institute survey, but sentiment has shown some modest uptrend in recent months.
Residential construction continues to expand. The number of private dwelling commencements rose by 2.8 per cent in the December quarter following a rise of 5.1 per cent in the previous quarter. Building approvals for dwellings in the three months to February were 3.9 per cent higher than in the previous three months, suggesting a further small rise in commencements in the first quarter of 1993. The real value of non-residential building approvals rose by nearly 30 per cent in the December quarter. While the latest rise reflects a number of large projects, it is possible that the decline in non-residential construction activity may be coming to an end.
The latest ACCI-Westpac survey of the manufacturing sector suggested a small improvement in activity and business sentiment in the March quarter. The expectation is for further improvements in the general business outlook in the June quarter, although actual outcomes for output and new orders continue to fall short of expectations.
The December quarter ABS survey of capital expenditure suggested that spending plans for 1992/93 had been revised up slightly but remain a little below the corresponding expectation a year earlier. The first reading on expected spending in 1993/94 was also quite weak, although the historical evidence is that actual spending is generally stronger than the initial estimates suggest.
Labour Market
Employment numbers have swung widely in recent months (Graph 10). The rise of 62,400 in January was followed by a fall of 66,900 in February. In March, employment rose by 68,100. Between December and March, employment rose by 63,600 or 0.8 per cent. The change in spending patterns around Christmas may have added to the volatility of the monthly figures. Post-Christmas sales are likely to have encouraged retailers to retain casual staff for longer than usual, thereby boosting measured employment in January and reducing it in February. The rate of unemployment remained around 11 per cent.
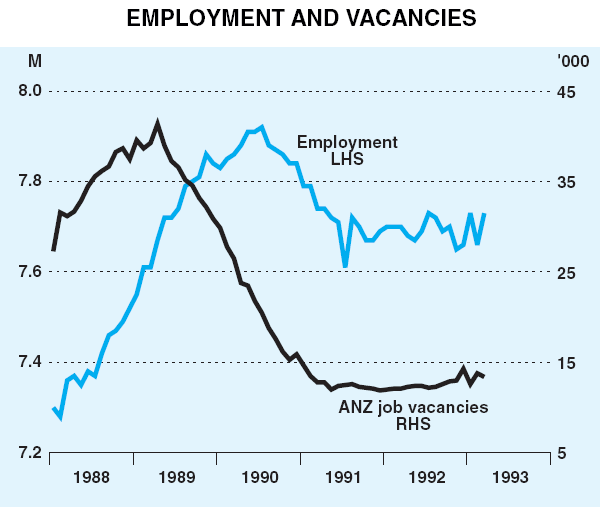
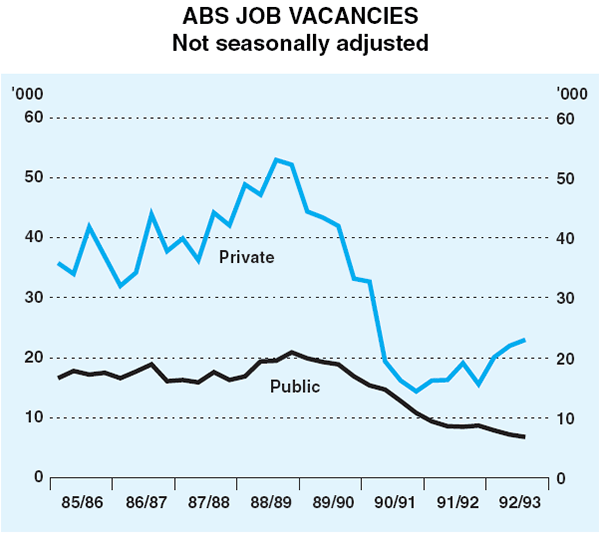
Forward employment indicators show some signs of strengthening in the demand for labour in the private sector, although the picture varies considerably among regions. The ABS survey of job vacancies showed a fall in the total number of vacancies between November and February, but this fall was concentrated in the public sector (Graph 11). In the private sector, vacancies rose by 4.5 per cent (not seasonally adjusted), to be about 20 per cent higher than a year earlier. The ANZ measure of job vacancies also shows an upward trend, and in March was 11 per cent higher than a year earlier. Overtime hours worked per employee across the economy rose by 3 per cent between November and February, to be 3.8 per cent higher than a year earlier.
Prices and Costs
Inflation remains low (Graph 12). The Consumer Price Index rose by 0.5 per cent in the December quarter and by only 0.3 per cent through 1992. After removing the effects of volatile items such as petrol, fresh fruit and vegetables, and interest charges, the CPI rose by 0.8 per cent in the quarter and by 2.0 per cent over the year to December. Prices of privately-provided goods and services rose by 1.9 per cent during 1992.1 All these measures were boosted by a large rise in taxes on tobacco in the December quarter which contributed 0.2 percentage point to the total CPI. Further increases in government taxes and charges will push up the CPI over the next couple of quarters.
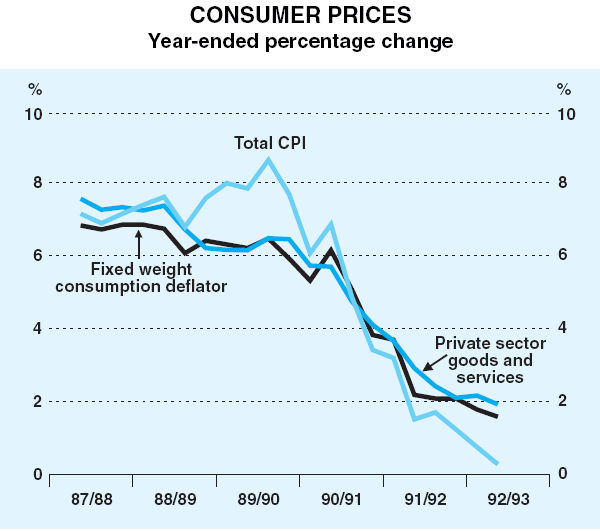
Implicit price deflators in the December quarter National Accounts confirm the picture of low inflation. The fixed-weight consumption deflator rose by 0.6 per cent in the December quarter and by 1.6 per cent over the year. The more broadly-based deflators have grown by 1 to 2 per cent over the past year.
Sectoral price indicators continue to show some pressure on import prices arising from the depreciation of the exchange rate during the first three quarters of 1992 (Graph 13). There was a further significant rise in the import price index in January. The price index for imported materials used in manufacturing rose at a slightly slower pace. These pressures should moderate over the next few months if the exchange rate stays around current levels. Total manufacturing input prices fell, a result of lower oil prices. Manufacturing output prices picked up a little in January, after three months of little or no increase. Prices of construction materials remained flat.
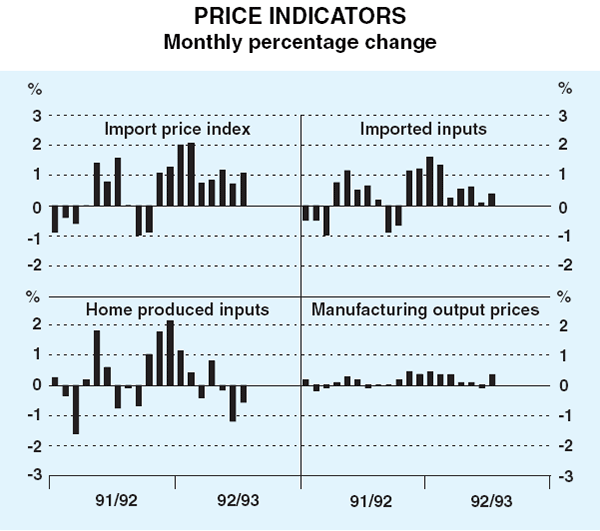
Measures of inflationary expectations have generally fallen further. The Melbourne Institute measure fell by 0.5 of a percentage point to 4.3 per cent in the March quarter. Consensus forecasts for inflation in 1993 and 1994 have been revised down again. Eighty-five per cent of respondents to the ACCI-Westpac survey reported that their selling prices fell or remained unchanged in the March quarter and three-quarters of those surveyed expect a similar result in the June quarter.
Rises in labour costs remain very subdued. A number of major enterprise agreements, such as within the Australian Public Service and Telecom, have recently been negotiated. To date, almost 1,000 agreements have been ratified by Federal and State Industrial Commissions covering close to 10 per cent of the labour force. Despite these settlements, overall wages were static in the final months of 1992 so that ordinary-time earnings of full-time adults in the private sector rose by only 0.3 per cent over the year (Table 1).
| 1990 | 1991 | 1992 | |
|---|---|---|---|
| Awards | 5.1 | 3.5 | 0.9 |
| Ordinary-Time Earnings (OTE) | 7.5 | 4.2 | 1.4 |
| Private OTE | 6.9 | 3.8 | 0.3 |
| Unit Labour Costs | 7.2 | 2.6 | 0.2 |
Money and Credit
Credit provided to the private sector has been growing since the middle of 1992 and is now slightly higher than it was a year earlier. This has been underpinned by sustained strong growth in housing credit, a result of falling mortgage rates, competition among banks for mortgage borrowers and the relatively good balance sheet position of the household sector. Business credit, on the other hand, remains weak. Despite the small rises in January and February, business credit outstanding is still 4½ per cent lower than its level a year ago, as firms shed debt in an effort to repair their balance sheets. This process has some counterpart in relatively large equity raisings during the past year, although raisings in January and February were lower than for any month in 1992.
For some time, growth in the broad money aggregates has been sluggish, in line with the fact that intermediaries needed relatively little in the way of new funding for asset expansion. This trend continues. The narrow aggregates show stronger growth. Currency is rising at around 6 per cent per annum, consistent with modest growth in nominal spending. M1 growth is, on average, faster than this, and quite volatile, a reflection of the trend to lower interest rates over the past couple of years and the effects on the statistics of financial innovation.
Government Finance
The mid-year review of the Commonwealth budget suggested that the deficit for 1992/93 will be higher than the $13.4 billion predicted at Budget time. The source of the upward revision is mainly on the revenue side, with weaker-than-expected employment and income growth leading to a shortfall in income tax collections. Factors pushing up outlays include higher unemployment benefits and a delay in the public float of Qantas/Australian (proceeds of which are recorded as ‘negative outlay’).
With the higher Commonwealth deficit, the total net Public Sector Borrowing Requirement for 1992/93 is likely to exceed earlier estimates of about 4¾ per cent of GDP. Excluding asset sales by the Commonwealth and State Governments, the ‘underlying’ PSBR – the true call on private and foreign savings by the government sector – could be around 6 per cent of GDP in 1992/93, compared with 4¼ per cent in 1991/92.
Balance of Payments
In the three months to February, the current account deficit averaged around $765 million per month, a substantial fall from $1.3 billion average for the previous three months. This reduction in the deficit reflected improvements in both the trade balance and the income deficit. Imports were unusually high in October and November because of the impact of large one-off items, such as civil aircraft, an Optus satellite and some equipment for the North-West Shelf project. Even abstracting from these lumpy items, however, the trend increase in imports appears to have slowed sharply over the past few months. This partly reflects the more stable exchange rate, after valuation effects of the earlier fall in the $A had pushed up import values during the second half of 1992, but import volumes also appear to be rising at a slower pace than earlier in the recovery. As such, they are more in line with growth in domestic demand.
Exports have continued to record solid growth, despite monthly volatility. This picture was confirmed by the substantial upward revisions to figures for exports in the December quarter which were released with the January statistics. Revisions were also announced for the net income accounts, which reduced earlier estimates of the deficit considerably. As a result of all these trends, the current account deficit over the eight months to February ran at an annual rate of around $13 billion.
Over the eight months to February, there was substantial capital inflow from government borrowing abroad. To date, the bulk of government borrowing abroad has been undertaken by the State governments who have raised about $6.0 billion over the eight months to February. $1.9 billion inflow has come from foreign purchases of domestic securities. There was further inflow from sales of official reserve assets by the Reserve Bank. Official net inflows came to $12.9 billion. The non-official sector (including the balancing item) recorded a net outflow of $3.2 billion.
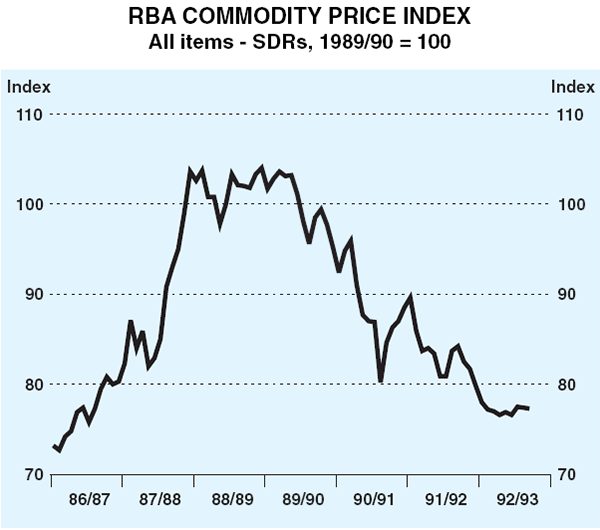
Prices for Australian commodities appear to have stabilised over the past six months, after a consistent decline during the preceding six months (Graph 14). The Bank's Index of Commodity Prices rose slightly during the March quarter, although it has yet to show any convincing rise. In particular, base metals prices, which would be expected to pick up quickly in response to a rise in industrial demand abroad, and which had shown some rises late in 1992, had fallen back by the end of the March quarter.
Financial Markets
Financial markets were unsettled in January as the exchange rate came under further downward pressure. As the quarter progressed, however, there was a marked turn-around in sentiment: bond yields fell, and the exchange rate and share prices rose. This improved sentiment mainly reflected increased confidence about the outlook for world economic growth (stemming largely from the recovery in the US) and a desire by foreigners to rebuild their holdings of Australian assets in anticipation of benefits that would flow from an expected strengthening of commodity prices.
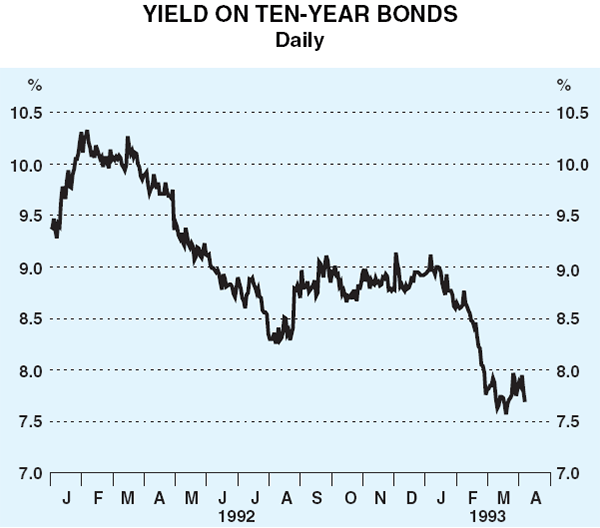
Australian bonds, yields on which had been high by world standards, given the low rate of inflation in Australia, were a particular source of interest to overseas investors. Yields fell sharply over the quarter, falling from a high point of 9.1 per cent for 10-year bonds in early January, at one point reaching 7.6 per cent (Graph 15). The sharemarket also benefited, with prices rising by 8 per cent over the quarter. The exchange rate, which had fallen to a low of US66.3 cents (TWI 50.7) in late January, recovered strongly after mid February, reflecting the strong overseas demand for Australian assets (Graph 16).
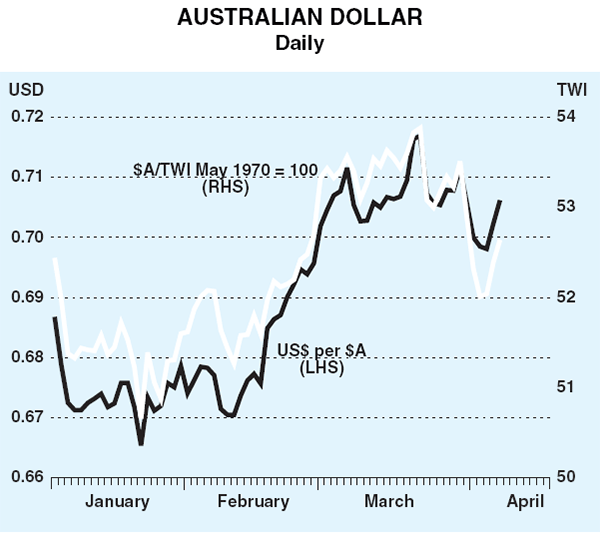
Against the backdrop of such bullish sentiment, the Federal Election and the easing in monetary policy in late March passed without drama. Late in the quarter, however, selling of Australian dollars by Japanese investors ahead of the end of their financial year saw the exchange rate soften. The markets were also unsettled by the possibility of continued large budget deficits. The exchange rate ended the quarter at 52.9 in trade-weighted terms, and then weakened a little further in early April to much the same as the level at the end of December. Against the US dollar, however, the Australian dollar remained well up on its end December levels, at around US70 cents.
The Bank was a net buyer of Australian dollars in January when the exchange rate was under pressure, but the better tone to the market after January meant that the Bank made no net purchases in February and March.
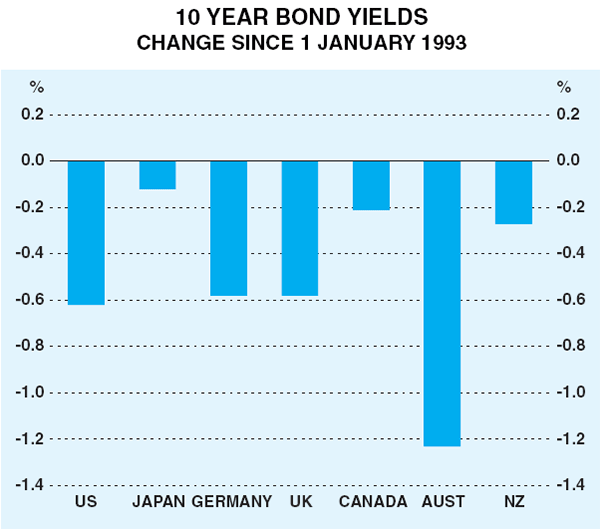
Yields on 10-year bonds ended the quarter at 7.8 per cent, down from 9 per cent at the start. Australian bond yields fell more than in other countries during the quarter (Graph 17), but they remain relatively high in international terms.
Banks responded to the cut in cash rates of 0.5 per cent by cutting most loan interest rates by the same amount. The average cut in deposit interest rates was smaller. Major banks' benchmark rates on business loans now range between 9.5 and 10.0 per cent. Rates on standard (variable-rate) housing loans are currently 9.5 per cent. Most of the major lenders continue to have special offers for new borrowers in both the housing and small business loan sectors.