Speech The Reserve Bank's Policy Actions and Balance Sheet
Australia is experiencing an historic event. It is first and foremost a health event. Thankfully, thus far the health outcomes in Australia have been better than feared. The health decisions taken by the government and the public in response to the virus have been the primary shaper of the economic and financial landscape that the Reserve Bank has been operating in.
The virus has had a large economic and financial impact. The decline in output in the second quarter in Australia and around the world has been extraordinary, as significant parts of the economy were shut down. The decline in output is much larger and much more widespread globally than we saw in 2008. Accompanying this, there has been a large decline in hours worked. Unemployment has risen sharply, although the extent of the rise in the unemployment rates has varied around the world depending on the nature of the support provided by governments (as well as some definitional differences). In Australia, the rate of unemployment is high at 7 per cent, but has been materially contained by the JobKeeper package that has helped to maintain the employment relationship between workers and businesses. This will help considerably in the recovery.
Overlaid on top of the health and economic developments was a full-scale financial market disruption in March. Again this was global in nature, most notably including the dislocation to the US Treasury market, which serves as a critical pricing benchmark for global financial markets. There was an imperative to prevent a financial crisis exacerbating the significant impact of the health and economic shocks.
In that environment, policy actions were taken in Australia on multiple fronts including fiscal, monetary and prudential. Reflecting these policy actions and the health outcomes, the Australian economy has turned out to be somewhat better in the June quarter than feared. While the outcomes to date have been better than expected, it is important to remember that the declines in GDP and in hours worked have still been historically large.
The objective of the monetary policy response is to support the economy by keeping borrowing costs low and credit available for households and businesses, complementing the necessary and large fiscal policy stimulus. It has also sought to address the disruption in financial markets, particularly in the government bond market, given the central role that the market plays in underpinning the interest rate structure in the Australian financial system. The response had a number of elements.
- A reduction in the cash rate target to 25 basis points. This is the level the Reserve Bank Board has assessed to be the lower bound for the target cash rate in the current circumstance. In saying that, we fully expected the actual cash rate to move below 25 basis points, as it subsequently has. I will explain this shortly.
- A target for the yield on three-year Australian Government bonds of around 25 basis points. The Reserve Bank commenced a program of buying government bonds to achieve that target and also to address the dysfunction in the market for both Australian Government bonds and the bonds of the state governments (semis).
- The Reserve Bank's daily market operations were expanded in size and in maturity in response to the large increase in demand for liquidity from the banking system.
- A Term Funding Facility (TFF) for the banking system to provide three-year funding at a rate of 25 basis points. This was complemented by the Australian Office of Financial Management's (AOFM's) program to support non-bank lenders.
- Setting the rate paid on Exchange Settlement (ES) balances at the RBA at 10 basis points.
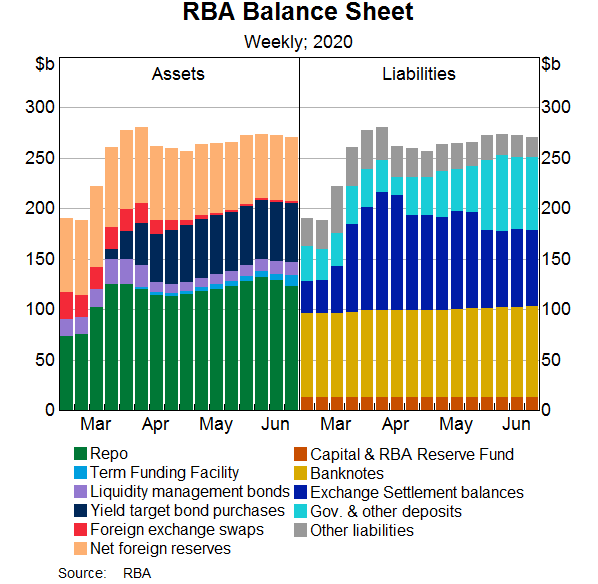
In the rest of this talk, I will explain these policies in more detail and provide an assessment of their effectiveness thus far. These policies have also had a material impact on the size and the composition of the Reserve Bank's balance sheet, which I will describe (Graph 1).[1] I will also explain the other main influence on the size of the RBA's balance sheet, which results from the fact that the RBA is the banker for the Australian Government.
Reduction in the Cash Rate Target to 25 Basis Points
The reduction in the cash rate target to 25 basis points is standard monetary policy. It has affected the interest rate structure of the economy in a similar way to other earlier reductions in the cash rate target.
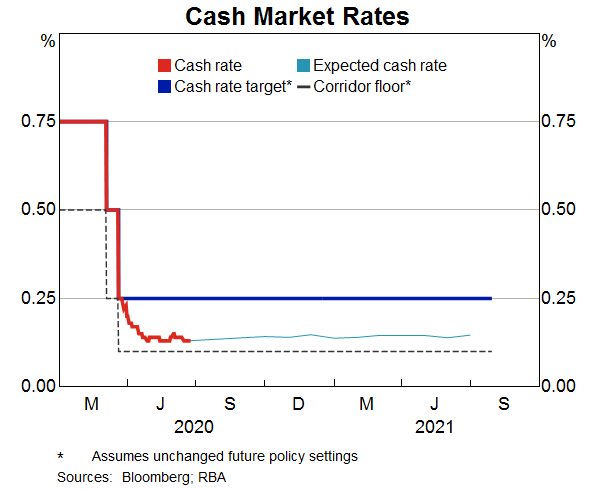
However, while the cash rate target has remained at 25 basis points, the actual cash rate traded in the market has declined to around 13–14 basis points currently.[2] This decline in the cash rate was expected and is consistent with the aim of reducing funding costs in the Australian economy. It reflects the large amount of ES balances in the system. I will come to the reasons why ES balances are high shortly. But with high ES balances in the cash market, the supply of these balances is large relative to demand. Hence, as in any market, with supply greater than demand, the price to clear that market, the cash rate, has declined.[3]
The cash rate is higher than the rate of return on ES balances of 10 basis points. Banks are incentivised to lend their excess ES balances held at the RBA but the transaction costs and greater credit risk involved mean that they are generally willing to do so only if they can earn a return a few basis points more than they get from leaving their balances on deposit at the RBA at 10 basis points.
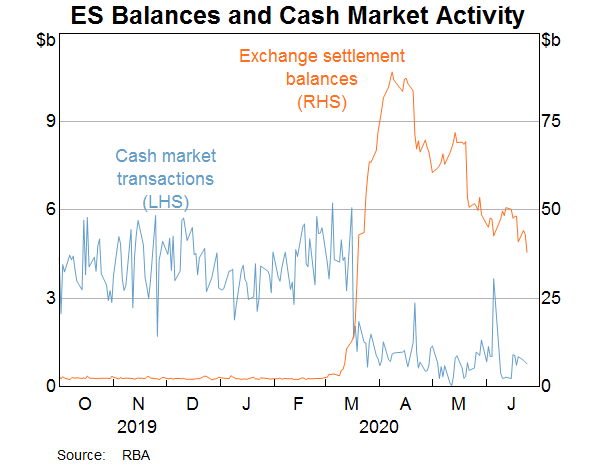
The transaction volumes in the cash market have declined (Graph 2), reflecting the fact that on any given day most banks have enough ES balances to meet their liquidity needs. But depending on the distribution of payment flows throughout the day, even with large ES balances, some banks may still need to borrow at the end of the trading day to ensure their ES balances remain positive.[4] It is worth remembering that the banking system as a whole has to hold the level of ES balances supplied by the Reserve Bank. So while any individual bank may try to lend their excess ES balances, at the end of the day, some bank in the system has to hold them.
The higher level of ES balances in the system has not only meant that the cash rate trades closer to the rate the Reserve Bank pays on these balances, but also anchors other money market rates such as short-term repos (repurchase agreements), foreign exchange (FX) swaps and bank bills. With these money market rates anchored, the full spectrum of borrowing rates for households, business and governments is also at historically low levels. I will come back to this later.
It is worth noting that once the supply of ES balances is sufficiently high to lower these rates towards the rate on ES balances, the exact amount of ES balances has little effect on where the cash rate and other money market rates trade. That is, additional ES balances do not tend to lower market rates any further. Nor does a reduction increase market rates as long as ES balances remain sufficiently high. Since late March, ES balances have moved in a very wide range between $40 billion and $90 billion without having a noticeable effect on money market rates.
The market expectation is that the cash rate will remain around its current level of 13–14 basis points for at least the next year (Graph 3). This is consistent with the Board's guidance that the cash rate target will not be raised until progress is being made towards full employment and it is confident that inflation will be sustainably within the 2–3 per cent target band. Given the outlook for inflation and the labour market, this is likely to be some years away.
Target for the Three-year Australian Government Bond Yield
The Board has announced a target for the three-year Australian Government bond yield of around 25 basis points. As I just said, given the outlook for unemployment and inflation, the Board expects that the cash rate will remain at its current low level for some years. The target for the three-year bond rate reinforces the forward guidance on the cash rate.[5]
At the same time, the Reserve Bank also stands ready to purchase Australian Government bonds to address market dysfunction. In March, bond markets around the world were very dysfunctional. This included the market for US Treasuries, which sits at the core of the global financial system. US Treasuries are a critical benchmark for pricing in global financial markets.[6]
Similar dynamics that contributed to the dysfunction in the US Treasury market occurred in the Australian Government bond market and other advanced economy bond markets:[7]
- A desperate scramble for cash: portfolio managers and other investors sought to increase the amount of cash in their portfolios, in part to meet redemption requests and margin calls and in part reflecting asset reallocation by their investors. The portfolio managers achieved this by selling the most liquid part of their portfolios, which was often fixed income and particularly government bonds.
- Rebalancing: as equity prices declined but the value of bonds rose sharply (bond yields declined), asset managers rebalanced their portfolios by selling bonds and buying equities.
- Leveraged trade unwinds: Leveraged traders in the government bond market had positions exploiting small pricing ‘discrepancies’, such as the difference between bond futures and the underlying bonds they reference as well as between these reference or ‘on-the-run’ bonds and the ‘off-the-run’ bonds.[8] Because these discrepancies are generally very small, leverage is required to make the trades worthwhile. As interest rate volatility increased, these traders were required to unwind these positions, generating further selling pressure and even higher interest rate volatility.
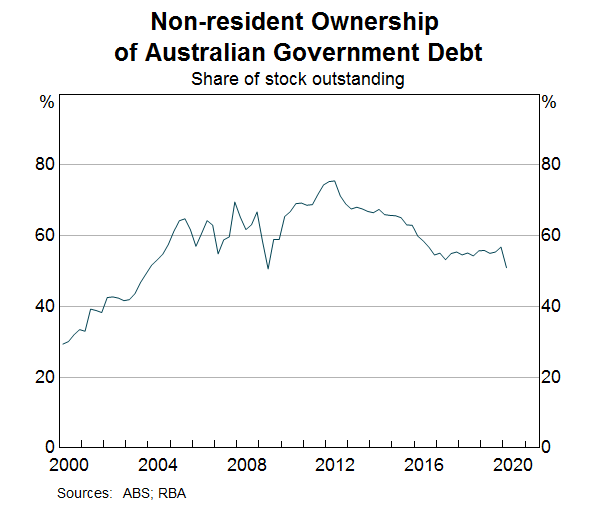
- Foreign exchange intervention: a number of emerging economy central banks intervened in their foreign exchange markets to support their exchange rates as they depreciated. This involved selling US Treasuries and other bonds in their foreign reserves portfolios, including Australian Government bonds. The effect of these sales are evident in the TIC data in the US and in Australia's balance of payments statistics for the March quarter, which showed a marked decline in the foreign holdings of Australian Government bonds (Graph 4).
- Dealer balance sheet constraints: investors sell their bonds to the dealers who act as the main intermediaries in the bond market. In the face of the large selling pressure, dealers were constrained in their ability to absorb these flows by the changed regulatory environment over the past decade as well as their own internally imposed risk limits. Whilst this should not have been that surprising, it nevertheless increased the degree of price volatility and dysfunction in the market.[9]
The dysfunction was evident in the heightened interest rate volatility in the bond market, reflecting the reduced liquidity even in the US Treasury market, which is generally regarded as being amongst the most liquid of all markets. It was also evident in a widening in bid/ask spreads (Graph 5), that is, the difference between the prices at which a dealer is willing to buy and sell a bond. At times, the dysfunction was such that government bond prices fell (yields rose) at the same time as equity prices were also falling, when normally the opposite is the case, reflecting the important role that government bonds play as a hedge.
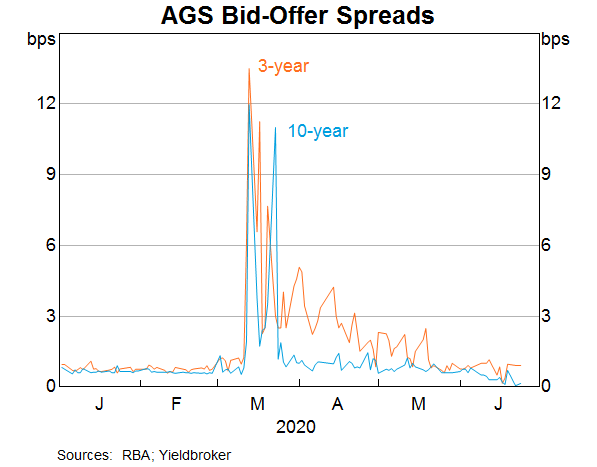
As was the case with many other central banks, the Reserve Bank bought government bonds in the secondary market to try to alleviate the dysfunction in the Australian government bond market. These purchases helped to restore the functionality to this important pricing benchmark in the Australian financial system, which serves as the risk-free pricing curve for most financial assets.[10] Clearly, an effectively functioning bond market is also necessary to allow governments to issue bonds to finance the fiscal stimulus.
The Reserve Bank bought bonds at or near the three-year horizon to achieve the three-year yield target but also along the yield curve to help achieve the target and address the market dysfunction. Graph 6 shows the bonds the RBA has purchased by maturity. To date, we have purchased just over $40 billion in Australian Government bonds. The graph shows that a sizeable share of the purchases were in off-the-run bonds out to the 10-year bond. These purchases significantly reduced the constraints on dealer balance sheets, which facilitated a faster return to a more functional bond market.
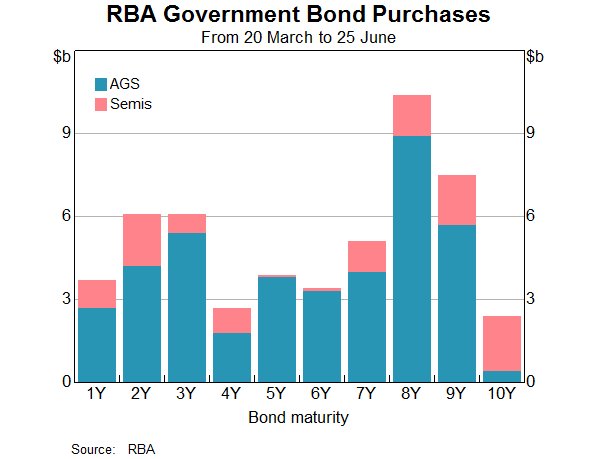
The RBA chose not to buy bonds beyond the 10-year maturity, nor indexed bonds. These bonds play a less important role as a pricing benchmark in the economy. Very few other financial instruments price off them. Our assessment was that bond purchases could be more effectively directed to restoring functionality in the parts of the yield curve that are typically quite liquid. This would see functionality return to these other parts of the market over time. Indeed, that has turned out to be the case. The RBA's purchases in the second half of March and into April helped to improve the functionality in the broader bond market and achieved the Board's target for the three-year bond yield of around 25 basis points (Graph 7). The improved functionality of the market has occurred alongside very sizeable issuance by the AOFM, which has been met with very strong demand.
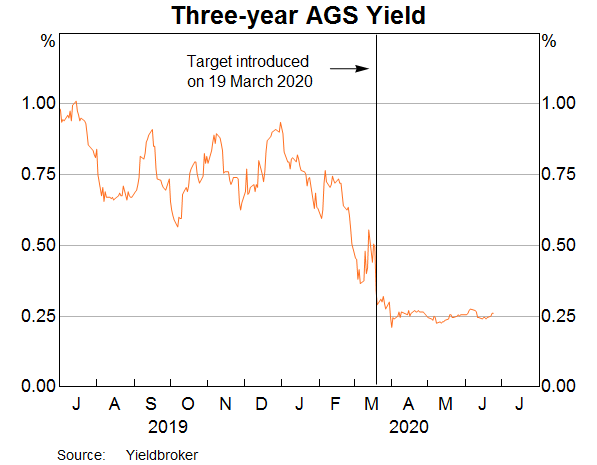
The three-year bond yield has been consistent with the Board's target and the government bond market has been functioning effectively for a number of weeks now. If the three-year bond yield target is credible to the market, then the Reserve Bank does not need to purchase many bonds at all to achieve the target. Indeed, that has been the case over the past month or so and the RBA has not needed to buy any bonds since early May. Nevertheless, the RBA stands ready to scale up its purchases if necessary to achieve these objectives.
The Reserve Bank has also purchased state government bonds (semis) to improve the functioning in that market. The state governments also require a functioning bond market to be able to finance their fiscal stimulus. Again these purchases were conducted in the secondary market. To date, these purchases have totalled $11 billion and the amount of bonds bought from each state has been broadly proportional to their size. Conditions in the semis market have also returned to their pre-COVID state and the state borrowing authorities have also been able to issue sizeable amounts of bonds in a short period of time.
With the cash rate around 13–14 basis points and the target for the three-year Australian Government bond yield around 25 basis points, one would expect yields on bonds with maturities between the overnight cash rate and three years to be no more than around 25 basis points. However, those bonds with maturities shorter than the three-year futures basket are off-the-run and tend to be less in demand. They can trade at a higher yield than bonds included in the futures basket, reflecting their lower liquidity. We would not expect the illiquidity premium to be very high. If these yields were to be noticeably above the three-year target, this would be inconsistent with a gradually upward sloping yield curve between cash and three-year yields. It would also be inconsistent with the policy objective of lowering borrowing costs. Hence the Reserve Bank is prepared to buy these bonds should their yields rise too high for a sustained period.
The Reserve Bank is also continuing its long-run practice of buying Australian Government bonds that are very close to maturity (less than 18 months) for liquidity management purposes. An individual bond line can often have between $20 billion and $30 billion on issue. When a bond matures, there is a large increase in liquidity in the system as the Government repays the bondholders. We have been buying these near-to-maturity bonds for many years to reduce the impact on system liquidity when they mature. Currently, there is less need for tight liquidity management as overall system liquidity is so much higher.[11] But it is still desirable to avoid the large increases in ES balances that occur when a bond matures, so we have continued these operations. These purchases also support an effectively functioning bond market.[12]
When the RBA is buying government bonds, we are buying them in the secondary market. That is, they are bonds that have been issued to investors some time earlier. The RBA buys these bonds via an auction mechanism with the dealer panel banks as counterparties, though the dealers in turn have been sold the bonds from other investors. The RBA is not participating in any of the AOFM's bond tenders and does not purchase bonds directly from the state government borrowing authorities.
As the RBA buys government bonds, the amount of ES balances in the system increases as we credit the accounts of the banks that we buy them from. These purchases are not sterilised.[13] The $50 billion of bond purchases have increased ES balances and provided a substantial boost to the liquidity in the system. Other factors also affect the level of ES balances, as discussed below, which have offset some of this impact.
Upon maturity of the bonds that the RBA holds, the Government repays the funds to the RBA in the same way it does every other holder of the maturing bond. In terms of the RBA's balance sheet, there is a decrease on the asset side by the amount of the maturing bonds the RBA holds. On the liability side of the RBA's balance sheet there is a matching decrease in the Government's deposit account at the RBA, as the Government uses the funds it has accumulated there to repay the RBA.
While the bond purchases by the RBA increase liquidity in the system, I do not see this posing any risk of generating excessively high inflation in the foreseeable future. Indeed, the opposite seems to be the more likely challenge in the current economic climate, that is, that inflation will remain below the RBA's target. Nor do I see any issue at all with the capacity of the Government to repay the bonds it has issued. Firstly, even with the increased issuance to fund the fiscal stimulus, the stock of government debt relative to the size of the Australian economy remains low. Secondly, the Government is borrowing at yields that are very low historically. Importantly, the yields on government debt are considerably below the long-run growth rate of the economy; that is, r is less than g. While ever this remains the case, as Olivier Blanchard has highlighted, there are no concerns at all about fiscal sustainability from increased debt issuance.[14] This is because growth in the economy will work to lower government debt as a share of nominal GDP.
Provide Liquidity to the Financial System
As the dysfunction in markets intensified in March, the RBA responded to the increased demand for liquidity by significantly increasing the supply of liquidity in its daily market operations. This alleviated funding pressures in the banking system and met the increase in precautionary demand for liquidity. (The RBA undertook similar actions in the financial crisis in 2007–08.[15]) Through March and April, the RBA increased the size of its daily operations and provided regular three and six-month terms in its repo operations to meet this demand for liquidity. These operations also boosted ES balances. The ES balances are a liability for the RBA on its balance sheet (and a corresponding asset for the banking system). The asset side of the RBA's balance sheet rises in the form of the collateral posted to the RBA as the banking system accesses these funds through repurchase agreements (repos).
In recent weeks, there has been much less demand for funding at the Reserve Bank's daily market operations. This is because financial conditions have stabilised and because the liquidity position of the banking system is now much greater, with ES balances at a high level. Indeed, some of those earlier liquidity injections in March are now maturing. As they mature we expect them to be replaced, but probably not one for one, again reflecting the ample liquidity in the system (as well as the availability of the TFF). Given this, the RBA will scale back the frequency of its longer-term offerings.[16] Currently, for the terms it offers, the RBA is prepared to satisfy whatever amount of funding is demanded in its daily market operations to keep money market rates low. If liquidity conditions were to tighten up, we would expect to see more demand in our daily operations, which we would be prepared to accommodate.
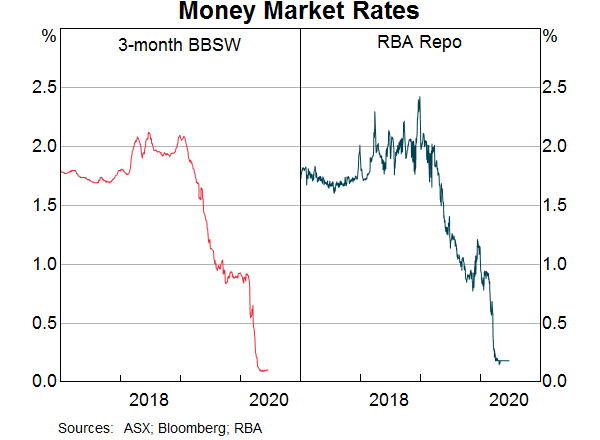
The ample amount of liquidity in the system is sufficient to ensure that money market rates remain at low levels. The cash rate remains low at around 13–14 basis points. Market expectations derived from the overnight indexed swap (OIS) curve imply it should stay around this level for at least a year. Repo rates are around 18 basis points. Reflecting the large amount of system liquidity as well as strong deposit growth in the banking system, the rate at which banks can borrow in the money market – the bank bill swap rate (BBSW) – is also at a low level (Graph 8). It is currently trading with close to no spread relative to OIS. The low level of these money market interest rates are materially contributing to the lower borrowing costs for households and businesses.
Term Funding Facility
The RBA has also announced a Term Funding Facility (TFF).[17] This provides three-year funding for the banking system (secured against appropriate collateral) at a fixed interest rate of 25 basis points. One can think of this as equivalent to the repo transactions in the RBA's daily market operations, but for a considerably longer term than normal. Under this facility banks can borrow an amount up to 3 per cent of their loan book until the end of September. They are able to draw on additional amounts if they increase their lending to businesses, particularly small and medium-sized businesses.
The cost of funding available to the banking system under the TFF at 25 basis points is significantly lower than the cost of three-year funding in the market, which is currently around 75 basis points for the major banks, and even lower relative to the cost of funding in the market for the regional and smaller banks. Hence the TFF is contributing to a lower cost of funding for the banking system and thereby to lower household and business borrowing costs. In aggregate, the initial TFF allocation is sufficient to replace all of ADIs' maturing bond funding over the next six months.
We have seen the announcement of the TFF contribute to lower borrowing costs even though the total drawings by banks under the TFF have been modest to date relative to the size of the available funding.[18] So far, over 60 institutions have drawn on the TFF, with smaller institutions drawing a higher share of the funding available to them. We expect increased drawings in the coming months as banks use the TFF funds to replace maturing wholesale funding.
The strong growth in deposits has reduced the immediate need for TFF funding (Graph 9). Some of that deposit growth was likely temporary as businesses drew on precautionary lines of credit and placed the funds drawn on deposit at a bank. And we have seen some of this reverse since April. But some of the increase in deposits is likely to be more long-lasting.
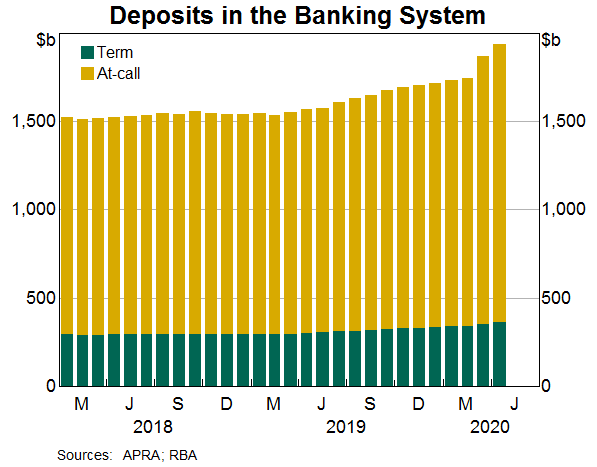
Hence as a result of the RBA's recent policy actions, there has been a substantial increase in system liquidity in the form of ES balances held by the banking system, which is evident on the RBA's balance sheet. This increase in system liquidity is coming through a number of channels: the RBA's daily market operations; drawings under the TFF; and the RBA's purchases of Australian Government bonds and semis.
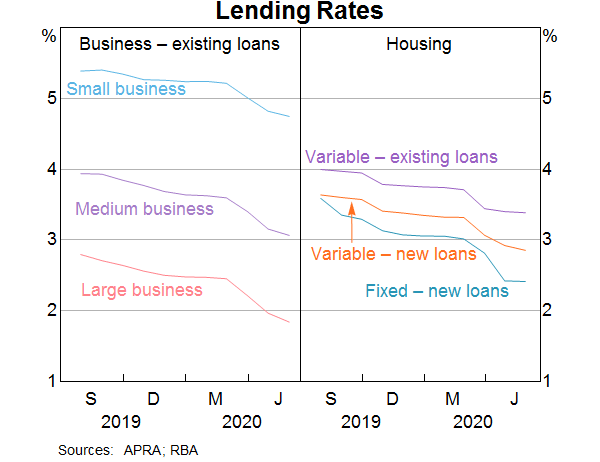
These policy actions are working as expected. The target for the cash rate, the level of the actual cash rate and the target for the three-year Government bond yield mean that these important pricing benchmarks anchor a low risk-free yield curve in the Australian financial system. Together with the liquidity provided through market operations and the TFF, this has lowered the cost of funding for the banking system. In turn, this has been transmitted through to lower borrowing costs for households and businesses (Graph 10).
Banker for the Australian Government
Let me briefly talk about one other factor that has a major influence on the RBA's balance sheet, namely Government transactions. As banker for the Australian Government, the Government's transactions in the form of spending, taxation and debt raisings all settle across the RBA's balance sheet. For example, when the Government issues a bond to investors, it deposits the money raised from the investors in its account with the RBA. This removes funds from the system. Similarly, payments such as tax withdraw liquidity from the system as the payments flow through to a deposit in the Government's account. Conversely, government spending puts money into the system as the spending ends up as deposits in someone's bank account.
In normal times, the RBA aims to sterilise the impact of such transactions on system liquidity to ensure that the cash rate remains at the target set by the Board. But with system liquidity at a high level, this is no longer necessary.
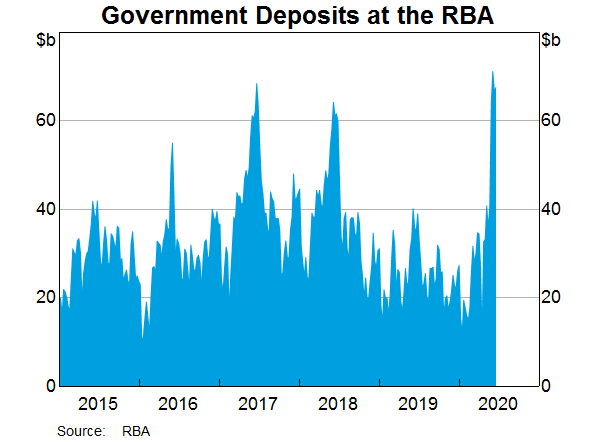
As a result, ES balances will fluctuate with these Government flows.[19] These flows can be quite large and move ES balances significantly. Particularly obvious is the settlement of $19 billion of the December 2030 bond on 21 May, which was the largest bond syndicated in Australian history and resulted in a large rise in Government deposits (Graph 11).
The RBA has historically sterilised the effect of government transactions either with domestic repos or foreign exchange swaps. With the focus on supporting domestic liquidity, the RBA's foreign exchange swap book for domestic liquidity management has gradually matured to be zero currently.[20] This decline in the FX swap book is evident on the RBA's balance sheet. It is important to remember that these foreign exchange swap transactions have no impact on the Australian dollar and are solely undertaken for domestic liquidity management.
Conclusion
To conclude, the Australian economy has been significantly affected by the virus and the associated health policy actions. This has warranted a comprehensive policy response from both fiscal and monetary policy. The monetary policy response has been directed at supporting households and businesses by keeping funding costs low and ensuring credit is available. The monetary policy actions have worked as expected by lowering the key interest rate benchmarks in the economy to historically low levels, which has been transmitted through to historically low borrowing rates for households and businesses, as well as governments.
The Reserve Bank's policy response has also resulted in large changes in its balance sheet, and I have sought to provide a guide to them. The size of the balance sheet can be affected by a number of factors in addition to the Bank's policy actions and as such, is not the best way to assess the stance of policy.
Recent data indicate that the outcomes in the Australian economy have been better than earlier feared. But we should not lose sight of the fact that the decline in the economy and the impact on households and businesses is historically large. Notwithstanding the better than feared outcomes, the fiscal and monetary support that has been provided was, and remains, warranted.
There is considerable uncertainty over the path from here. This uncertainty includes the behavioural responses as health restrictions are eased. There is also considerable uncertainty about the future, which will affect the decisions of businesses and households. It has taken a long time to recover from large declines in the economy in the past. The cause of the decline this time is much different from those in the past. Many of the imbalances that exacerbated declines in previous downturns are not present this time. But it is still quite likely that this decline will have a long-lived impact that will require considerable policy support for quite some time to come. While much of that support is likely to be on the fiscal side, the Reserve Bank will maintain the current policies to keep borrowing costs low and credit available, and stands ready to do more as the circumstances warrant.
Endnotes
Thanks to Chris Becker, Matt Boge and Ellis Connolly for their assistance with this talk, and the RBA staff who have operationalised the Board's policy decisions over recent months. [*]
The details of all of these operations, as well as the statistics on their usage, can be found on the RBA website. [1]
Recall that the cash rate is the overnight interest rate at which banks borrow and lend their ES balances at the RBA to ensure they maintain a positive balance in their account. [2]
A similar dynamic has been seen in other equivalent markets around the world as central banks have increased the supply of liquidity, both in the global financial crisis and again in the current episode. [3]
Hing A, G Kelly and D Olivan (2016), ‘The Cash Market’, RBA Bulletin, December, pp 33–41. [4]
The expectations theory of the term structure implies that the three-year Government bond yield should be approximately equal to the expected path of the cash rate over the next three years, with some (potentially small) compensation for uncertainty over that three-year horizon. [5]
A functioning bond market is also important for ensuring that the plumbing of the financial system is functional, in terms of repo financing and collateral provision more generally. Singh M and J Aitken (2010), ‘The (Sizable) Role of Rehypothecation in the Shadow Banking System’, IMF Working Paper 10/172. M Singh (2020), Collateral Markets and Financial Plumbing, Risk Books. [6]
Fleming M and F Ruela (2020), ‘Treasury Market Liquidity during the COVID-19 Crisis’, Liberty Street Economics, Federal Reserve Bank of New York, April. Available at <https://libertystreeteconomics.newyorkfed.org/2020/04/treasury-market-liquidity-during-the-covid-19-crisis.html>. Hauser A (2020), ‘Seven Moments in Spring: Covid-19, financial markets and the Bank of England's balance sheet operations’, speech on 4 June, Bloomberg, London. Available at <https://www.bankofengland.co.uk/-/media/boe/files/speech/2020/seven-moments-in-spring-covid-19-speech-by-andrew-hauser.pdf?la=en&hash=43D022917D76095F1E79CBDD5D42FCD96497EA5F>. [7]
8 LTCM in 1998 is an example of these sorts of strategies. See also Becker C, A Fang and JC Wang (2016), ‘Developments in the Australian Repo Market’, RBA Bulletin, September, pp 41–46. [8]
Debelle G (2018), ‘Lessons and Questions from the GFC’, Address to the Australian Business Economists Annual Dinner, Sydney, 6 December. [9]
The US Treasury market started to stabilise as the Federal Reserve began large purchases of US Treasuries. The stabilisation of the US Treasury market contributed to improved conditions in other markets around the world. [10]
The AOFM has currently suspended its buyback program of bonds, which also increases the size of the possible impact on liquidity when these bonds mature. [11]
Some bond holders have a mandate that prevents them from holding bonds with less than one year to maturity. Hence we can see increased selling of bonds as they approach this time to maturity. [12]
That is, the RBA does not undertake market operations to withdraw the additional ES balances from the system. [13]
Blanchard O (2019), ‘Public Debt and Low Interest Rates’, American Economic Review, 109(4), pp 1197–1229. [14]
See Debelle G (2018), ‘Lessons and Questions from the GFC’, Address to the Australian Business Economists Annual Dinner, Sydney, 6 December. [15]
Dealing intentions are posted to the market data services prior to daily open market operations and then republished on the Reserve Bank website in statistical table A3. [16]
Refer to the Reserve Bank website for more details on the Term Funding Facility: https://www.rba.gov.au/mkt-operations/term-funding-facility/overview.html. [17]
The TFF is however having a significant effect in boosting banks' liquidity coverage ratios (LCR) as APRA recognises the banks have access to the facility. [18]
Banknote issuance and transactions by other Reserve Bank clients also continue to have a liquidity impact but tend to be much smaller and less volatile. [19]
This is evident in the data we publish on our foreign exchange operations on our website in Table A4. [20]
