Speech Economic Conditions in Australia – Some Implications for the Kimberley
It is a great pleasure to be here today to speak with representatives from across the Kimberley at this annual economic forum. I am going to cover some of the main developments in the Australian economy over the past few years. I will focus on those that have been more pronounced here in Western Australia and how they have played out in the Kimberley. I'm hoping this provides some useful context for the discussions that you will be having later today and tomorrow.
Throughout, I will draw on insights that the Reserve Bank receives from our regional and industry liaison program. I do so not just because this work happens to be done by the team that I lead, but also because the information from the program helps the Bank assess developments in the Australian economy.
I should outline briefly what the liaison program involves.[1] In addition to our head office in Sydney, the Reserve Bank has a small team of staff in Adelaide, Brisbane, Melbourne and Perth who conduct the program. These staff meet regularly with businesses and community associations; my team held over 750 of these meetings last year. While the majority of the meetings are in the five capital cities, we also regularly visit the other state and territory capitals, and regional centres, to obtain insights on conditions there. We took the opportunity of attending this forum to have meetings in Broome yesterday. Again, thank you to those businesses who generously gave us their time and shared insights. It has been some time since we last travelled to Broome for a liaison visit. Going by the mix of people here today, I'm sure we will be able to fill a multi-day program of meetings when we plan our next trip.
The liaison program covers all parts of the economy. It helps the Bank to understand more about what is influencing the decisions that businesses and others in the economy are making. While the official economic data gives us insights into what has happened, it does not tell us as much about why something happened. The liaison insights can be quite helpful in doing this, as well as assist in understanding structural changes in the economy. The timeliness of the information is also really useful for assessing the effect of unexpected events, such as drought, cyclones and other natural disasters. Over the past decade or so it has been very valuable in monitoring the evolution of the mining boom and its spillovers to the rest of the economy.
We include the liaison insights in our regular reporting of conditions to the Reserve Bank Board each month, as well as in our quarterly Statement on Monetary Policy publication. The Bank's quarterly Bulletin, published on our website, also often features articles that draw heavily on these insights.[2] In this way, the liaison insights are integrated in our analysis, rather than treated as a separate output.
Recent Macroeconomic Developments
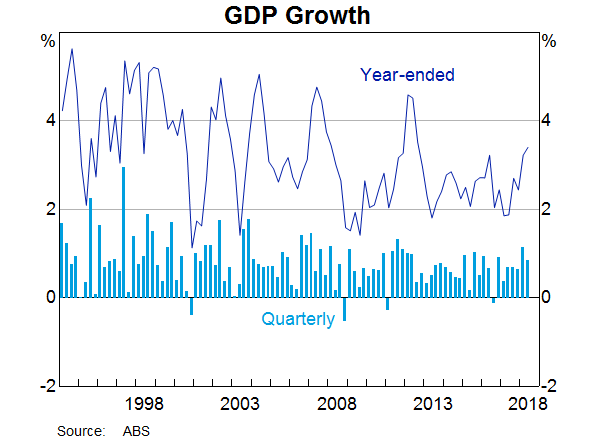
Turning to recent macroeconomic developments, over the past year the Australian economy expanded by over 3 per cent and inflation was around 2 per cent (Graph 1). The unemployment rate edged lower and is currently 5.3 per cent, which is a six-year low. Our expectation is that GDP growth will remain a little above 3 per cent for the next year or so, which will further reduce spare capacity in the economy. As the labour market tightens, wages growth and inflation should increase gradually.
There have been a number of factors supporting these quite positive outcomes. For a start, monetary policy in Australia has been accommodative – the cash rate has been unchanged at 1.50 per cent for over two years now.
In addition, the global economy has been expanding quite strongly. Many of the advanced economies are growing at above-trend rates and unemployment rates in a number are at multi-decade lows. Even though trade tensions between the United States and China have increased this year, China's growth has held up while slowing a little.
These favourable global conditions have meant commodity prices for many of the products we export have been higher than we had expected. We continue to expect resource commodity prices to decline during 2019 as growth in China's demand for steel slows and additional global supply of bulk commodities comes on line. But we do not expect commodity prices to fall as far as the lows experienced in 2015/16.
The final factor that I wanted to highlight – and the one that I wanted to spend the most time on – relates to what has been happening at the state and territory level. This too helps explain the improvement in national outcomes. Briefly, the variation in outcomes across states has lessened considerably over the past year or so, as conditions in the mining-exposed states have improved.
The State Perspective
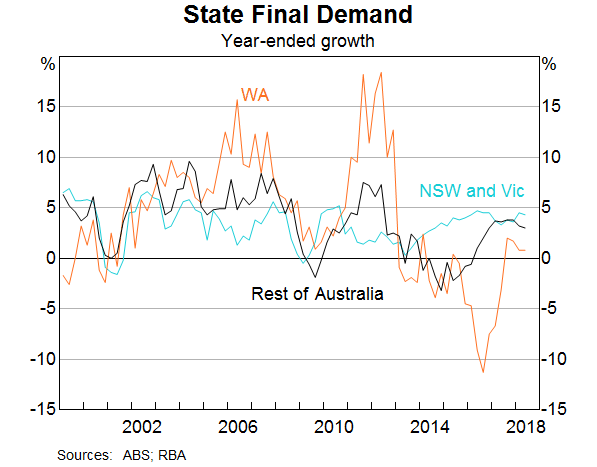
Over the past decade, large movements in commodity prices and the related mining investment cycle explain much of the variation in economic outcomes across the states and territories (Graph 2). In Western Australia, state final demand (which is the measure of domestic demand excluding trade, shown here) declined following the peak in investment in 2012. While other states were also affected, Western Australia experienced the largest effect. The unemployment rate increased to be above the national average and wages growth in Western Australia slowed markedly. More recently, though, the economic performance of the states has started to converge. I'm going to look at this convergence from three perspectives: business investment; labour markets; and housing markets.
Investment Cycles
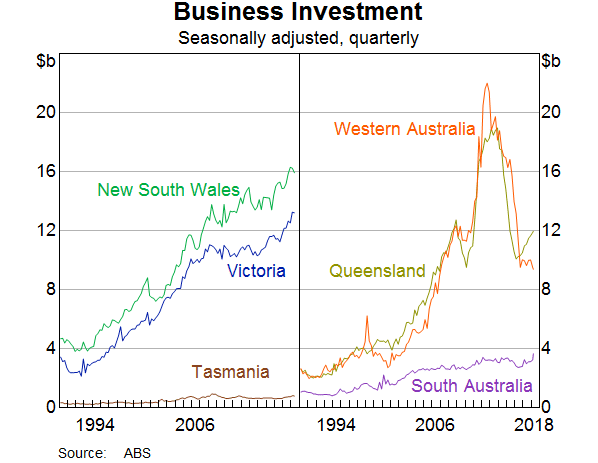
The improvement in conditions across states is partly explained by investment cycles (Graph 3). Both Queensland and Western Australia experienced similar large falls in business investment as the mining boom ended. For Queensland, the decline in investment eased a bit sooner and they have experienced reasonable growth in investment for the past two years. Here in Western Australia, there has been a welcome levelling out in investment over the past year or so, but some further decline is still expected as the final liquefied natural gas (LNG) projects are completed.
Over the past year, contacts in our liaison program have reported a pick-up in activity across the resources sector. They typically cite the combination of higher commodity prices and the need to invest to maintain their new, higher levels of production (‘sustaining capex’) as the reasons for this. In Western Australia, this spending has so far been mostly by the iron ore industry; three large replacement mines have been announced to be built in coming years. But plans are also progressing for a couple of large offshore gas projects in the early 2020s, some of which is to maintain production levels.
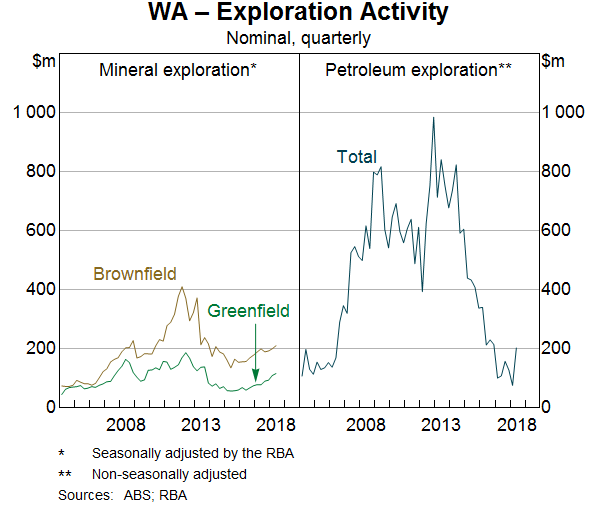
Higher prices for other commodities, such as gold and some of the lighter-weight metals and battery-related minerals, are also supporting increased exploration and small expansion projects (Graph 4). The improved outlook for the global uptake of electric vehicles and renewable energy is behind some of these price increases over the past few years.[3] These developments augur well for future investment.
Here in the Kimberley you would be well aware of the effects of the LNG investment cycle given your experience with the Prelude and Ichthys projects off the coast. The construction of these projects has supported the region's economy, including through marine and air transport and accommodation services. And while the production phase will certainly require less of these services, on-going spending will be required to sustain them over their lives.
There are also signs of a pick-up in mineral sector activity in the Kimberley. Projects such as the restart of the very high-grade Koolan Island iron ore mine are seeking to take advantage of increased demand by Chinese steel producers for higher-quality ore, as they try to improve productivity and decrease pollution. Others, such as the Browns Range heavy rare earths pilot processing plant, are taking advantage of the uptake of renewable energy and battery-related products.
Population and Labour Market Adjustment
I'll now turn to the labour market and population growth. Migration has been an important adjustment mechanism for the Western Australian economy in dealing with the large swings in activity this decade. Strong overseas and interstate migration during the investment boom enabled the construction of new projects in Western Australia. As a result, annual population growth for Western Australia peaked at almost 3½ per cent (Graph 5). As investment declined, migration to the eastern states increased and migration from overseas slowed. While population growth appears to have bottomed in Western Australia, it remains much lower than in most other states.
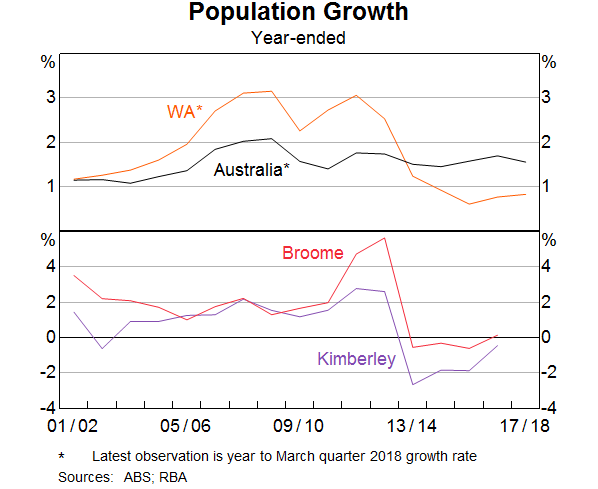
The Kimberley has also experienced large swings in its population over the decade. There was very strong population growth up to 2013, before population declined for several years. By 2017, the population of the Kimberley region was still around 5 per cent higher than in 2007.
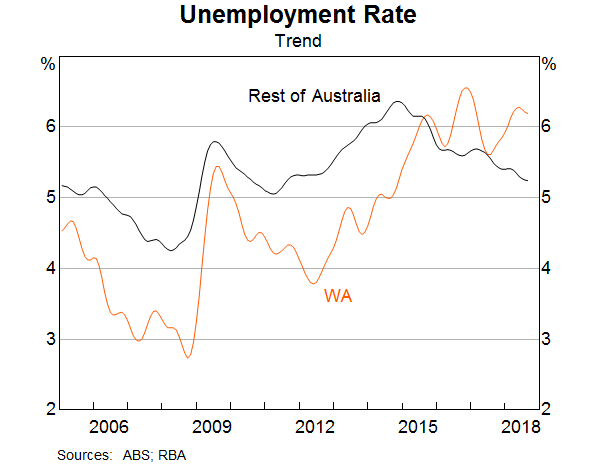
The flow of people from Western Australia, as well as the reliance on interstate fly-in/fly-out workers, no doubt assisted in limiting the increase in the unemployment rate since the end of the boom (Graph 6). After increasing quite sharply between 2013 and 2015, the unemployment rate in Western Australia has hovered around 6 per cent.
Another channel of adjustment from the end of the boom was via lower wages growth. This adjustment was experienced by mining firms as well as firms outside the mining sector.[4] Our liaison contacts reported frequently that cost-cutting initiatives by the mining industry also placed significant pressure on the margins of suppliers and contractors. These firms responded by reducing their costs, including labour. Fortunately, the stories of job losses, wage freezes and new hires being employed at significantly lower salary levels than predecessors, which were very common a few years ago, are now much less common. But wages growth in Western Australia is still quite weak – 1.5 per cent over the year to June 2018. A reduction in spare capacity in the labour market will be needed to generate a broader pick-up in growth here.
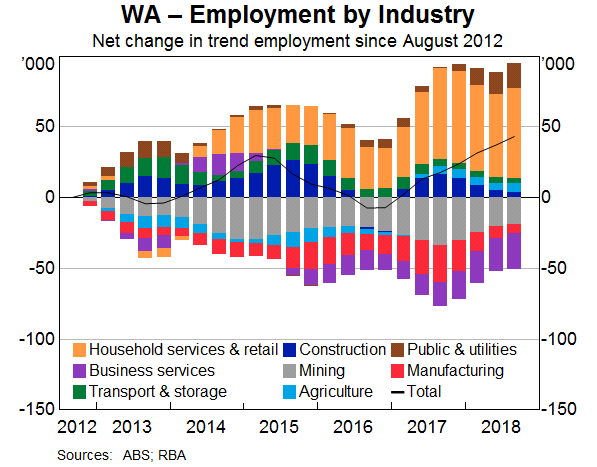
Turning to employment growth, employment has increased in Western Australia since the start of 2017 after several years of negligible growth. By industry, growth in household services (especially health care & social assistance) picked up quite strongly last year in Western Australia, as it did nationally (Graph 7). In the last few quarters there have also been small increases in mining and manufacturing employment. While both remain below their 2012 levels, the recent increase in job vacancies suggests some further growth is to come in these areas.
Our liaison suggests that, for most firms, labour availability in Western Australia remains ample. There are some signs that labour availability has been tightening for certain skills in mining and related sectors. Examples include maintenance trades and workers involved in the design and engineering of new projects. But so far reports of tight labour availability have been reasonably contained. This is an area we will continue to watch closely, both here in Western Australia and nationally, as a steady decline in spare capacity in the labour market is one of the main factors behind our forecasts for a gradual pick-up in aggregate wages growth and inflation.
Housing
The third and final area I wanted to speak about is the housing market. Here, too, there has been a marked difference in cycles across Australia over the past decade (Graph 8). The earlier strong growth in population in Western Australia contributed to a sharp rise in housing prices, which was followed by a big increase in construction. The sharp slowdown in population growth, combined with the increase in housing supply, saw prices decline. As a result, housing construction across much of the state has been quite subdued for a number of years.
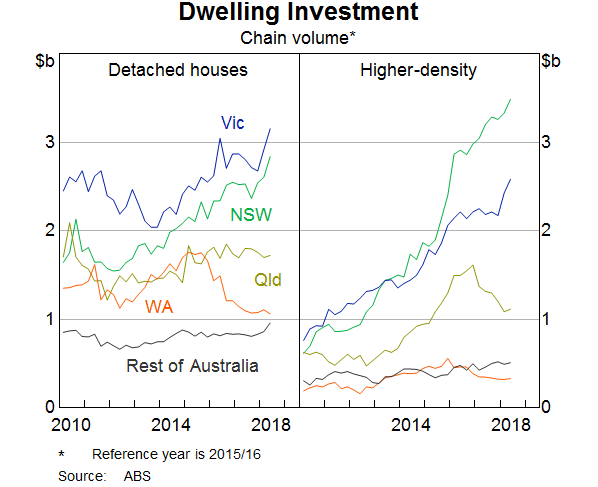
This is another example of where our liaison has been very helpful to understand the different experiences. It suggests that new home sales in Western Australia look to be stabilising this year at low levels. Most are in agreement that without a strong pick-up in population growth, any increase is likely to be modest.
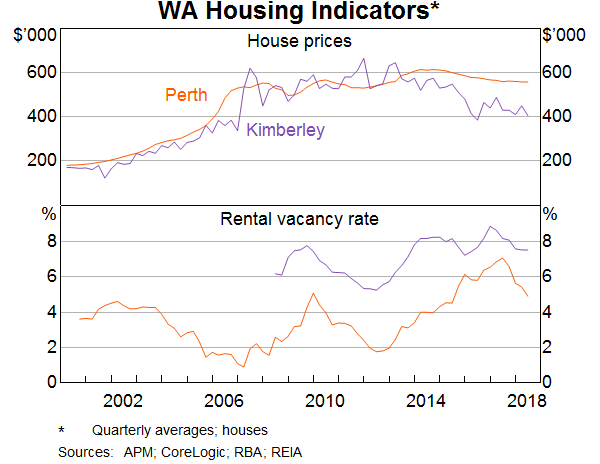
In the Kimberley, housing construction has also been very subdued for a number of years. Conditions in the established housing and rental markets deteriorated alongside the decline in population (Graph 9). While conditions appear to have stabilised recently, a strong pick-up in population growth would be needed before any material improvement is seen. The prospects for such a pick-up are closely linked to the labour market outlook.
Conclusion
To sum up, the experience of the last few years in the Kimberley and state-wide has been one of a marked slowing in economic activity, with consequential effects for employment, population, wages and housing markets. There are reasonable indicators that conditions are stabilising. Sentiment and activity is most improved in parts of the mining and related sectors, whereas the housing sector remains very subdued. Conditions there will likely take some time to work through; the path will be closely related to the movement of people and the creation of new jobs that encourage such moves.
Endnotes
I would like to thank Aaron Walker for his assistance in the preparation of this talk. [*]
More details on the liaison program can be found in: RBA (2014), ‘The RBA’s Business Liaison Program’, RBA Bulletin, September, pp 1–5. [1]
Recent examples include: Lai S, E Poole and T Rosewall (2018), ‘Firm-level Insights into IT Use’, RBA Bulletin, September, viewed 4 October 2018, and Jenner K, A Walker, C Close and T Saunders (2018), ‘Mining Investment Beyond the Boom’, RBA Bulletin, March, viewed 4 October 2018. [2]
See RBA (2018), ‘Box C: Outlook for Non-ferrous Metal Exports’, Statement on Monetary Policy, pp 67–69. [3]
For detail on how the adjustment affected industries beyond the resources sector, see Langcake S and E Poole (2017), ‘The Resources Economy and the Terms of Trade Boom’, RBA Bulletin, September, pp 27–33. [4]
