Speech Some Features of the Australian Fixed Income Market

Christopher Kent[*]
Assistant Governor (Financial Markets)
Australian Government Fixed Income Forum
2018
Tokyo –
I'd like to thank the Australian Office of Financial Management for the opportunity to address the forum here in Tokyo. Today I'll discuss some of the interesting features of the Australian fixed income market and how that market has evolved over the years.
The Australian financial market is very much part of the global capital market. Indeed, the extent of that integration has increased progressively over time. Over the past decade, foreign capital coming into Australia from the major advanced economies has increased by more than those economies have grown (Graph 1). For example, as a share of Japan's GDP, Japanese investment in Australia is now around three times the size it was 10 years ago.
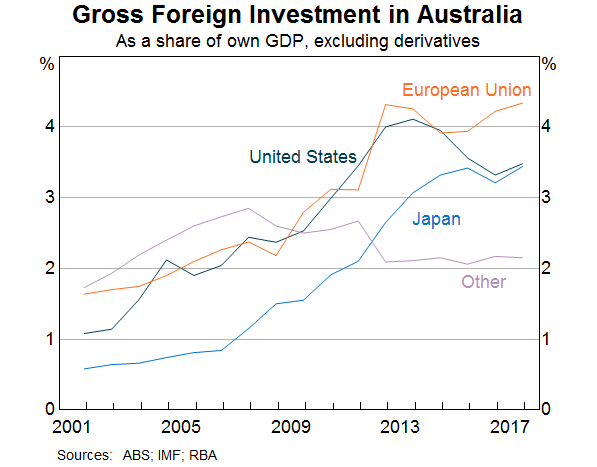
This means that developments in the major financial markets around the world, including in key financial centres such as Tokyo, have an influence on Australian financial conditions.
Australia has an extensive history of making productive use of foreign capital. It has long been recognised that there are reliable opportunities for overseas investors to profit from investment in Australian assets, whether they be physical or financial assets. This has enabled Australia to have sustained sizeable current account deficits over the course of the past 150 years or more (Graph 2).
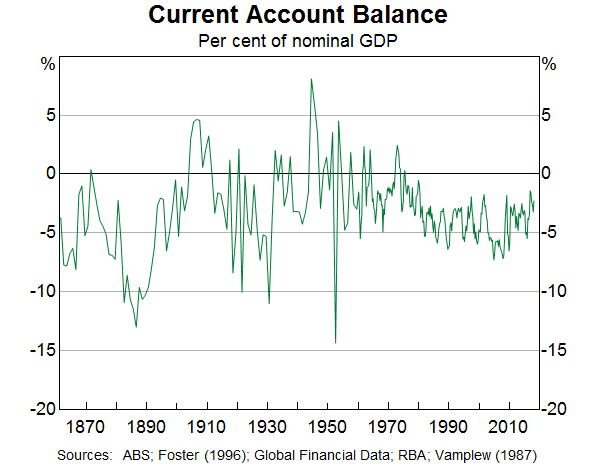
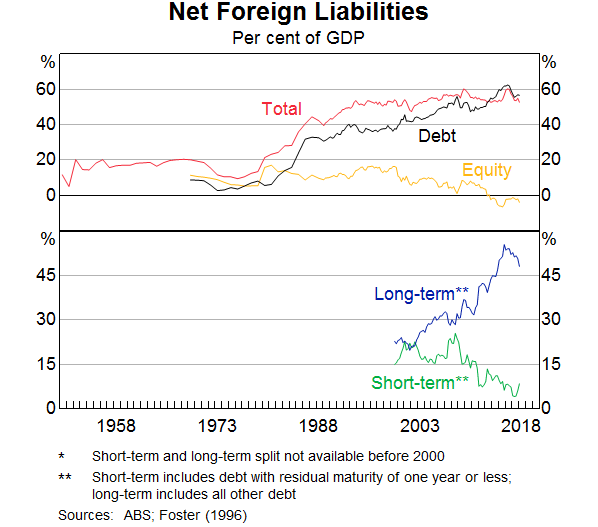
After Australia opened up its capital account in the early 1980s, the current account deficit became a bit larger on average than it had been for some time. That led to a steady build-up in the ratio of net foreign liabilities to GDP (Graph 3). Over the past decade, net liabilities have continued to increase, but by no more than the rise in nominal GDP, so that ratio has been little changed at around 55 per cent. Underneath that overall stability, there have been important changes in the make-up of the different types of liabilities, and the different types of institutions drawing upon foreign funding. The share of longer-term debt has increased noticeably, while the share of short-term debt has declined. Also, the net equity position has changed from a notable deficit to one that is roughly in balance.
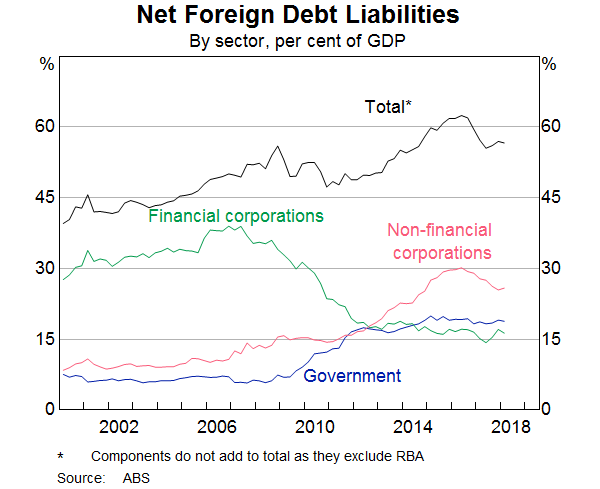
There is a common perception that Australia's foreign borrowings have been largely intermediated by the banks. While the banks do raise a portion of their debt offshore in order to fund their lending to Australian businesses and households, the extent of this is much less than in the past (Graph 4). By contrast, non-financial corporations have been willing and able to access offshore funding more so than in prior decades so that they now account for a larger share of foreign borrowing than banks. Also, federal government borrowing from offshore increased as a share of GDP following the global financial crisis. I'll return to this last point in a few minutes, but for now, I'll note that the government debt is issued to overseas investors in Australian dollars, in contrast to offshore issuance by the private sector in foreign currency terms.
The reduced use of offshore funding by the banks has been offset by much greater use of domestic deposits (Graph 5). The big shift away from short-term debt towards deposits started around the time of the global financial crisis. These changes were in response to the demands of the market and those of regulators for banks to make greater use of more stable sources of funding.
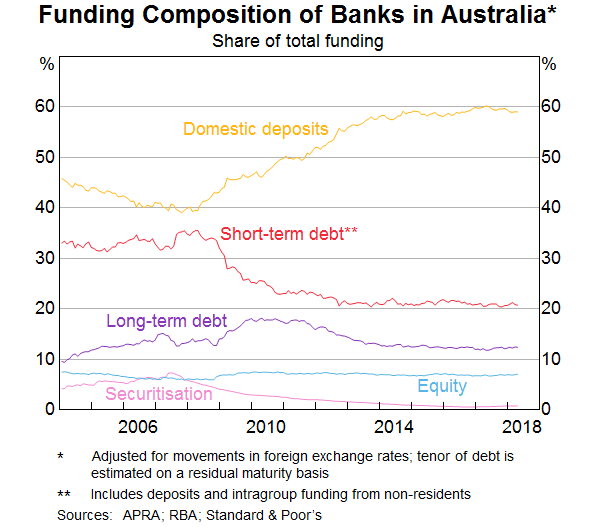
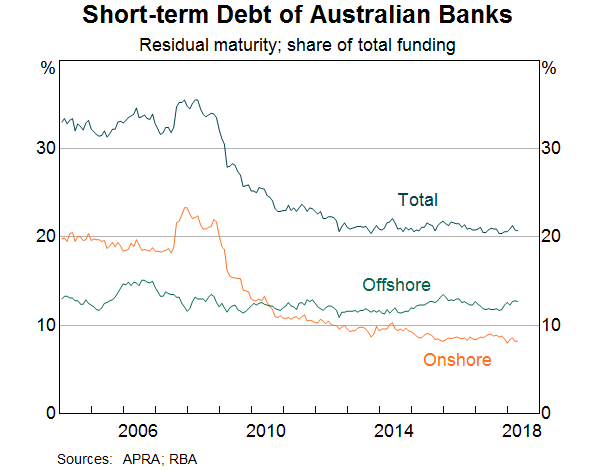
While the use of short-term debt (i.e. less than one year) is less than it was, it still accounts for around 20 per cent of banks' funding. And about 60 per cent of that debt (on a residual maturity basis) is raised offshore (Graph 6).[1] Global money markets, in the United States and elsewhere, provide the Australian banks with a much deeper market with a wider investor base than the relatively small domestic market. This short-term debt is issued in foreign currency terms, but the banks fully hedge their exchange rate (and interest rate) exposures at relatively low cost.
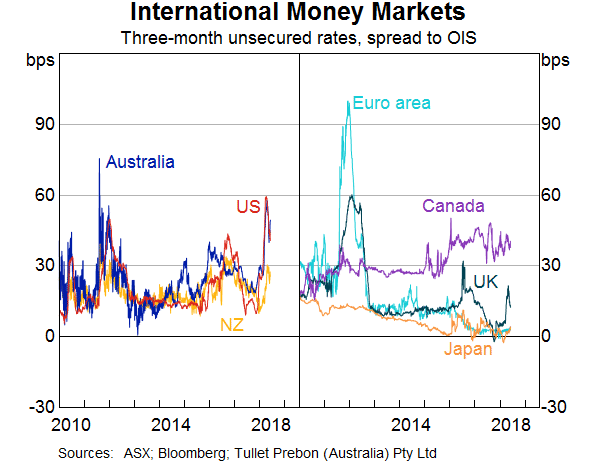
Because Australian banks raise a portion of their funding in US money markets to finance their domestic assets, they responded to higher US rates earlier this year by marginally shifting towards domestic markets to meet their needs. Hence, the rise in the US 3-month LIBOR rate (relative to the Overnight Index Swap (OIS) rate) was closely matched by a rise in the equivalent 3-month bank bill swap rate (BBSW) spread to OIS in Australia (Graph 7); similarly, the two spreads have declined of late by similar orders of magnitude (relative to their respective OIS rates). Equivalent spreads in some other money markets around the world also moved higher, though to a lesser extent than spreads in Australia. In contrast, rates in the euro area and Japan were not affected by the tightness in the US markets. That difference appears to reflect the fact that although European and Japanese banks tap into US money markets, they do so largely to fund US dollar assets.
Changes in BBSW rates in Australia feed through to banks' funding costs in a number of ways. First, they flow through to rates that banks pay on their short- and long-term floating rate wholesale debt. Second, BBSW rates affect the costs associated with hedging the risks on banks' fixed-rate debt, with the banks typically paying BBSW rates on their hedged liabilities.[2] Third, interest rates on wholesale deposits tend to be closely linked to BBSW rates.[3]
In short, the costs of a range of different types of funding have risen a bit for Australian banks in the past few months. But they remain relatively low and pressures in short-term money markets have eased, with BBSW about 10 basis points lower than its recent peak (relative to OIS). While some business lending rates are closely linked to BBSW rates – and so have increased a little – there have been few signs to date of changes to rates on loans for housing or small businesses.
While developments in global financial markets such as I've just described influence Australian financial conditions, the link is far from one-to-one. This is not surprising given that the Reserve Bank sets monetary policy according to the outlook for Australian economic activity and inflation, and within a freely floating exchange rate regime.
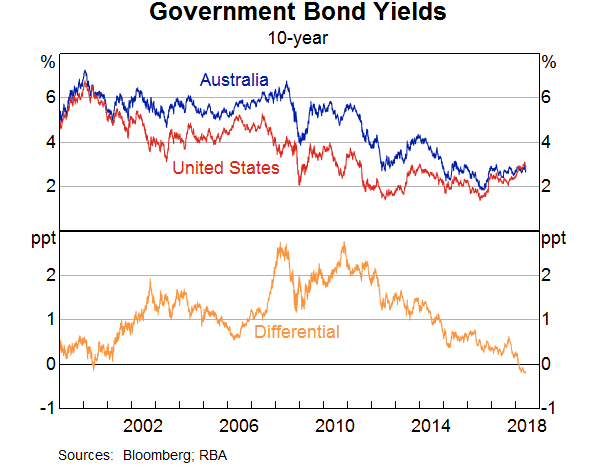
So even though the yield on 10-year government bonds in Australia moves quite closely with the equivalent US yield from day to day, over time these yields follow their own paths. Indeed, this year the difference between yields on 10-year Australian government bonds and equivalent US Treasury securities has become negative for the first time in quite a while (Graph 8). Also, the federal funds rate has now risen from close to zero a few years ago to be at the same level as the Australian cash rate. These changes reflect a few important differences across the two economies. In the United States, the economy has moved beyond what most consider to be full employment, inflation is close to the Fed's target and expectations are that the Federal Open Market Committee will continue to raise its policy rate; moreover, the United States is embarking on a significant fiscal expansion. By contrast, there remains spare capacity in the Australian labour market – notwithstanding strong employment growth over the past year – inflation is expected to rise gradually towards the Reserve Bank's target, and market pricing implies no expectation of a rise in the cash rate until around mid next year at the earliest. Fiscal policy in Australia is also on a different course to the United States, but there are other speakers here today addressing that topic.
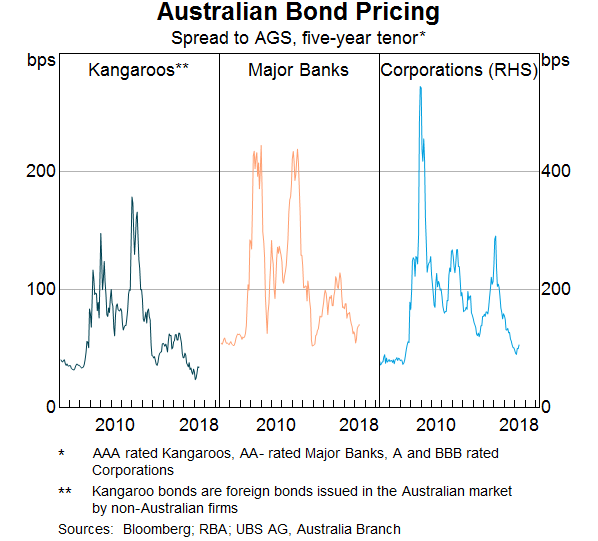
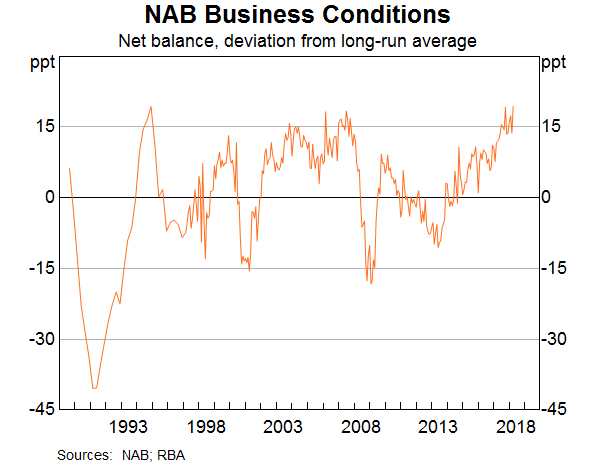
So yields have risen in Australia a bit, but by less than in the United States and they remain low. Spreads have also increased of late, but they too remain at low levels across a number of Australian markets (Graph 9). Over the past year or more, spreads declined in response to a number of factors. Accommodative monetary policy and the low rate of inflation have contributed to easy financial conditions for issuers. Also, there has been a noticeable improvement in measures of business conditions to well above average levels (Graph 10). The resulting improvement in, and outlook for, business profits has helped reduce actual and prospective defaults. In turn, this has underpinned a narrowing of credit premia.
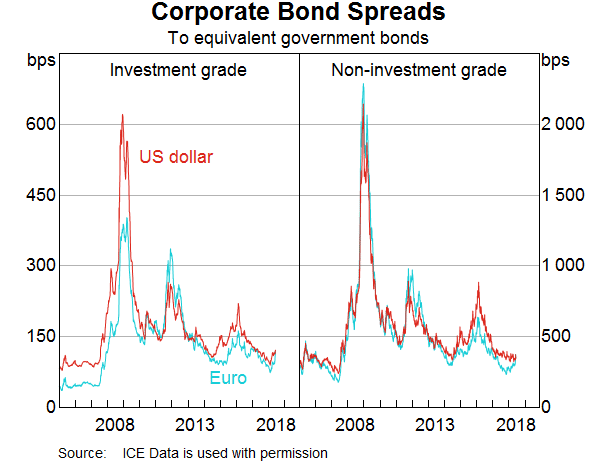
These low spreads are mirroring developments overseas (Graph 11). Again, this is consistent with Australia's open capital markets. Spreads reflect an assessment of risk, and if the price of risk in Australia were to deviate too far from the global price – beyond that suggested by any differences in fundamental credit quality – there would be opportunities for profitable arbitrage. One way or another, the process of arbitrage would lead to a degree of convergence between spreads.
Australian issuers have responded to the low yields and low spreads over the past couple of years.
Issuance in many markets is up. Banks have taken advantage of favourable funding conditions to tap the bond market. In 2017, their gross issuance of bonds was the second highest since the global financial crisis (Graph 12). And net issuance this year is currently running well ahead of issuance at the equivalent time last year.
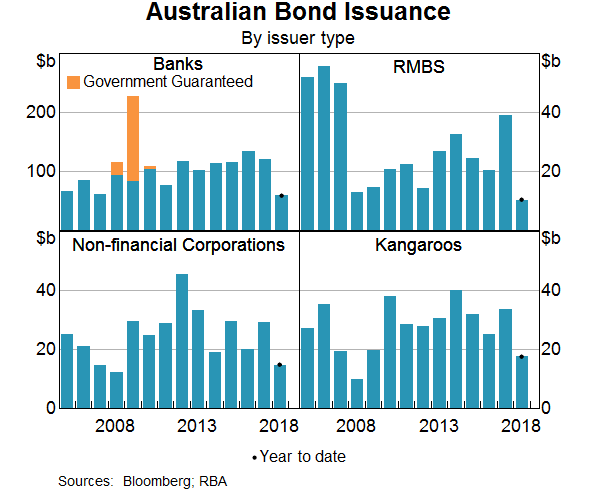
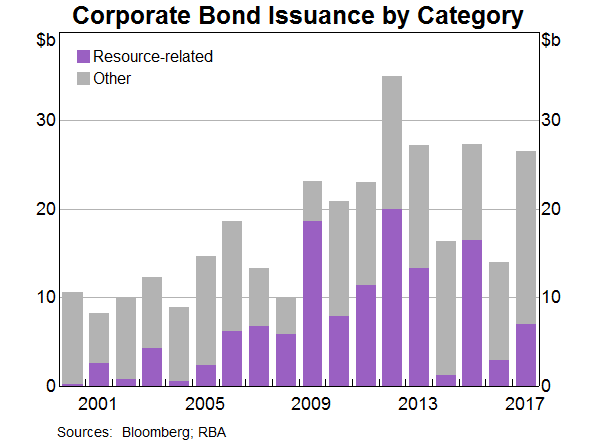
Corporate bond and Kangaroo issuance rebounded from their 2016 levels in 2017, although there have been recent years where issuance was higher.
In early 2018, spreads in the Kangaroo market narrowed to levels seen prior to the global financial crisis (Graph 9). The Kangaroo market, where non-resident issuers tap the Australian market, is familiar to Japanese investors; Japanese pension funds and life insurance companies are active investors here. Activity in this market is important because foreigner issuers typically hedge the exchange rate risk arising from their Australian dollar liabilities. This source of demand helps to keep down the costs of hedging exchange rate risk for Australian entities issuing liabilities in US dollars (and other foreign currencies).
Another place where we understand Japanese investors play an important role is in the residential mortgage-backed securities (RMBS) market. Issuance in the RMBS market in 2017 was the strongest it has been since the global financial crisis. Part of that owed to extra issuance by non-banks. Their housing lending picked up strongly at the same time as the growth of lending by the major banks eased, which was driven, in part, by regulatory actions to tighten lending standards. Despite these supply-side motivations, spreads remain relatively tight, consistent with a rise in the demand for RMBS over the past couple of years (Graph 13).
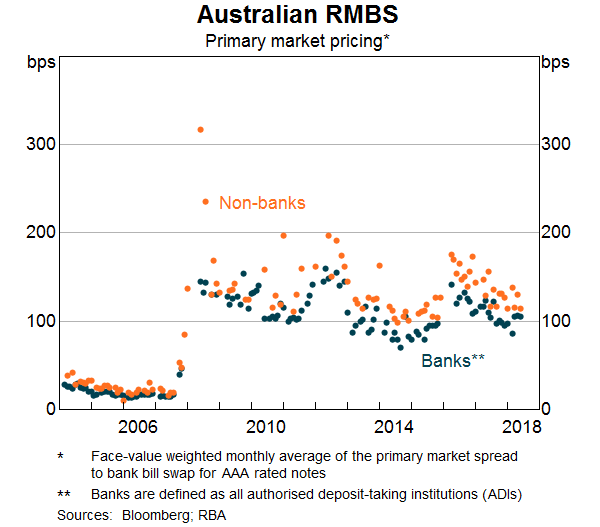
Across the three markets I've just mentioned there has been an increase in the diversity of issuers over the past few years. In the RMBS market, low spreads have encouraged more issuance by smaller competitors to the major banks; last year these numbered 17, which was the highest ever. Also, resource-related companies have been much less active now that the mining investment boom has come to an end, while companies outside of the resource sector stepped up their issuance to high levels last year (Graph 14).
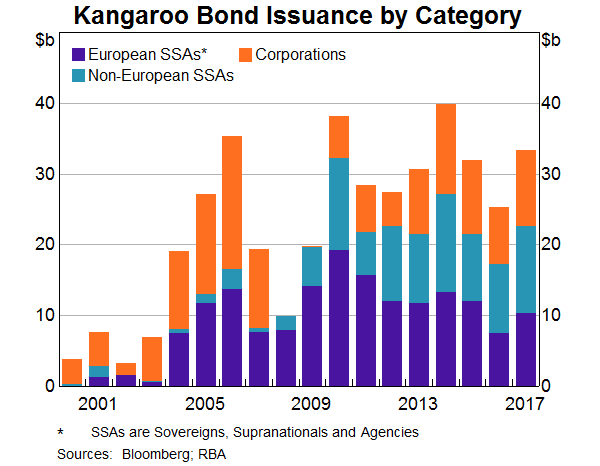
We have also seen more diversity in the types of issuer in the Kangaroo market (Graph 15).[4]
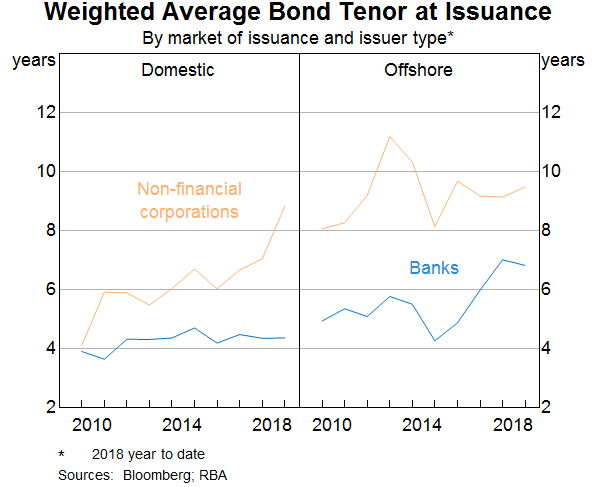
Another development worth highlighting is the lengthening in the tenor of bond issuance in some parts of the market (Graph 16). In the case of domestic issuance for non-financial corporations, this increase is part of a longer-running trend, which has been a positive development for domestic markets. In the case of overseas issuance by Australian banks, there have been some notable deals of late with quite long tenors. This lengthening of tenor reflects banks taking advantage of the low term premium for longer-term funding.
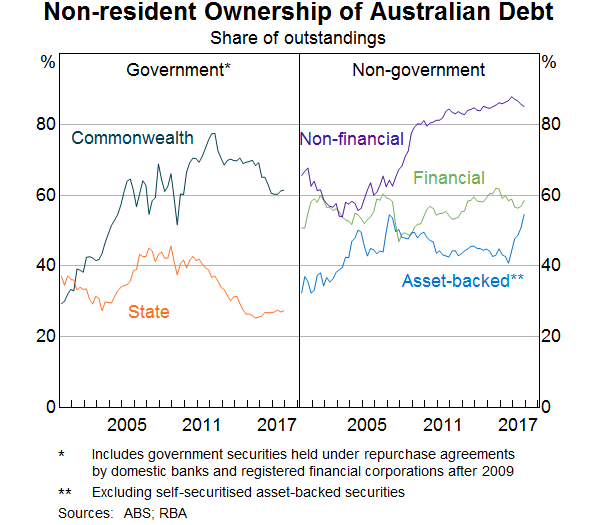
While foreign investment in Australia has grown significantly over many years, the share of government debt held by foreigners has declined since earlier in this decade (Graph 17).[5] Even so, it remains at a relatively high level in the case of Australian Government debt. The share of Australian corporate debt held by foreigners has been high and stable, even drifting up in the case of non-financial corporations. The recent pick-up in foreign ownership of asset-backed securities is interesting. It suggests that non-residents have entered the secondary market to purchase asset-backed securities, thereby adding some liquidity to a market that is normally not particularly liquid.
In conclusion, Australian fixed income markets are increasingly integrated with global capital markets. Not surprisingly, developments in major advanced economies have some influence on domestic financial conditions; the episode of recent tightness in US money markets is one such example. However, Australian financial conditions do not move in lock-step with those offshore, with domestic developments also having a major influence. While Australian banks still play a role in tapping into funding offshore, that role is less important than it used to be. Indeed, over recent years a broader range of issuers have been obtaining funding, in both onshore and offshore markets, and this has occurred at somewhat longer tenors than in the past.
Endnotes
I would like to thank Leon Berkelmans for his help in preparing this material. [*]
About two-thirds of long-term debt is issued offshore. [1]
Even though banks issue mostly fixed-rate bonds, and mostly offshore, they swap much of the related exposures into floating rate Australian dollar exposures. This aligns the nature of the rates for their funding with those of their assets (which are largely variable interest rate loans). [2]
Wholesale deposits include deposits from large corporations, pension funds and the government, and account for around 30 per cent of banks' debt funding. [3]
A decade ago, the Kangaroo market had been reliant on financial corporations and European-based supranational, sovereign or quasi-sovereign agencies, known collectively as SSAs. However, as time has passed, we have seen a more diverse range of issuers enter the market, including non-European SSAs and more recently non-financial corporations, such as companies from the United States. [4]
Foreign holdings in absolute terms have increased over this period but they haven't kept pace with the growth in the stock of government debt. [5]