Speech Fixed Income Markets and the Economy
Introduction
Thank you to Bloomberg for kindly playing host this morning. I was here just over a year ago discussing the economy's transition following the end of the mining boom. That was in my capacity as the Bank's chief economist. For the past few quarters I've been through my own transition. I now oversee the Bank's Financial Markets Group. This move has provided me the chance to reflect upon the interactions between finance and the broader economy. I wish to share some observations about those interactions today, focusing on the fixed income market.
Fixed Income Markets
Like many other financial markets, the fixed income market matches those who have a demand for funds to those who can supply them. The market is an important means by which governments and businesses can raise funds by issuing bonds to a wide range of investors in order to build new capital, purchase existing assets or cover other expenses.
But defining the boundaries of what constitutes the ‘Australian’ bond market is not entirely straight forward. Does it mean bonds on issue in Australia or bonds on issue by Australian entities, which includes overseas issuance? Or is it a combination of both? What about Australian dollar-denominated bonds issued overseas by foreign businesses? Should they be counted?
Today, I'm taking a broad view. I want to discuss the way the fixed income market as a whole interacts with the Australian economy, so I'm going with the broadest definition of the Australian fixed income market: all issuance by Australian residents, onshore and offshore; and all issuance denominated in Australian dollars, including by foreign entities.
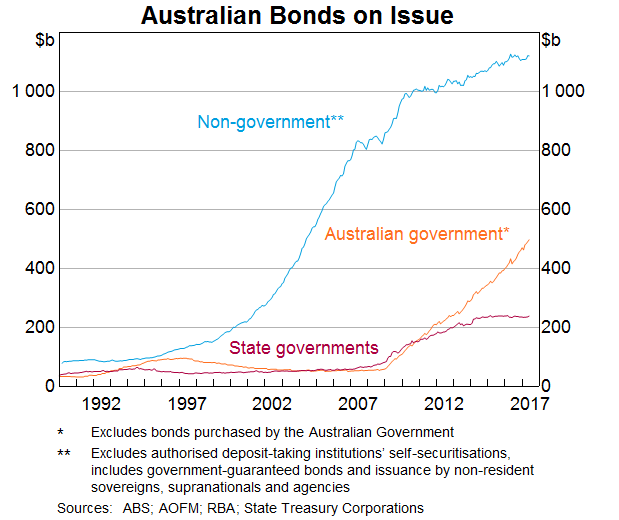
One way we can cut the data is to look at issuance by government versus issuance by the private sector and other non-government entities (Graph 1). Prior to the global financial crisis, the stock of government debt on issue in Australia was quite low, and private sector bonds on issue accounted for the vast majority of paper outstanding. Government debt outstanding had been little changed over those years. Indeed, it was actually a bit lower than the levels reached in the 1990s. After the financial crisis, government debt began to increase. Federal government debt has continued to do so, although state government debt has stabilised over the past couple of years, a feature which I will discuss later.
Private sector issuance has evolved somewhat differently. It grew quite rapidly from low levels in the lead up to the financial crisis, but growth has been more modest since then. Both demand and supply factors influenced that change. Demand for private sector securities waned in the midst of the crisis in response to a general reduction in risk-taking, although that weakness in demand really has only been persistent in the case of asset-backed securities. Supply was also affected by regulatory requirements that sought to place banks on a sounder footing and reduce their exposure to wholesale markets.
How important is the private bond market compared with alternative sources of finance? Currently, the value of private bonds outstanding is around $1.1 trillion. This includes issuance by financial and non-financial corporations. That stock is equivalent to around two-thirds of the value of companies listed on the Australian stock exchange. So the bond market is an important source of finance.
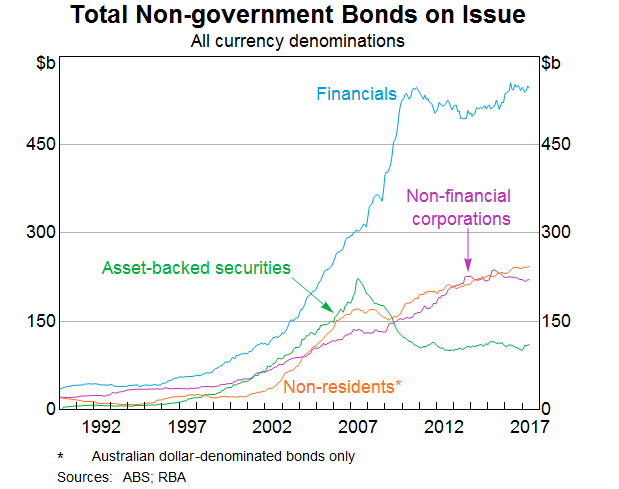
Even so, it's also worth noting that a large share of finance in Australia is intermediated via banks and other financial institutions.[1] So, it is not surprising that about half of private sector bonds have been issued by financial entities, mostly banks (Graph 2). The value of funds raised by non-financial corporations through fixed income markets is much less than the $1.1 trillion I previously mentioned. In contrast, total bank credit amounts to about $2.6 trillion.
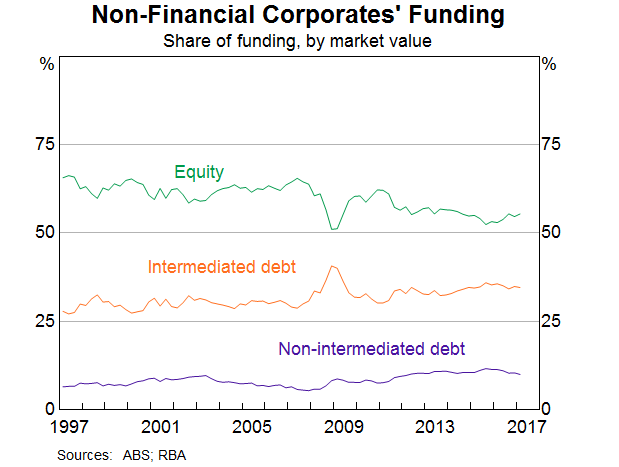
We can also view this through the funding composition of non-financial corporations in the National Accounts, published by the Australian Bureau of Statistics (ABS) (Graph 3). Intermediated debt is much greater than non-intermediated debt for that part of the economy.
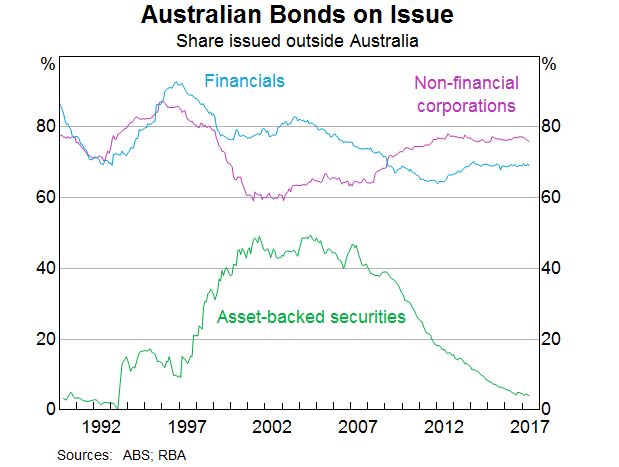
Another way to cut the data is to compare bonds issued domestically with those issued offshore. Offshore issuance is attractive for a number of reasons. The deep, liquid markets that exist in the United States, for example, offer attractive issuance opportunities for those seeking large amounts of funding (Graph 4). As a result, most of the issuance by Australian residents is offshore. The exception is for asset-backed securities, most of which are now issued domestically (although those can still be purchased by non-residents).
Interestingly, the international dimension of the Australian fixed income market is not limited to Australian residents issuing overseas. Non-residents also issue in Australia, and issue Australian dollar debt overseas. These types of issuance have been increasing steadily since the financial crisis (Graph 2). It may surprise some that non-resident issuers account for just as much bond issuance as domestic non-financial corporations. (Of non-resident issuance, supranational, sovereign or quasi-sovereign agency entities account for a large share of the market.[2])
So far, my discussion has been based on volumes. By itself, it might give the impression that finance from fixed income markets has been a bit harder to come by than before the financial crisis (at least for a range of non-government issuers). While there may be an element of truth to this, in large part the slower growth of funding from this source reflects low demand (by issuers to raise funds) and the availability of other sources of funds. To understand that point, it's also important to have a look at prices. They suggest that funding is readily available.
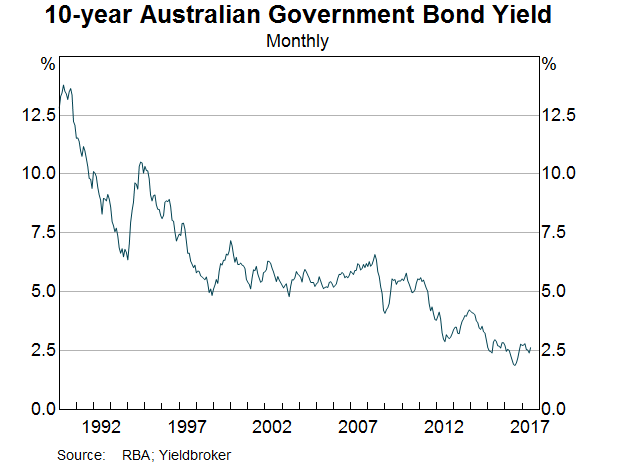
Starting with the Australian government market, we see what should be a familiar story to many people here: a downward trend in yields since the global financial crisis (Graph 5). We have seen a slight uptick since the latter part of 2016. That uptick has been part of a global shift in yields. In many respects it is welcome because it reflects better prospects for global growth and inflation. Even so, that pick-up in rates is quite modest and only takes yields back to levels of a year or so ago. Hence, rates remain close to historical lows. As I mentioned, funding is available at favourable rates.
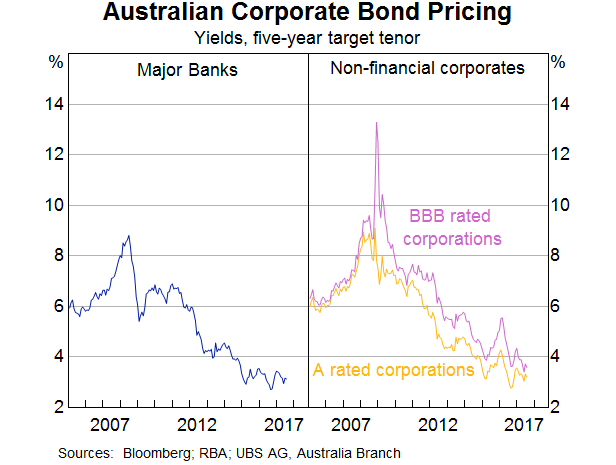
A similar pattern can be seen in private sector yields (Graph 6). We see the modest uptick lately, following a long run downward trend. However, the experience during the crisis was different from that of government debt. Naturally, interest rates faced by the private sector spiked up (particularly for lower-rated debt) as the appetite for risk contracted sharply.
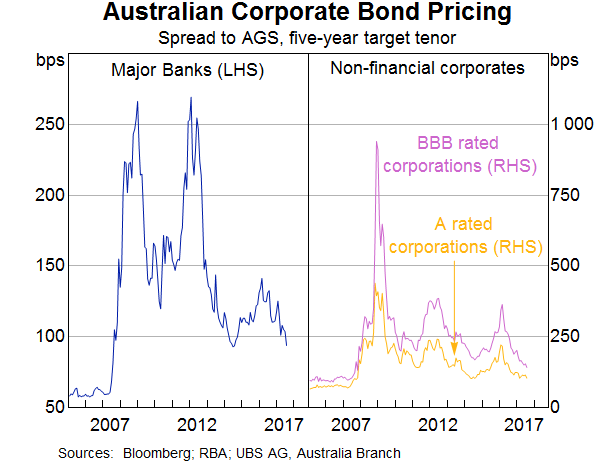
The differences between what happened with private sector and government yields can be seen clearly by examining spreads (Graph 7). The spike in spreads during the crisis is obvious. But they have come back from those levels. And even though they are higher than the levels prior to the financial crisis, spreads are still at low levels. Again, funding from these markets is available on favourable terms.
Links from the ‘Real’ Economy to Financial Markets and Back Again
So far I've given you a standard run-down of securities markets. This would be familiar ground for many. Now I would like to turn my attention to the links that some of these developments have to the wider economy.
These links can be profound. We saw this spectacularly during the global financial crisis. What happened then is well known and I will not retell that story now. However, it is worth remembering that developments in the slicing and dicing of American mortgages had tangible effects that went well beyond the US economy. Australia, fortunately, weathered the global financial crisis without the sort of pain seen elsewhere in the world. But its effects were clearly evident across the economy, including in fixed income markets, as I have already mentioned.
Developments in the market for wholesale debt can affect the costs of funds for banks, and thus have implications for the wider economy. Indeed, a material change in the cost of funds for banks would, by itself, contribute to a change in financial conditions. In this context, the spikes in spreads associated with the global financial crisis, and then later during the European debt problems in 2012, are notable (Graph 7).
In the light of recent increases in long-term government bond yields across a range of advanced economies, it is worth highlighting some key points about the cost of banks' funding. The first point to reiterate is that yields on longer-term government debt are still quite low; monetary policy remains very accommodative across advanced economies and inflation remains low. Moreover, given the decline in bank bond spreads since mid 2016, the same is true of the costs of banks' funding in longer-term wholesale debt markets (Graph 8). Funding costs in short-term debt markets are also low.
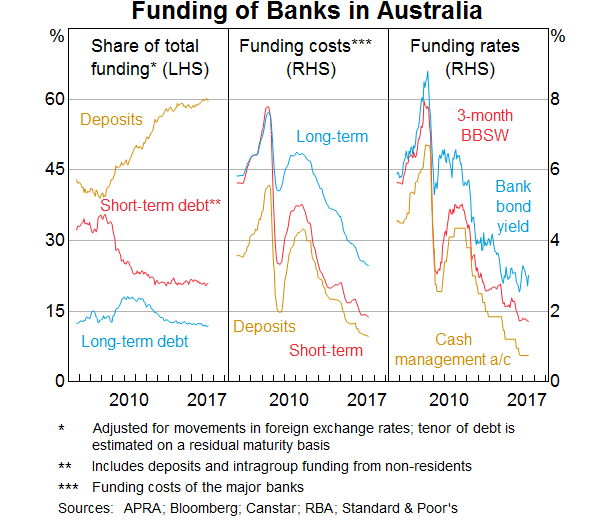
Second, banks' use of wholesale debt markets (both short-term and long-term) is much less than it was a few years ago. Since the financial crisis, a much larger share of funding is obtained via deposits; the fall in the share of short-term debt over the past decade has been quite stark.
Third, our estimate of the average outstanding funding rate for banks has declined by close to 10 basis points since late last year, and the marginal rates of funding are currently a little below the average outstanding rates.
The market for bank wholesale debt has played an important role in facilitating capital flows to and from Australia. Net inflows of debt attributable to Australian financial institutions (more specifically, authorised deposit-taking institutions (ADIs)) were significant prior to the financial crisis (Graph 9). However, that has not been the case since then. Indeed, in some years the financial sector has experienced net outflows of debt. In part, this probably owes to the behaviour of the non-mining private sector, as savings from that part of the economy went up and investment remained lacklustre. As a result, banks – which are important intermediaries between the private non-mining sector and the rest of the world – didn't need to issue as much wholesale debt and they were able to make use of deposits for a greater share of their funding. Instead, since the crisis the net capital inflows to Australia – which are the mirror of our current account deficit – have been dominated by the government and the mining sector.[3]
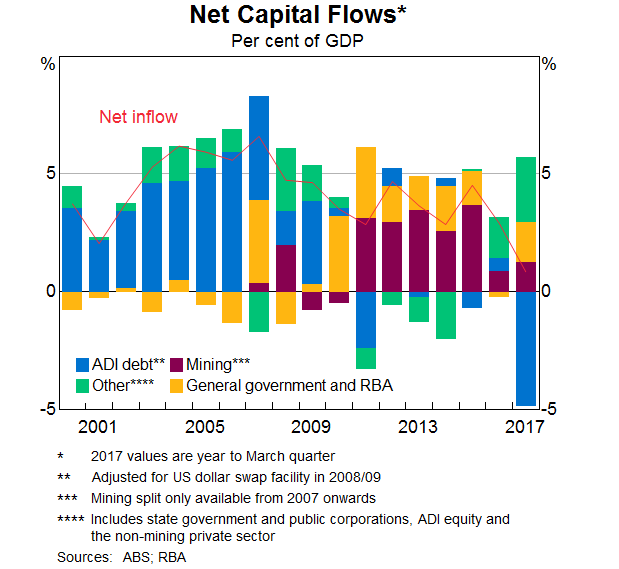
Australian federal government issuance rose after the financial crisis as the federal budget went into deficit (Graph 1). This was, in part, an automatic consequence of the slowing economy we had at the time. However, there were some added stimulatory fiscal measures introduced to support economic activity, which is well known.
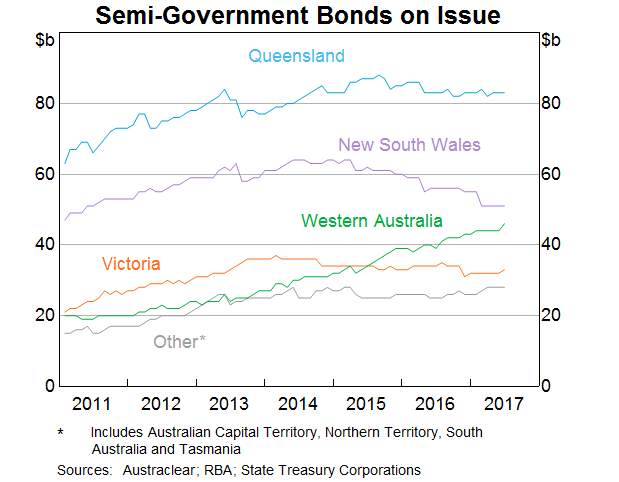
Perhaps less appreciated is the fiscal position of the state governments. They too experienced larger deficits, but that upward trajectory in their bonds outstanding had generally stopped a few years ago. Why has this happened? For a clue we can look at bonds outstanding by state (Graph 10). We see that New South Wales has seen the largest decline of outstanding bonds, while the mining state of Western Australia has headed in the opposite direction. These patterns are not so surprising. The Western Australian economy has experienced a bumpy road following the commodities boom. On the other hand, New South Wales is faring relatively well; revenues associated with the strong property market, in conjunction with asset sales, has provided the opportunity to reduce the value of bonds on issue. The message is that state debt has been affected by state specific economic developments, which in the case of New South Wales has helped to bring down debt.
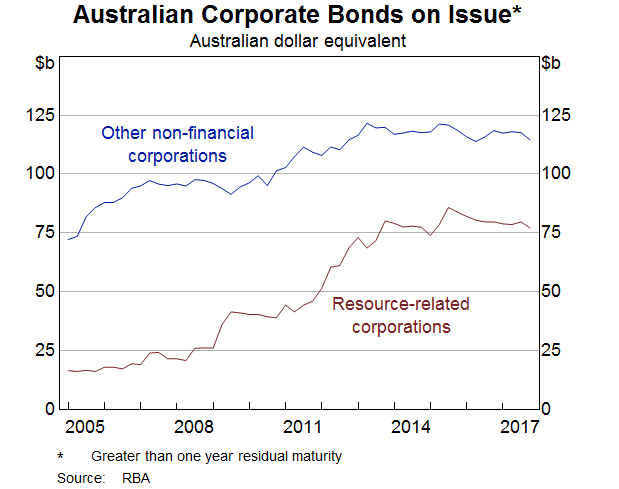
We also see the imprint of developments in the real economy quite clearly in the market for non-financial corporate debt. Moreover, there is some evidence of conditions in debt markets influencing the behaviour of firms in the mining sector. The mining boom required significant financing. As we have observed previously, much of that finance was raised internally.[4] However, mining companies also accessed external finance. Some of that came from banks, but a large share came from the bond market (Graph 11). Resource and resource-related companies increased their bonds on issue by three-fold from 2008 to 2015, encouraged by strong growth in commodity prices, favourable interest rates on debt, and the need to fund a large rise in investment.
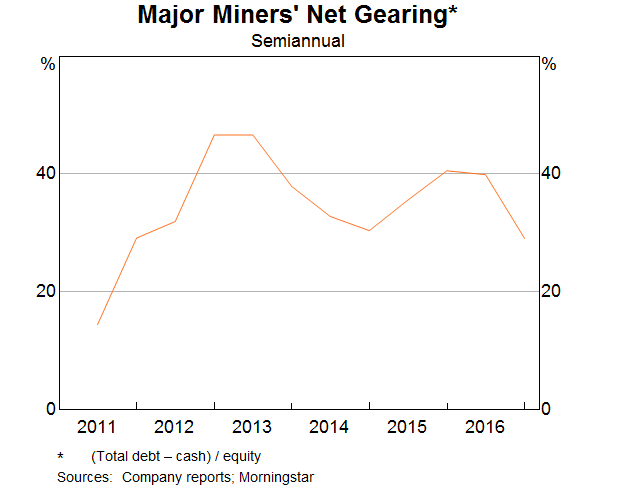
A broader measure of debt that captures other sources of funding, including from banks, is gearing (which is the ratio of net debt to the book value of equity). Up to 2013, the gearing ratio of the major miners had increased significantly, and for some companies it was at quite high levels (Graph 12).
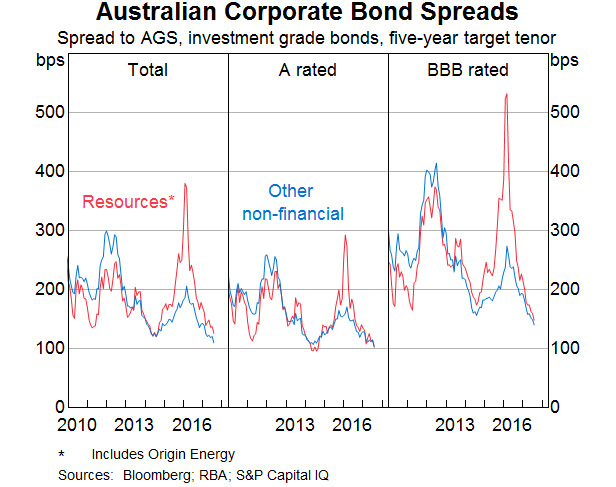
The larger-than-expected declines in commodity prices (since 2012) had a marked effect on pricing in the bond markets and on the behaviour of resource companies. The sharp rise in bond spreads on resource company debt from 2015 into early 2016, in response to the large declines in commodity prices, signalled the concerns in these markets about the health of some resource companies (Graph 13).
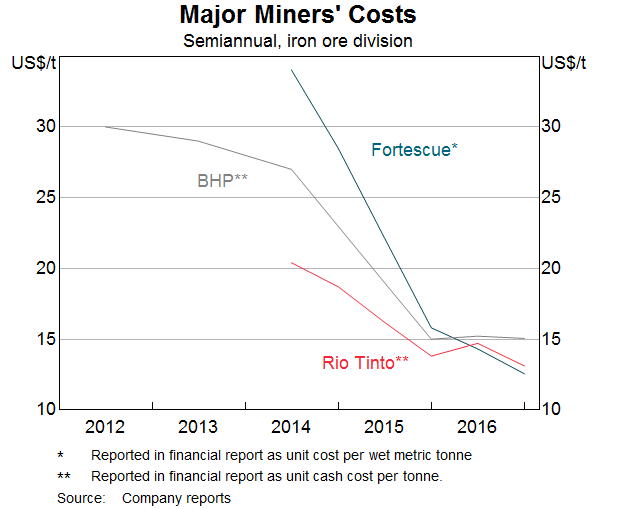
Not surprisingly, mining companies responded to those signals in commodity and bond markets by reining in their costs significantly (Graph 14). Part of that may well have come from gains in efficiency that followed from earlier investment in capacity. But much of it was driven by a reduction in expenditure on a wide range of things. Indeed, cutbacks across the resources sector, in addition to the planned reductions in mining investment, had a very noticeable effect on aggregate demand in Western Australia and Queensland over recent years. The associated reductions in spending allowed the mining companies to reduce the extent of their debt, and repayment of bonds has played an important role in that process.
Conclusion
This has been quite a tour of fixed income markets. They constitute a non-trivial share of financing, not just for governments, but also for businesses. For the private sector, though, growth in this source of funds has remained less than it was prior to the financial crisis. For the banks, that represents a shift to other sources of funds, notably deposits. Moreover, it has also been reflected in the banks no longer being a conduit for capital flows into Australia, in contrast to their key role before the financial crisis. For the mining sector, plenty of funding was obtained from fixed income markets, although, following the sharp fall in commodity prices, resource companies have reduced their debts. Non-mining corporations haven't stepped in to fill that breach as their investment demand remains modest. However, as is the case across a range of funding sources, finance appears to be readily available to credit-worthy firms in fixed income markets at favourable prices.
Endnotes
I thank Leon Berkelmans for invaluable assistance in preparing these remarks. [*]
This is typical of many economies, though not for the United States. See Ellis L (2016), ‘Financial Stability and the Banking Sector’, Address to the Sydney Banking and Financial Stability Conference, 12 July. [1]
Bergmann M and A Nitscke (2016), ‘The Kangaroo Bond Market’, RBA Bulletin, September, pp 47–52. [2]
Debelle G (2017), ‘Recent Trends in Australian Capital Flows’, Address to the Australian Financial Review Banking and Wealth Summit, 6 April. [3]
Arsov I, B Shanahan and T Williams (2013), ‘Funding the Australian Resources Investment Boom’, RBA Bulletin, March, pp 51–61. [4]
