Speech Resilience and Ongoing Challenges
It is a real pleasure for me to be back in Adelaide today. I would like to thank the Urban Development Institute of Australia (UDIA) for the invitation to be part of your National Congress in this beautiful city.
I previously spoke at a UDIA National Congress in 2010. That year it was held in Sydney. On that occasion, I spoke about how and why the Australian economy had come through the severe global downturn in much better shape than most other countries. I spoke about the expected upswing in mining investment and the positive effect that it was likely to have on our economy over the next few years. And I spoke about three specific challenges: the need to expand the supply side of the economy; the need to get a better balance between supply and demand in the housing market; and the need to ensure that inflation remained low and stable.
In the six years since then, a lot of water has flowed under the bridge. The global economy has had a recovery of sorts, although the average growth rate is still below what it was before the crisis. In Australia, the expected boom in mining investment did take place, leading to a large increase in our production capacity. For a time, this did result in the economy growing at an above-average pace, but this has been followed by a few years where growth has averaged below trend as mining investment returned to more normal levels. In terms of the challenges that I spoke about six years ago, the issue of expanding the supply side of the economy and boosting productivity growth is just as pressing as it was then. A bit more positively, in the housing market we now appear to have a better balance between supply and demand. And in terms of inflation, the outcomes in Australia – and almost everywhere around the world – have been lower than was earlier expected.
Today, I thought it might be useful to again touch on these broad themes – the resilience of our own economy, the productivity challenge, the balance in the housing market and the inflation outlook.
The Resilience of the Australian Economy
So first to the Australian economy. Here, the main point to emphasise is the resilience of our economy and its ability to adjust.
A few years back when we were looking down from the peak in the mining boom, there was considerable trepidation in some quarters about how Australia would manage over coming years. With commodity prices already declining and talk of an upcoming mining investment cliff, there were concerns about where the growth in output and, more importantly, the growth in jobs would come from.
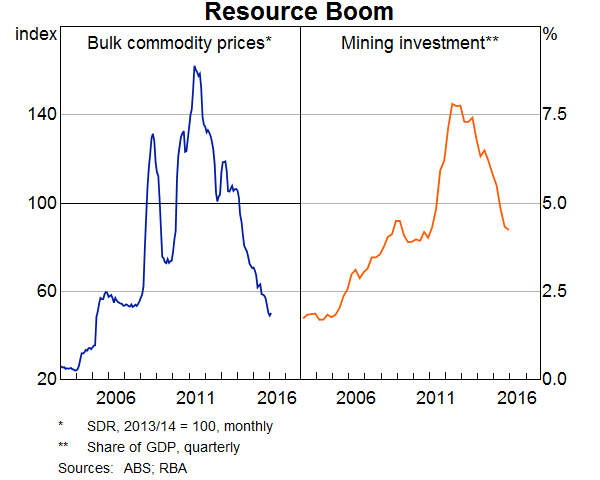
As things have turned out, though, we have managed pretty well so far, despite what has been a fairly difficult environment. Over the past two years, the prices of our commodity exports have declined by 40 per cent (Graph 1). Mining investment has also declined by almost 40 per cent, which is the equivalent of nearly 3 per cent of GDP. Yet over these two years, our economy has continued to expand at a reasonable pace, with growth over 2015 having been a bit stronger than was earlier expected and not too different from the long-term average.
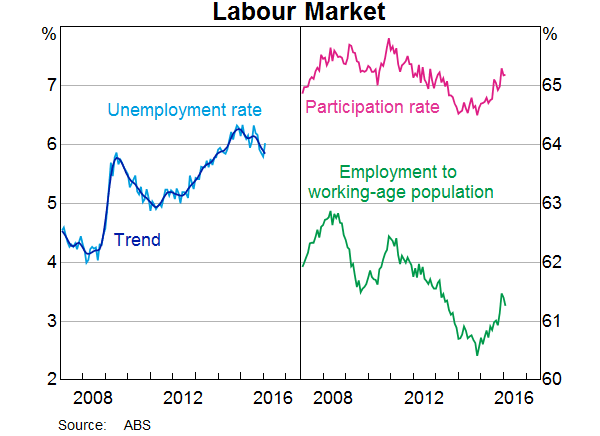
Importantly, there has also been sufficient growth in aggregate demand over recent times to keep the unemployment rate broadly steady and to accommodate a rise in the participation rate (Graph 2). Again, taking the past two years together, annual employment growth has averaged almost 2 per cent, which again is not too different from its long-term average. It is also a bit above population growth, so the share of the working-age population that is employed has also risen by around ½ percentage point over the past two years.
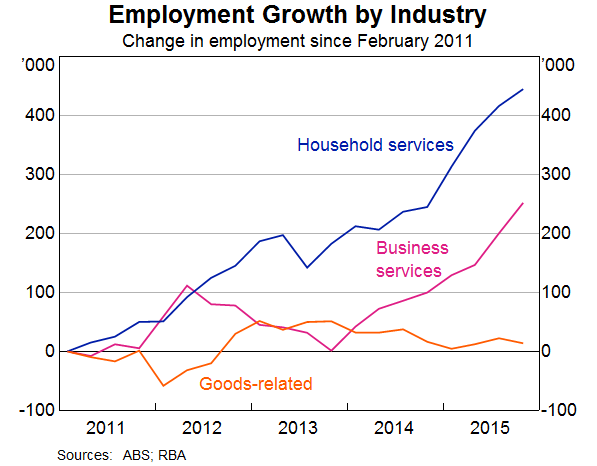
The job creation has been particularly strong in a range of household services (Graph 3). Health care has been a stand-out, with annual growth in jobs averaging about 4½ per cent over the past two years. There has also been strong growth in jobs in business services, following a period of weakness a few years ago when exploration activity and pre-construction work in the resources sector were being scaled back. In contrast, there has been little job creation in the goods-related industries over recent years.
This picture of our economy adjusting reasonably well to the changed circumstances is also evident in a number of other indicators. Over recent times, most business surveys have suggested that conditions have been around, or a little above, average. Business credit growth has picked up after having been subdued for quite a while. And last week's national accounts confirmed that growth in household spending has also picked up.
While none of these indicators suggests that we are on the cusp of a return to the type of growth rates we saw before 2008, they do suggest that the economy is successfully rebalancing following the mining investment boom.
This resilience reflects, in part, the flexibility of three key prices: the exchange rate, the price of money (or interest rates), and the price of labour.
The effect of the exchange rate depreciation is evident in the improved conditions and prospects for a number of industries, including tourism, education, agriculture and parts of manufacturing. Just as the earlier appreciation helped the economy avoid overheating during the resources boom, the depreciation is now helping the economy adjust to lower commodity prices and lower investment in the resources sector.
The effect of low interest rates is most clearly evident in residential construction activity, which increased by 10 per cent over 2015. This strong growth is having positive spillovers to other parts of the economy. Over coming quarters, we can expect a further increase in residential construction, although at a slower rate than seen recently.
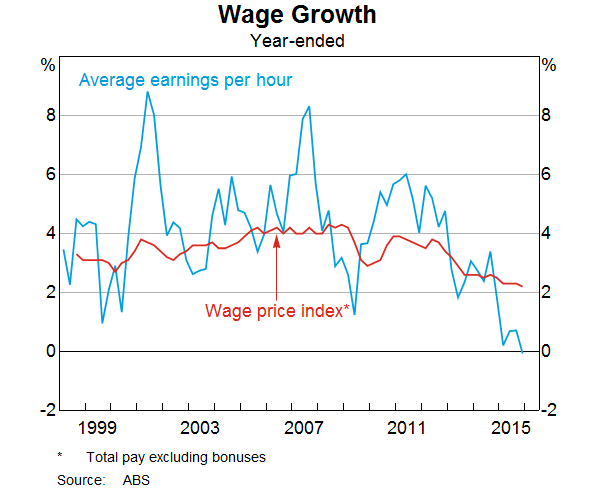
Finally, the low wage growth is one of the factors that has underpinned the reasonably positive employment outcomes. Over the past year, the Wage Price Index (WPI) has risen by just 2¼ per cent, the lowest outcome in the 17-year history of this series (Graph 4). Lower still is the growth rate in average hourly earnings measured by the national accounts. This measure, which takes into account compositional and other effects that are not captured by the WPI, is unchanged over the past year. These types of wage outcomes are much lower than what most people had become used to and lower than suggested by the historical relationship between wages growth and unemployment. While this low wage growth is one factor constraining consumption growth for many individual households, importantly, it means that more people have jobs and this is clearly a positive for both aggregate household spending and the broader society.
So the flexibility in these key prices – the exchange rate, interest rates, and wages – has served us well.
Our central scenario remains for growth in output to be a bit below trend over 2016, but then gradually to strengthen as the drag from lower commodity prices and mining investment wanes, and more of the increased capacity in the LNG sector comes on line.
The main risks to this central scenario still seem to lie in the international sphere.
The first couple of months of 2016 have been volatile ones in bond, equity and commodity markets. Our largest trading partner, China, is going through a difficult transition to a more consumption-led and service-based economy and is dealing with high levels of corporate debt and the complications of opening its capital account. On the monetary front, interest rates in the United States were recently increased for the first time in nine years, while the Bank of Japan unexpectedly moved one of its key interest rates into negative territory. In doing so, it joined the European Central Bank, the Swiss National Bank, the Swedish Riksbank and the Danish central bank with negative rates. And in a number of countries, there is an expectation that yet further monetary easing will take place.
It remains to be seen what all this means for us. The recent international data have been mixed but, at this stage, do not suggest that momentum in the global economy has been lost. The monetary easing abroad is a complication for us, as it tends to put downward pressure on the currencies where the easing is taking place and thus upward pressure on the Australian dollar. More positively, lower oil prices – which primarily reflect increased supply capacity – are mostly good for global growth: they lower the cost of production for almost every firm in the global economy and put more money in the hands of consumers. The lower oil prices do, however, create financial strains for some economies and for some companies.
So there are lot of cross-currents here that we are watching very carefully at the moment.
I now want to move to the three challenges that I spoke about in 2010.
Expanding the Supply Side – Productivity
The first of these was expanding the supply side of the economy – or lifting our productivity.
Six years ago, the focus was on ensuring that the economy had sufficient productive capacity to avoid overheating during a period of strong demand flowing from the resources boom.
Today, the focus is a little different. While we have done a pretty good job of adjusting to our changed circumstances, the not-so-good news is that growth in real income per capita in Australia has stalled (Graph 5). Indeed, average real income is no higher today than it was in 2008. This follows a 17-year period in which growth averaged a remarkable 3.1 per cent per year. During this earlier period, we benefited from: (i) strong productivity growth in the 1990s; (ii) a very large rise in our terms of trade; and (iii) favourable demographics, which helped increase the share of the population in paid employment.
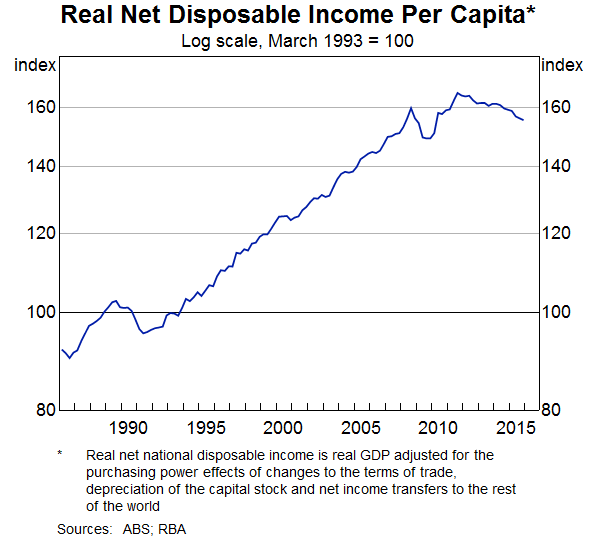
In all three of these areas, recent outcomes have not been as kind. It is more than coincidental that the timing of this change in our fortunes broadly coincides with the timing of increasing pressure on the federal budget, an increase in the general sense of economic uncertainty, slower gains in some asset prices and slower growth in wages and profits. Inevitably, when income growth is weak the effects are felt broadly through the community.
Looking ahead, we should be able to look forward to somewhat better outcomes than over the recent past. We could expect that the drag on our national income from falling commodity prices will eventually lessen. And if current trends in employment continue, we could look forward to some further increase in the share of the population in paid employment. Both of these would be positive for real income growth. Australia's fundamentals also remain sound. We have a tremendous base of natural resources, a talented, diverse and growing workforce, a stable political and legal system, a highly regarded university system, and we are well placed to benefit from the increasing demand for services from Asia.
But there is no escaping the fact that future growth in the average income of Australians relies largely on our ability to lift our productivity. While the rebalancing and resilience of our economy is certainly something to welcome, the longer-term challenge is to lift our living standards through finding new things to do and better ways of doing what we currently do. The need for this is made more pressing by the fact that the growth momentum in the global economy is less than it once was.
Ultimately, productivity growth is heavily reliant on decisions made by businesses. But policy decisions can also make a difference. Here, there is no shortage of ideas. They cover strengthened competition policy, better provision and pricing of transportation infrastructure, developing a strong innovation culture, creating strong incentives for entrepreneurship and hard work, and investing in high-quality education. The task we collectively face, then, is to identify the right specific policies in each of these areas and then find ways of implementing them. Clearly, this is not an easy task, but neither is it an impossible one.
Housing
I would now like to turn to the second issue – the balance in the housing market.
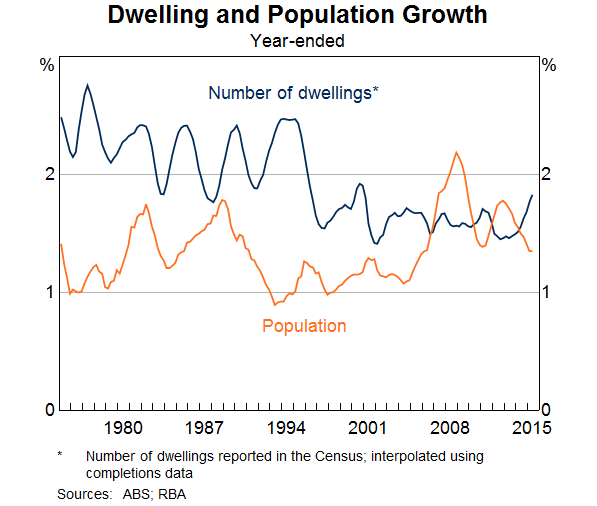
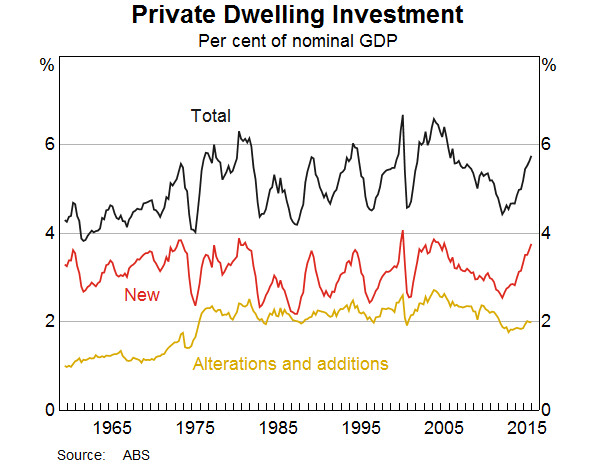
Again, when I spoke six years ago, the focus was on the pressures in the housing market arising from the rather unusual situation of having the growth rate of the population exceed that in the number of dwellings by a substantial margin (Graph 6). Since then, population growth has slowed, and the rate of growth in the dwelling stock has increased so that it now once again exceeds that of the population. Reflecting this increase, the share of GDP accounted for by the building of new dwellings has risen significantly and is now close to the various peaks reached over the past 50 years (Graph 7). Notwithstanding this, with spending on alterations and additions being relatively subdued, overall investment on residential construction remains some way below the previous peaks.
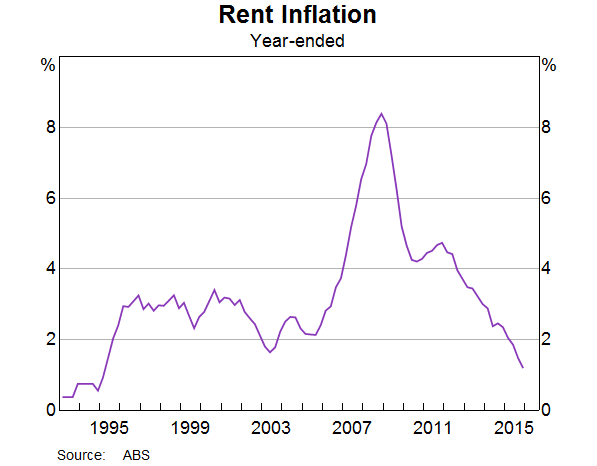
This increase in the supply of dwellings has come on the back of a large run-up in housing prices in Australia's two largest cities. But the increase in supply now looks to be contributing to some moderation in the rate of increase in housing prices in these cities. It is also putting downward pressure on rents, with the CPI measure of rent inflation running at just 1.2 per cent in 2015, the lowest for 20 years (Graph 8). Whether or not these trends are maintained remains to be seen, and so we continue to watch developments in the housing market very closely. However, the overall picture does appear to be one of a better balance between supply and demand than was the case in 2010.
As I noted earlier, the lift in residential construction has been an important element in the cyclical rebalancing of the economy. In the period ahead, we can expect a further increase in residential construction, although at a slower rate than took place last year. While this more modest increase will mean a more modest boost to overall GDP growth from home-building, it should assist with the sustainability of the current boom in residential construction. It is unlikely to be in our collective interest to have a further surge in the construction of new dwellings, as a share of the economy, then to be followed by what would surely be a larger and more prolonged decline later on. Overall, the recent data on building approvals suggest that we are on a reasonable path here.
From a longer-term perspective, the challenge of providing an adequate supply of reasonably priced housing for an increasing population rests largely on the flexibility of land supply and, in particular, the supply of well-located land. This is because high housing costs largely reflect high land prices, not high construction costs. Here, it is zoning regulations and the transportation infrastructure that can make a material difference. In both areas, progress has been made since 2010, but there is more to be done.
Inflation
The final issue is the inflation outlook.
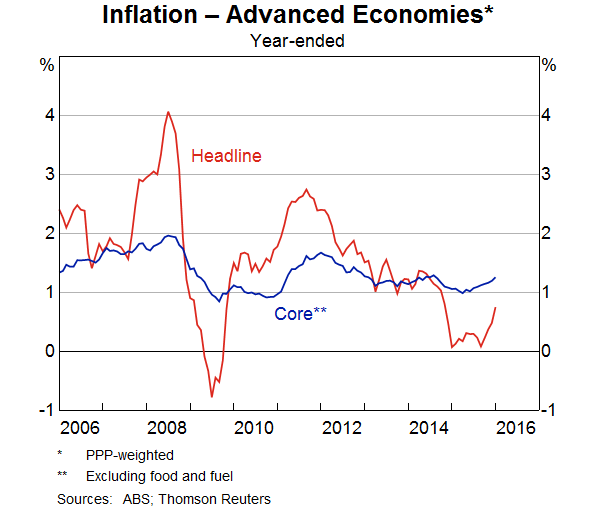
Six years ago, inflation rates in almost all advanced economies were below the midpoint of central bank targets. This remains the case today (Graph 9). The average core inflation rate across the advanced economies is very similar to that in 2010, and headline inflation rates are lower than they were then, because of the decline in oil prices over the past year.
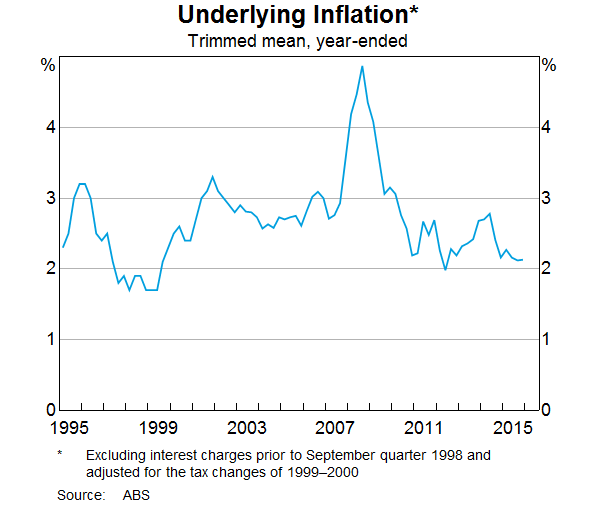
Six years ago, Australia was one of the few advanced economies in which inflation was not below the midpoint of the target (in our case, 2½ per cent) (Graph 10). This was, perhaps, not surprising given the mining investment boom that was then taking place. But today, as in many other countries, we too find ourselves below the midpoint of the target, although by only a relatively small margin. Importantly, unlike most of these other countries, inflation in Australia does remain consistent with the medium-term target.
It would appear that in many advanced economies the inflation dynamics are a little different from those in the past. In earlier decades, it was very rare for central banks to worry that inflation and inflation expectations were too low. Yet today, we hear this concern quite often, and the ‘unconventional’ has almost become conventional.
One factor that has contributed to the low inflation outcomes is the fall in oil prices. But a more fundamental influence has been the low wage increases in most advanced economies. In a number of these economies, including the United States, Japan, Germany and the United Kingdom, the low wage increases have coexisted with fairly strong employment growth and not-so-strong output growth. This is evident in Graph 11. The left hand panel shows, for each country, average employment growth over the past two years relative to the long-term average. Similarly, the right hand panel shows recent GDP growth rates relative to the long-term averages. The pattern is reasonably clear: employment growth has been quite strong relative to historical trends, but output growth has not. It is also worth noting that each of these four countries is at, or near, conventional estimates of full employment.
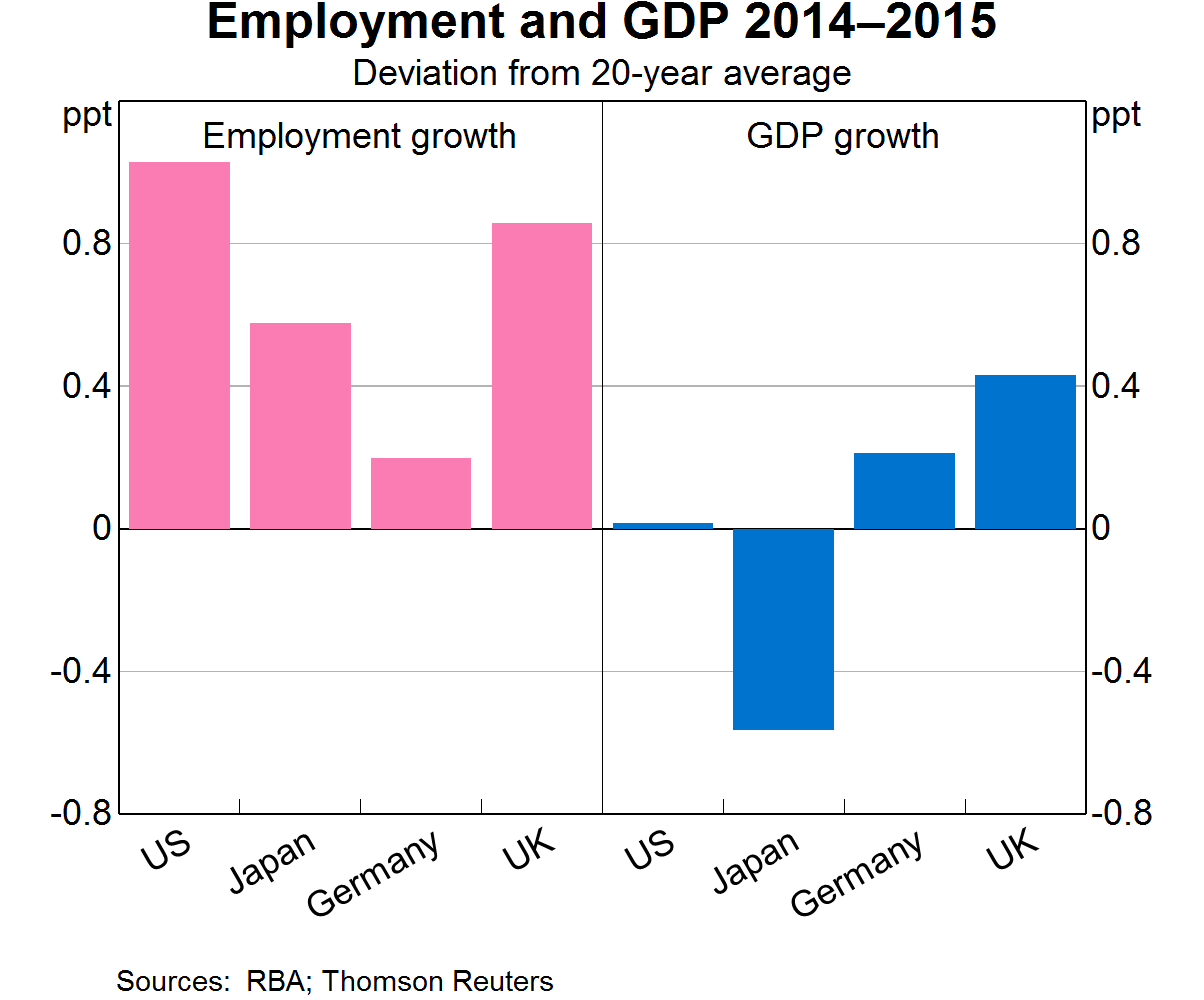
The commonality of this experience of low wage outcomes, strong employment gains and relatively subdued output growth suggests that some global influence may be at work. One possibility is that workers in the advanced countries perceive that they have less bargaining power than they had before, either as an after-effect of the financial crisis and/or the incremental globalisation of many service industries. Another possibility is that it is a reflection of the subdued growth in the global production of goods and the relatively strong growth in services, where output is more difficult to measure.
Whatever the reason, the dynamics of labour markets are critical to the future path of inflation. It is possible that wage outcomes will remain very subdued even in countries with strong labour markets. If this turns out to be the case, then it is likely that inflation rates will also continue to be very low and monetary policy very accommodative. Alternatively, what we might be witnessing is just a slightly longer lag in the normal relationship between employment growth and wages. If this is the case, a pick-up in wage growth and inflation may not be too far away. Here, the United States is a test case of sorts given that its recovery is most advanced. Recently, there have been some signs of a pick-up in inflation there and it will be worth watching what happens quite closely over the next few months.
For us, here in Australia, the continuing low wages growth means that CPI inflation is also likely to remain relatively low. While there is some upward pressure on the retail prices of imported goods as a result of the depreciation, this pressure is being muted by stronger competition following the entry of a number of overseas-based retailers into the Australian market.
As the Reserve Bank has indicated for some time, this low inflation outlook provides scope for easier monetary policy should that be appropriate in supporting demand growth in the economy. An important factor here will be whether the growth in aggregate demand continues to be sufficient to accommodate the growth in our labour force.
So, this brings me to the end of my remarks. I wish you the best of success for your National Congress. I hope that in another six years' time we can still be talking with some satisfaction about the resilience and growth in the Australian economy. And I suspect that the issues of productivity growth, the balance in the housing market and the inflation dynamics will be just as relevant as they are today, and as they were in 2010.
Thank you and I would be happy to answer any questions.
Endnote
I would like to thank Craig Evans for assistance in the preparation of this talk. [*]
