Speech The Economic Scene
Thank you for the invitation to visit Adelaide.
As you know the Reserve Bank Board met here yesterday and decided to leave the cash rate unchanged. The statement issued after the meeting gave the reasoning for the decision, in the usual concise fashion. Today I will give some broader remarks about the global and domestic economies and financial conditions.
The global economy has continued its expansion this year. Estimates for global growth are running at about 3¼–3½ per cent. This is a bit better than the 2013 outcome and close to, albeit a little below, the three-decade average, which is 3.6 per cent. We are now in September, so unless something pretty dramatic happens soon in one of the large economies, those estimates should be a pretty accurate guide to the annual outcomes.
For Australia's particular group of trading partners, weighted by export shares, growth is running at about 4½ per cent, which is somewhat above the 30-year average. This strength reflects the continued increase in the weight of China as a destination for exports. Even though China is growing more slowly than it used to – at a mere 7½ per cent this year – the fact that its growth is so much stronger than most others combines with its increased weight to push up the weighted-average growth of our trading partner group.
The determined pessimists among us will see the increased weight of China as a concern: what if something goes wrong and the Chinese economy experiences a sharp slowing in growth? In fact this is a question that could be put for most economies now – nearly 50 economies, including the United States, European Union, Japan, Russia and Canada, now have China as their number 1 or 2 trading partner. The full ramifications of the continuing rise in the weight of China's economy and, in time, its financial system in world affairs will be the topic for numerous lengthy books. But in short, the whole world is now more dependent on China than it was.
For today, probably the most important point to note is that the near-term task of the Chinese authorities is to manage the desired slowing in credit growth and moderation in asset values. Housing prices are falling in many Chinese cities at present. This is not unprecedented – it is the third time in the past decade this has occurred. (Yes, house prices can fall, even in China.) This area – the asset price and credit nexus – is the one to watch, more than the monthly exports or PMIs and so on.
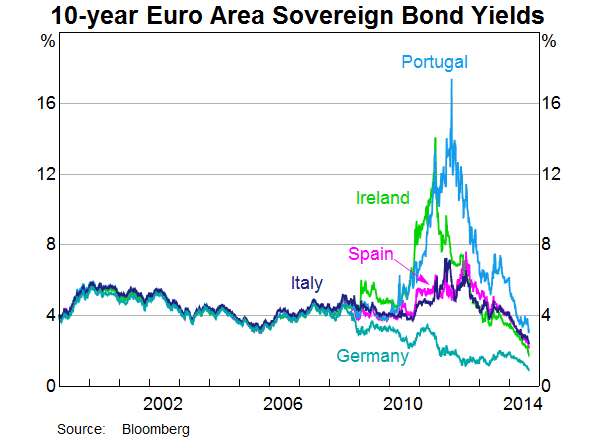
One of the most remarkable features of the international scene is the exceptionally low volatility of financial prices and the compression of risk premia. Yields on sovereign debt of the major countries are very low, the lowest on record in some cases. Spreads on investment-grade and financial corporate bonds have reached multi-year lows.
Nowhere is this phenomenon more striking than in Europe. Two years ago, some major European countries faced a crisis of sovereign credit. Their governments were experiencing borrowing rates that suggested that markets had very serious questions about their budgetary sustainability. Now, these same countries are borrowing more cheaply than they did in 2007, prior to the eruption of the crisis – even though they are now carrying considerably more debt than they were back then.[1]
Corporate borrowing costs are similarly low. Investment grade bonds in the US and euro area and Australia are yielding only around 100 basis points more than the equivalent government bonds and even ‘junk’ bonds from these countries are, on average, yielding around 6 per cent or less. Some entities (Graph 1) have issued debt with 50 or even 100-year maturities. Given the uncertainty about the state of the world over that horizon, the returns on offer to investors in financial claims seem strikingly low.[2]
Another pricing puzzle is exchange rates. Many in Australia have commented at length about the relatively high value of the Australian dollar against the US dollar. The Bank has made its views on this pretty clear and so I won't reiterate them today. But it's worth noting that many other countries have had a similar puzzle to ours – so the real question is why the US dollar has remained as low as it has.
Overall then, the global environment remains ‘interesting’, with significant challenges, uncertainties and puzzles. All that said, from Australia's point of view, the world economy continues to grow, inflation remains contained, our terms of trade though falling remain high, and financial conditions are remarkably accommodative.
On the domestic front, we had the latest estimates of national income and spending today. The latest quarter was expected to be one of slower growth than the preceding one, which had been quite a strong one, in part because of some temporary factors which could not continue. Taking the two quarters together suggests a picture of moderate growth.
There will no doubt be a huge amount of breathless analysis of these data and intense speculation about what they mean. It will be worth remembering to take a step back and look at the longer perspective. In that spirit, allow me to offer an update of a chart from a speech I gave here two years ago (Graph 2).
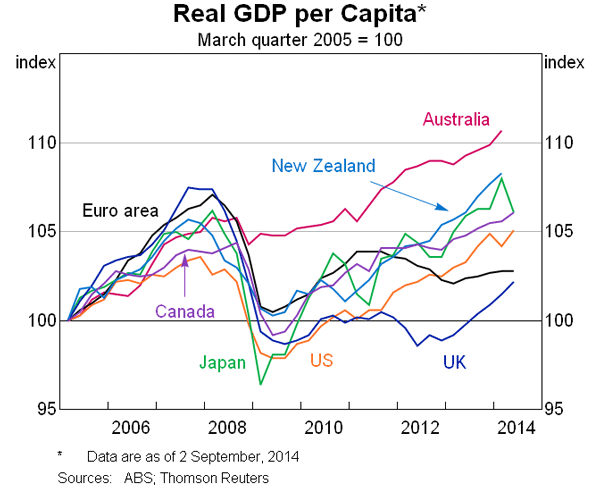
Compared with last time I showed you this, it is pleasing that the US and the UK have recorded some solid growth, and New Zealand – one of Australia's closest trading partners – has been growing particularly well, as the task of re-building much of their second largest city gets into full swing. Some of these countries have been recording growth faster than ours lately. That they have sped up, and may even be starting to close the gap, should be welcomed. This chart was prepared prior to today's data so the line for Australia is not quite up to date. Even so, there is still not much doubt about which country, among this group, has had the most consistent performance.
Of course these data are already somewhat dated. We can ask what has been happening more recently. The answer is that growth is continuing. Most survey indications are that business conditions have improved a little, and that household sentiment has recovered a fair bit of the fall seen in April and May. Those measures are close to average.
We have seen the unemployment rate print higher in July, after several months where it had not changed much. Because of measurement issues, interpretation of that monthly figure is even more hazardous than usual, and this may remain so in the months ahead. Nonetheless, the data cannot be dismissed and are, on their face, concerning. Other indicators have mostly suggested a slight improvement in the labour market this year, not an accelerating deterioration. The Bank's reading, which we have had for a while, is that the labour market has a degree of spare capacity, and that it will be a while before we see unemployment decline consistently.
Looking ahead, ideally, the non-mining part of the economy would see a further pick-up to grow a bit above trend for a while, having been below trend for a while up to recently. We may not be quite there yet, but we are I think slowly building a foundation for better performance.
What can we do to help this? The main thing the Reserve Bank can do is run an accommodative monetary policy so as to lend support to demand in the non-mining areas of the economy. Rates of interest are at very low levels, and have been steady there for over a year now. Most observers expect they will be there for some time yet. The rate we actually set, the overnight rate, is as low as it has been on a consistent basis in my lifetime. Rates of interest that matter more for most borrowers are similarly very low, and in fact have been declining slightly even though the Reserve Bank Board has not changed the cash rate for over a year now. They are lower than in recent previous cycles, even though the economy today is nothing like as weak as it has been on most of those occasions.
Monetary policy doesn't just work on the borrowers; the savers or investors matter too (and in fact there are more of them). The low returns on offer on safe investments in Australia, and the ultra-low returns on such assets internationally, are certainly having an effect by prompting investors to ‘search for yield’. Not only are returns on financial instruments low, but yields on the existing stock of physical assets – houses, commercial property, infrastructure assets – are being bid down. Some of that search is of course coming from offshore.
That's a big part of how accommodative monetary policy works: by prompting substitution towards higher-risk assets; raising asset prices, which increases collateral values and makes credit extension more viable; improving the cash flows of debtors; and so on.
All those things are quite normal parts of the so-called ‘monetary transmission mechanism’. In some ways that term is a misnomer because while some of the ‘transmission’ is somewhat mechanical, a lot of it isn't. It depends on the behaviour and general frame of mind of the myriad households, businesses large and small, investors and financial market players and so on. The final linkages in the ‘mechanism’ are those that connect changes in financial behaviour to changes in spending on real goods and services. And while high enough interest rates really can, more or less, force people to curtail their borrowing and spending, low rates can't make them borrow and spend. They have to want to.
The power of monetary policy to boost domestic demand depends importantly on some sectors of the economy being in a position to respond to lower costs of debt, higher collateral values, reduced incentives to save and so on, by spending more today, with confidence that their income in the future will allow them to service and repay the debt.
Which sectors would be available to lead such an expansion? In the broad, there are three. There are households, governments and firms. Let's think about each briefly.
Households being willing to increase their debt and lower the share of current income being saved was a striking feature of Australia's economic landscape from the early 1990s until just prior to the financial crisis. Consumption spending consistently rose faster than income and the ratio of debt to income went from about 60 per cent in 1993 to 150 per cent by 2006. Households are servicing that higher debt quite well – mortgages make up most of their debt and arrears are running at about one half of 1 per cent, which is low by global standards. But as I have argued before, it seems unlikely that household debt can rise like that again.Nor would it be desirable. So while we can expect that household consumption spending can grow in line with income, or maybe a little faster given the rise in net worth over the past two years, the odds are against households being a driver of strong growth the way they were a decade ago.
What about the government sector? Most governments in Australia are trying to strengthen their own balance sheets by containing the build-up in debt that has been occurring.[3] Public final spending is scheduled, according to the stated intentions of federal and state governments, to be subdued over the next couple of years. In fact, it is forecast to record the most subdued growth for a long time. By and large then, the public sector is not in the phase of using its balance sheet to expand demand faster than normal.
That leaves the business sector. What can we say about its balance sheet? The business sector is of course very diverse. But in the broad we can observe that its leverage is mostly low, and probably lower than it was a decade ago in most instances, in contrast to either households or governments. It also seems that holdings of cash have been increasing of late (Graph 3). The available data from the listed company sector show a modest increase, leaving aside the resources sector. Looking at data from the financial aggregates, we can compare the evolution of business credit and business holdings of deposits and like products, over time (Graph 4).
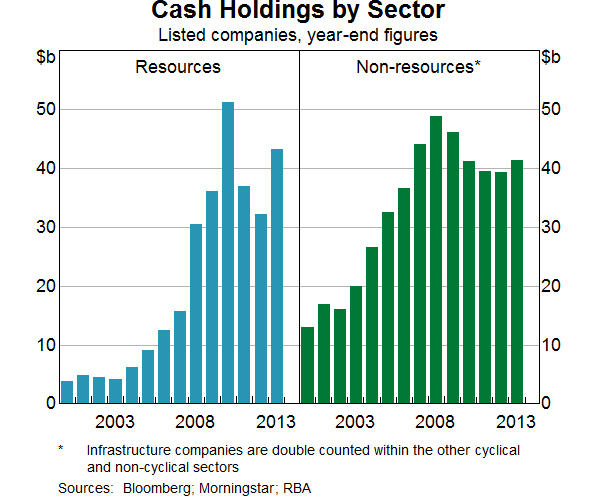
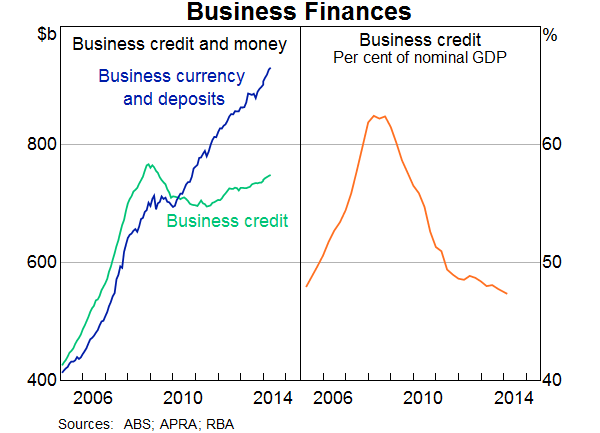
This data includes fund managers' holdings of cash assets, which from other data appear to have risen by close to $200 billion since 2006. But overall, this comparison suggests a very marked improvement in the liquidity of the business (and fund management) sectors' balance sheet over the past five years.
My conclusion would be that many businesses are in a position to play their part in the growth dynamic over time. The fact that in some areas outside of mining the level of gross fixed capital spending is barely above depreciation rates suggests that, over time, capital spending in those areas will have to increase. The forward estimates of non-mining business capital spending released recently do show a further upgrading of intentions. That won't offset the impending fall in mining investment and it would be good to see further, and more substantial, upgrades over time. But the available data suggest that things are at least heading in the right direction.
This is not some call for business leaders to play a role in driving growth out of a public-spirited desire to help the economy. That would be a fruitless call because doing that isn't their job. Their responsibility is to run their companies in the interests of the companies' owners. My argument simply is that, at some point, it is going to be in the interests of the owners for investment to take place in new technologies, better processes, new lines of business and, in time, more capacity. At some stage, the equity analysts, shareholders, fund managers, commentators and so on will want to be asking not ‘where's your cost cutting or capital return plan?’, but ‘where's your growth plan?’
As business responds to trends that foreshadow sustainable increases in demand and incomes, some of the response will come from smaller and newer players. Some of these will probably be among the most innovative enterprises. There isn't much focus on what these entities are doing in the general commentary on the economy, perhaps because there are fewer established data sets. Measuring innovation and so on is less straightforward than measuring how many building approvals were issued in any given month.
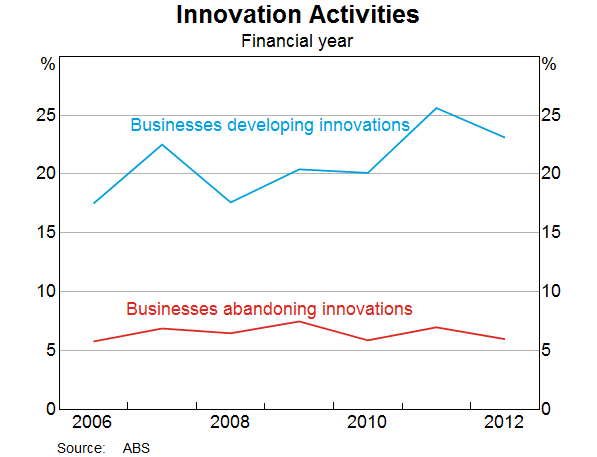
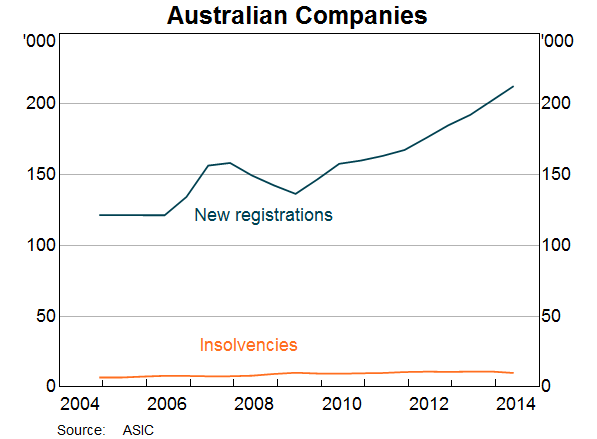
But my suspicion, admittedly based on some rather indirect measurement, is that innovation is occurring. For example, according to a regular ABS survey on innovation in Australian companies, the trend over recent years is for more companies to be developing innovations and fewer to be abandoning attempted innovations (Graph 5). We can also observe that growth in labour productivity per hour has picked up in the past couple of years, which suggests changes to practices in work places. And one crude gauge of ‘animal spirits’ – the number of new companies registered with ASIC – has been rising quite strongly since 2011 (Graph 6). No doubt there are all sorts of reasons for registering corporate entities, but perhaps this shows that there are some out there taking a risk.[4] And in the end, that's the vital ingredient for private sector growth.
Having talked a little about what monetary policy can do to help the current situation, I need to be clear that there are also things that it can't do, and some things that it shouldn't do.
Monetary policy can create conditions of easier funding and help the ability of the financial sector to extend credit. But it can't, for example, add to the supply of land zoned for housing, or improve the responsiveness of the construction sector to demand for additional housing stock. Other policies have to do that – and it's important that they do if we are to see easy credit result in more dwellings as opposed to just higher prices for the existing dwellings. Monetary policy can't create the additional infrastructure that most people agree we need. Funding conditions are not, in fact, an impediment to infrastructure. The real issues are governance, risk-sharing and pricing – areas where other policies have to be right. Monetary policy can't directly cause the innovation and technological change that is so important for wellbeing of our citizens over time. Other policy areas have to be right – and then the innovators and their backers have to be willing take the necessary risk.
As for things that monetary policy should try to avoid, we are also cognisant of the fact that monetary policy does work initially by affecting financial risk-taking behaviour. In our efforts to stimulate growth in the real economy, we don't want to foster too much build-up of risk in the financial sector, such that people are over-extended. That could leave the economy exposed to nasty shocks in the future. The more prudent approach is to try to avoid, so far as we can, that particular boom-bust cycle. It is stating the obvious that at present, while we may desire to see a faster reduction in the rate of unemployment, further inflating an already elevated level of housing prices seems an unwise route to try to achieve that.
Conclusion
The future has no shortage of challenges, but that is hardly new. Sensible policies in many areas are needed to help with the required adjustments. That includes monetary policy, within the limits of its powers. A very accommodative interest rate structure, and a degree of stability and predictability, has been in place for some time now.
Indeed the conduct of policy could perhaps be described as boring. If so, I would regard that as a small success. While the financial markets like to think about almost nothing else than what will happen to interest rates next month, I suspect most people are happy not to have to think about such things, and prefer focusing on issues of more enduring importance for their business or their lives. And it's those things that, well attended to, will deliver our future prosperity and wellbeing.
Endnotes
There is obviously the potential for multiple equilibria here. If market participants think debt is unsustainable, and borrowing costs correspondingly rise, that itself can be the thing which makes the position unsustainable. If the stock of public debt is, say, 100 per cent of GDP or more, and the rate of interest is 6 per cent rather than 3 per cent, that amounts to 3 per cent of GDP per year in additional servicing costs. Few governments could easily manage an increase in servicing costs of that size. [1]
How many such entities will exist in their current form when such debts fall due is an interesting question. Of the 30 companies that were included in the Dow Jones Industrial Average in 1964, about half had disappeared through merger, buyout or bankruptcy by 2014. [2]
Here it is worth noting that proposals to fund infrastructure spending by ‘asset re-cycling’ still amount to a fiscal stimulus, other things equal. Selling assets for this purpose is a financing device just like selling bonds. In one case the private sector is absorbing a real asset; in the other it is absorbing a financial claim on the government. Either way, the private sector is transferring financial resources to the government, who is then going to use those resources to acquire goods and services. In one case the government has less debt on its books, though also less assets. The effect on aggregate demand is the same. [3]
We might also look at how many patent applications are occurring. It appears that they increased strongly in 2013, but this was due to a change in legislation triggering a rush in applications just prior to new arrangements taking effect. So the underlying trend is not clear. See <http://www.ipaustralia.gov.au/uploaded-files/reports/intellectual-property-report-2014-low-res.pdf> [4]
