Speech Recent Developments in the Australian Housing Market

Christopher Kent
Assistant Governor (Economic)
Address to The Australian Institute of Building
Sydney –
- Audio 32.97MB
I would like to thank The Australian Institute of Building for the invitation to speak here today and the opportunity to discuss recent developments in the housing market.
Housing is important in our lives in many ways, including as a secure place to live, a key asset and an important vehicle for saving. Housing is also a source of employment for a lot of people, including for those in the business of developing, building and renovating, as well as for those who help us to trade and move between dwellings, and oversee the legalities, insurance and financing of housing-related transactions. Hardly surprising then that it's a frequent topic of conversation, including among economists. And it is not surprising that central bankers pay it close attention, given that it plays an important role in the business cycle, in the transmission of monetary policy and, as we've seen in many advanced economies of late, in the health of the financial system.
My plan today is to add to this conversation, reviewing what's been happening over the past year or two and discussing some of the factors affecting the outlook for the Australian housing market.
The Established Housing Market
Overall, the data over recent months suggest that demand in the established housing market is strengthening gradually, and this should help to underpin further moderate growth in dwelling construction.
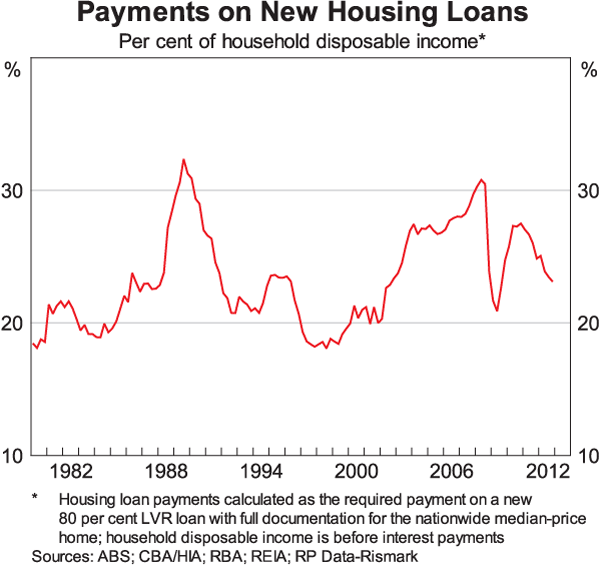
This general strengthening has been helped, no doubt, by 175 basis points worth of cuts to the cash rate since late 2011, and the decline in mortgage interest rates that has followed from these cuts.[1] Apart from a brief period after the onset of the global financial crisis, required mortgage payments on a new home are at the lowest level as a share of disposable income for the past decade (Graph 1).
An assessment of what's been happening to housing prices will depend somewhat on which market you are looking at and over what time period. For the country as a whole, housing prices have been rising gradually since about May 2012, and are now about 4 per cent higher than they were at that time (Graph 2). However, if you were a developer who had made plans and purchased land for development around October 2010, when housing prices last peaked, then you might be forgiven for focusing on the fact that house prices are still below their previous peaks in many locations. In particular, prices are still quite a way below their peak in Brisbane and Melbourne, while prices have been quite flat for a few years in Adelaide and outside of the capital cities in the mainland states.
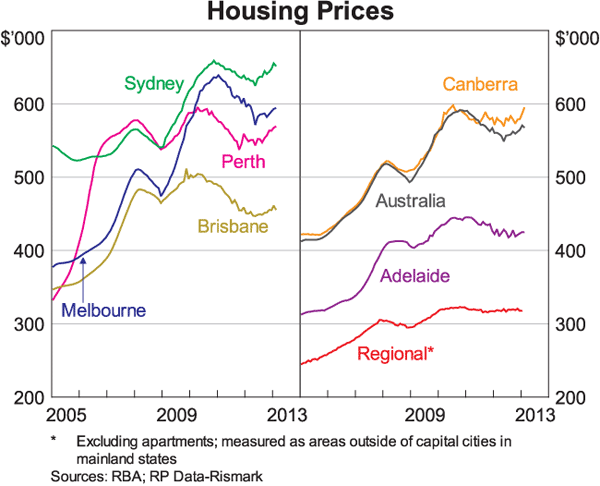
With interest rates low and housing prices having picked up in much of the country, more people are now confident that either housing prices will keep rising or at least not decline. We can see this in some of the available survey measures of housing price expectations. This is important for prospective entrants to the market, particularly for developers and investors, who might otherwise be wary of undertaking a new venture or purchasing a house for fear of a capital loss. But again, not all markets across the country are in the same boat. In Melbourne, for example, there is some question as to whether supply has moved ahead of demand, particularly in the market for apartments in the inner-city area. This possibility is certainly consistent with the fact that prices for houses and units in Melbourne are quite a bit lower than the peaks of early 2011.
The general improvement in sentiment is also apparent in auction clearance rates. After falling sharply in 2011, these rates recovered to around average levels in both Sydney and Melbourne in late 2012 and they appear to have increased further early this year. This move may in part have been helped by a tendency of vendors to adopt more realistic expectations, as evidenced by a rise in vendor discounts – that is, the extent to which a property sells below its listed price. These discounts had risen gradually as the market weakened through 2011; more recently, the degree of vendor discounting has returned to more normal levels.
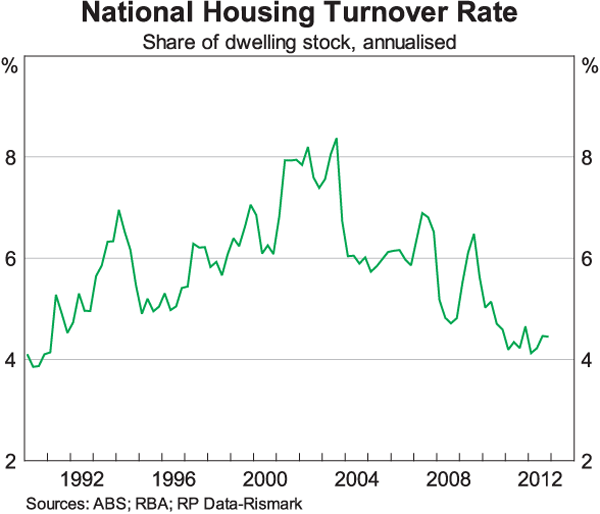
Despite the improvement in conditions in the established housing market, turnover remains quite low, at least by comparison with most of the previous decade (Graph 3). However, it may be that the experience of that era is not the right comparison. Perhaps we shouldn't expect to see turnover sustained at those very high rates again. If that is right, it means that those who make a living from turnover – real estate agents being the most obvious example – are unlikely to see a return to the easier days of the first half of the previous decade.
Financing
Over the past 20 years or so, upturns in the housing market have been accompanied by an increase in the growth rate of credit. But those years were also a period of structural change as the economy moved to a higher level of household indebtedness (Graph 4). Generations of households yet to buy their first home, or still wanting to trade up, were taking advantage of easier access to credit, which among other things had been facilitated by the shift to lower inflation and lower interest rates in the early 1990s.[2] As part of this change, the household saving rate declined and housing prices increased, at times quite rapidly. With household indebtedness no longer moving up since 2006, this long period of adjustment now seems to have run its course.
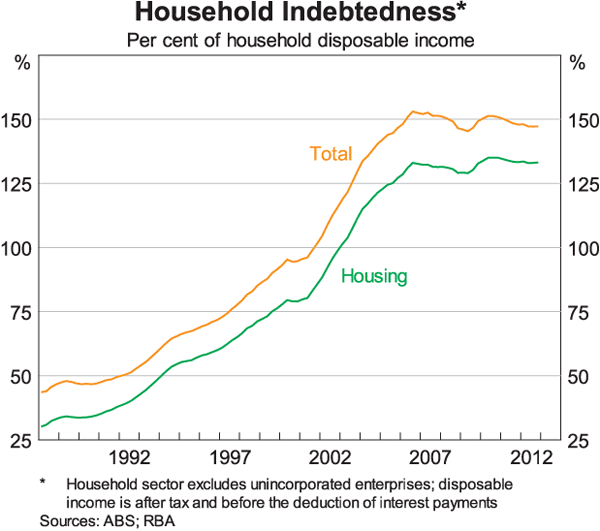
Indeed, in recent years we have seen a rise in the household saving rate and relatively stable household debt as a share of income. This suggests that we should not expect housing credit to grow anywhere near as rapidly as it had in previous upturns. Moreover, while the recent pick-up in housing prices would tend to imply growth in housing loans – since buyers typically fund those purchases with debt – this effect will be lessened by the low level of turnover in the established housing market.
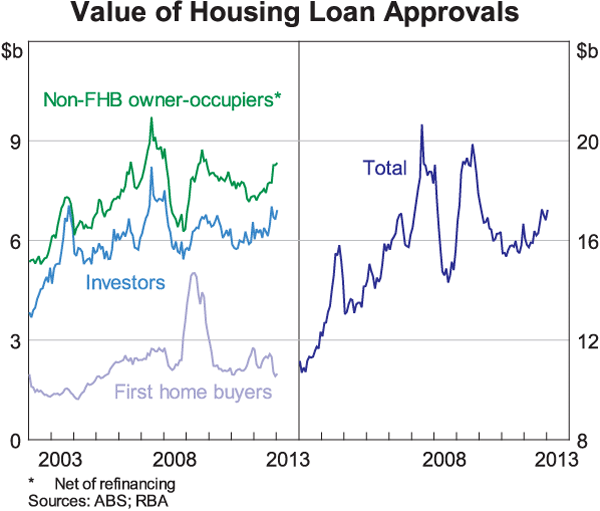
Even so, the availability of credit does not appear to be a constraint for most homebuyers and investors. The decline in mortgage interest rates since 2011 has underpinned a moderate increase in the value of total housing loan approvals over the past six months (Graph 5). This has been driven by demand from repeat-buyer owner-occupiers as well as investors.[3]
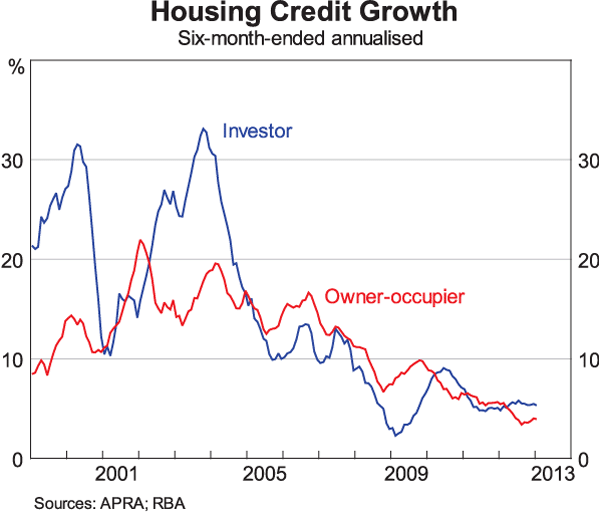
Despite the moderate pick-up in new lending, growth in housing credit has not increased significantly and remains broadly in line with growth in incomes at an annual rate of around 4½ per cent. Lower interest rates have given households more scope to make payments on their mortgages ahead of schedule. This means that for a given growth rate of new lending, credit growth will be a bit lower than otherwise. We can see this effect in the behaviour of owner-occupier housing credit. From early 2012, shortly after mortgage rates started to decline, owner-occupier housing credit has been growing at a slower pace than investor housing credit (Graph 6). This makes sense because the incentive to make excess mortgage payments is greater for owner-occupiers than investors given the different tax incentives they face.
While finance is available to households on relatively favourable terms, some developers continue to report difficulties in obtaining finance for new construction, with banks requiring a higher proportion of pre-sales than was typical prior to the global financial crisis. According to the Reserve Bank's industry liaison, large developers that have a good reputation and a strong balance sheet have access to credit, while small developers have tended to experience more difficulty in borrowing funds.
Dwelling Investment
The availability and relatively low cost of finance for home purchasers combined with improving conditions in the established housing market have been supporting dwelling construction in recent quarters. The expectation is that dwelling investment will continue to pick up from here. However, it is hard to know how strong this pick-up is likely to be.
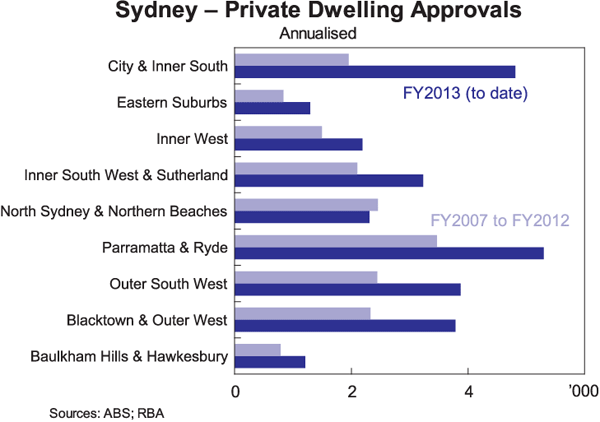
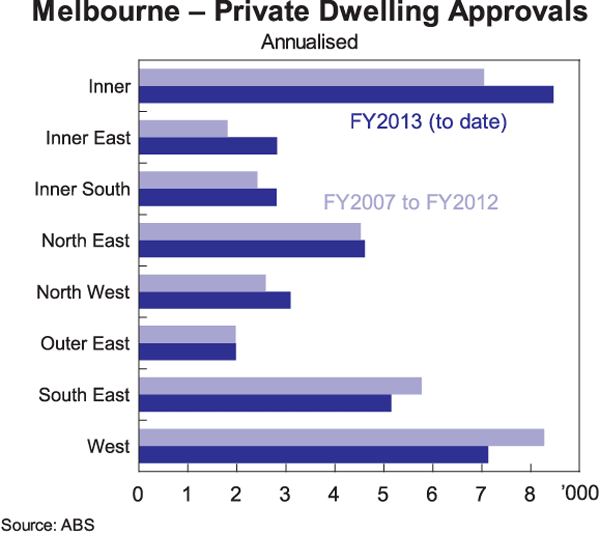
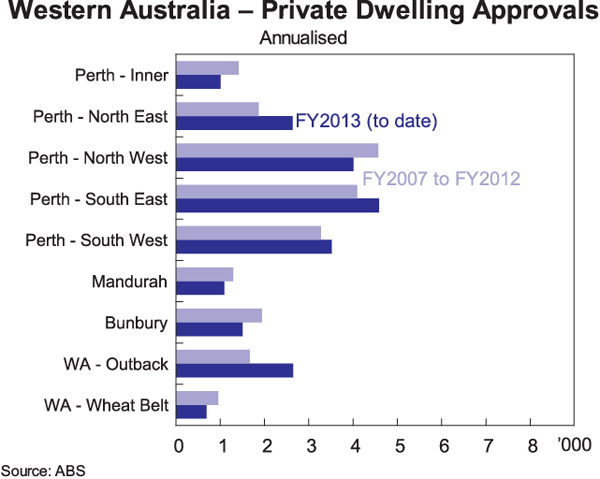
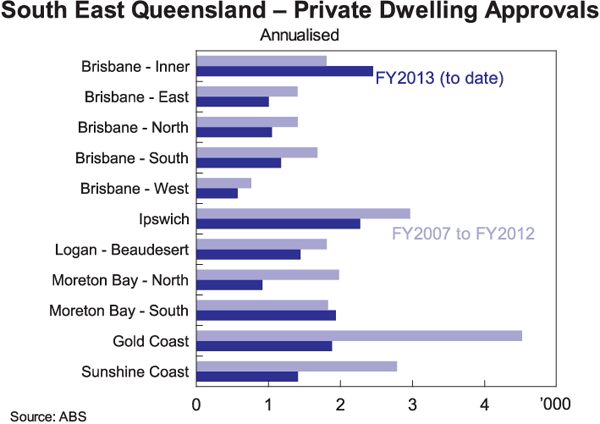
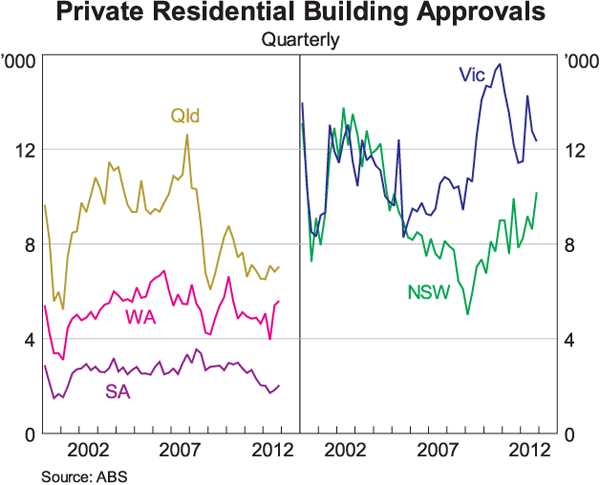
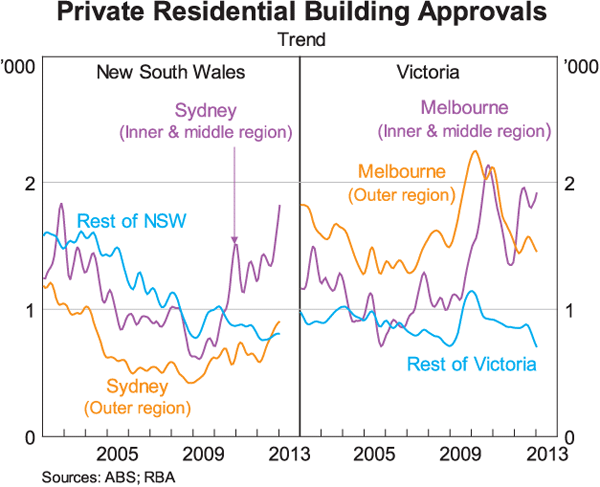
Private residential building approvals, though volatile, have picked up noticeably from their trough in early 2012 (Graph 7). This recovery has been driven by an increase in higher-density approvals, mainly apartments, and was seen in all the larger states. Across almost every major region in Sydney, building approvals since mid 2012 have been higher than they were in the previous five years (Graph 8). In Melbourne approvals have also picked up, though by somewhat less and not across all regions. There has been some pick-up in approvals in Western Australia, although changes in building approvals processes in that state around the middle of last year have made it more difficult to discern the underlying trends. Approvals in Queensland have been subdued, particularly on the Gold Coast and in the south-east of the state more generally; however, even builders in that region have indicated to us that there are tentative signs of some improvement in demand more recently.
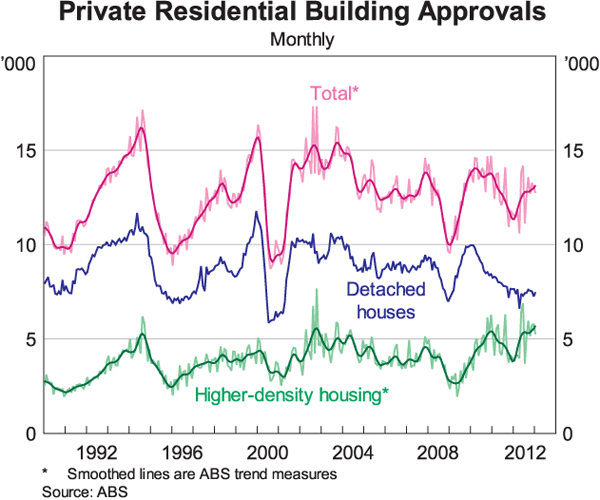
While building approvals for higher-density housing have picked up, as yet there has been little sign of a rise in approvals for detached houses.[4] Indeed, building approvals for detached houses are currently at levels seen during the low points of previous cyclical downturns, while approvals for higher-density housing are at, or even above, previous cyclical peaks. This may be an early indication of a new trend in the housing market. There are a number of reasons why this might be so. First, as the price of land has increased relative to incomes over the past few decades, it makes sense that there is an incentive to economise on the use of land – that is, by living in higher-density housing. Second, it may be that the utility of living in detached houses on the fringes of many cities has decreased with increased congestion and the difficulties of travelling into cities to access job and other opportunities there. The third and closely related possibility is that there may have been a shift in people's preferences towards living closer to the centre of cities and the existing infrastructure there. In any case, if this is a durable, structural change in the market, it will have important implications for builders and developers, particularly those whose business model is focused on detached housing.
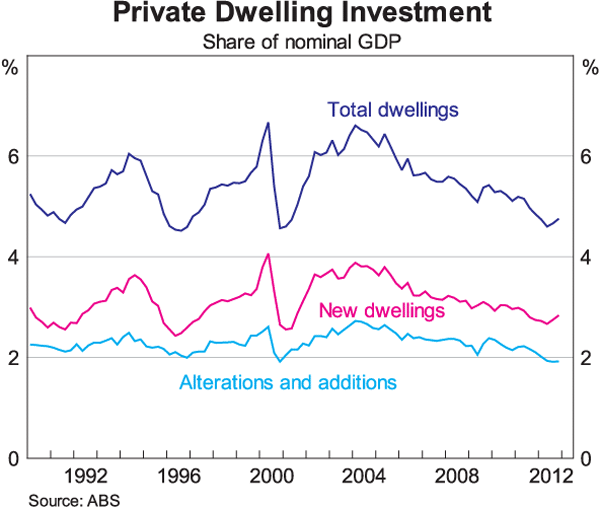
To understand what the strength of the increase in overall residential construction activity is likely to be, it is helpful to take a step back from the most recent few months' worth of data and look at developments over a longer period. The thing that really stands out over the past few years is that, despite the recent pick-up, dwelling investment as a share of the economy remains close to the troughs of over a decade ago (Graph 9). This relatively low level of dwelling construction raises the question of whether demand has been particularly weak or whether supply issues have constrained construction activity.
Factors affecting the supply of land for development will obviously have an important bearing on the cost of new housing, and the speed with which any increase in demand for housing can be accommodated by a rise in construction. I'll come back to a discussion of some of these factors in just a minute. But the key point I want to make is that whatever these supply-side constraints might be, they don't seem to have prevented an increase in construction across much of the country in 2009 and 2010. At that time, a general increase in incentives for first home buyers (for both new and existing dwellings), and the support provided for a time by lower interest rates, led to a sharp run-up in construction in New South Wales, Queensland, Victoria and Western Australia (Graph 10).
Further evidence that the supply of land is not the whole story can be found by looking across different regions within the states. If supply has been the critical constraint, we might have expected construction trends to have been very different across inner and outer parts of cities and the regional areas beyond the cities. For example, development in the outer suburbs tends to be on greenfield land, while development in the inner suburbs tends to be higher-density dwellings on brownfield land. However, for Victoria at least, the pick-up in building activity in 2009 and 2010 was relatively broad based across these different areas (Graph 11). For New South Wales, it does appear that there was a larger and more sustained pick-up in approvals in the inner and middle regions of Sydney, than in outer Sydney and the rest of the state. This may have reflected some limitations in access to land on Sydney's fringes, but nonetheless, there was a relatively rapid pick-up in approvals in 2009.
Even so, this doesn't mean that supply-side issues have not had an important bearing on the housing sector. This point was made in research published in one of the Bank's Bulletin articles last year.[5] Many public reports and the Bank's own liaison with industry participants pointed to a range of supply-side impediments in the Australian housing market. These included the length and complexity of the planning process, the provision and funding of infrastructure, land ownership and geographical constraints, as well as the challenges for development within those city regions that are already well developed. While these factors may impose some constraints on the cost and responsiveness of new supply, it is less clear that they have been restraining the level of new construction more so now than in the past.
One way that is often used to assess the possible outlook for dwelling construction is to compare the number of dwellings that have been built over a period of time with a measure of what is termed ‘underlying demand’. The notion is that if we can assess the prospects for the average number of people living in each household, then we can gauge the strength of ‘underlying demand’ by looking at what's happening to population growth. The problem with this sort of analysis is that the average number of people in each household changes over time in response to a range of things, including the cost of housing.
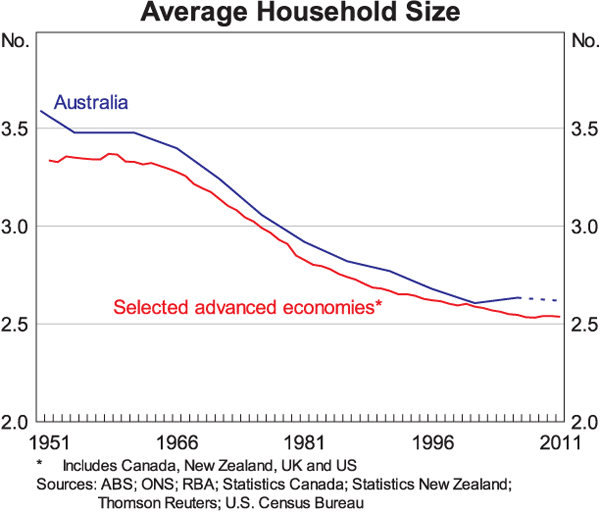
Over the 20th century, demographic and social factors, such as a declining birth rate and rising separation rate, were accommodated by growth in the dwelling stock outpacing that of the population. In other words, there was a downward trend in the number of people in each household (Graph 12). A very similar change was also evident across advanced economies. However, over the past decade or so, these trends have abated and we've seen the average household size stabilise. Indeed, the higher level of house prices and rents (relative to incomes) may have been somewhat of a constraint on household formation and therefore demand for new housing.
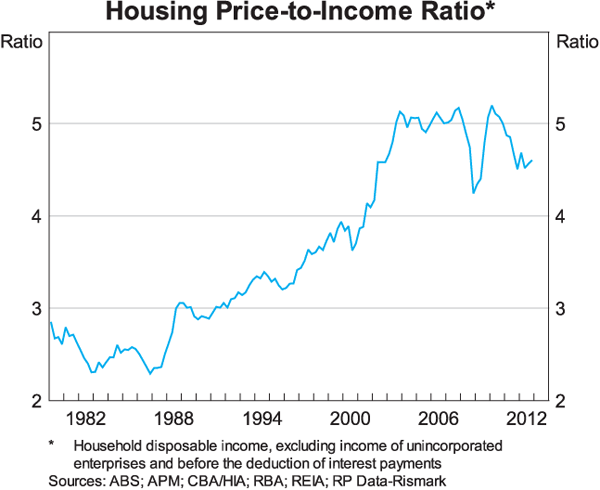
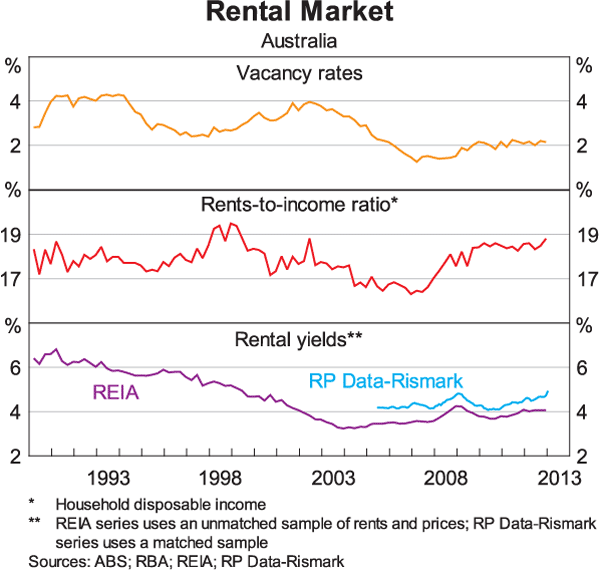
This leads me to what I think is arguably a better way to judge the strength of demand versus supply, which is to look at what prices and rents have been doing. What this suggests is that demand has shown some signs of strengthening relative to supply. In particular, housing prices are no longer declining relative to incomes (Graph 13). Also, the rental market appears to be relatively tight. Vacancy rates have been quite low since 2006 in comparison to the average since the early 1990s, and (with a small delay) this has led to rents rising relative to incomes and remaining relatively stable at around levels seen during previous cyclical peaks (Graph 14). The growth in rents has also meant that conditions for investors have become more favourable, with (gross) rental yields increasing across the capital cities.
Our liaison with the housing industry confirms that demand for new housing has been more positive over recent months. At the same time, however, our contacts note that conditions still remain relatively subdued in most states. In particular, they report that prices for the construction of new dwellings have been held down in response to weak demand, with discounting still reported across the market, including for new developments. Not surprisingly, developers have found a lack of buyer urgency during the earlier period of declining dwelling prices. In addition, they note instances of some earlier sales made off the plan falling through ahead of settlement, apparently due to caution by lenders regarding valuations and strict lending practices for new developments.
Summary
Let me conclude then by drawing some of these threads together. A range of indicators suggest that low interest rates have been supporting the established housing market, and prices have been moving higher in many markets, though they remain below earlier peaks in most. Also, finance is available on reasonable terms for households. With these conditions in place, dwelling construction is beginning to pick up and leading indicators point to further growth in the months ahead. In line with this, our expectation is that there will be a further gradual increase in dwelling construction activity over this year and the next. This moderate growth in dwelling investment will play some role in helping to support a gradual pick-up in economic growth more broadly from what is expected to be a rate a little below trend this year. But it is hard to know exactly how strong the recovery in the housing market might be, so we'll continue to analyse these developments closely over the period ahead.
Endnotes
Standard variable housing loan rates have declined by 135 basis points on average since late 2011, as bank funding costs have risen relative to the cash rate. The Board of the RBA has taken this into account in its monetary policy decisions and as a result, the cash rate is lower than it otherwise would have been. See Lowe P (2012), ‘What is Normal?’, Address to the Australian Business Economists Annual Dinner, 5 December. [1]
For further detail on the adjustment to a higher level of household indebtedness, see Bloxham P, C Kent and M Robson (2010), ‘Asset Prices, Credit Growth, Monetary and Other Policies: An Australian Case Study’, RBA Research Discussion Paper 2010-06. [2]
Discerning the strength of demand from first home buyers has been complicated by recent changes to government grants and tax exemptions. These changes have significantly increased the assistance for purchasing new dwellings relative to established dwellings in some states. [3]
Also, alterations and additions have continued to fall. The low level of dwelling turnover may help to explain some of the weakness in the level of renovation activity. This is because when people are selling their dwelling, or have bought a dwelling, they often undertake work of this sort. [4]
See Hsieh W, D Norman and D Orsmond (2012), ‘Supply-side Issues in the Housing Sector’, RBA Bulletin, September, pp 11–19. [5]