Speech Bank Funding
As you may be aware, last week the Reserve Bank published a Bulletin article that documented recent developments in the structure and costs of the funding of the Australian banking system.[1] The Bank has published an article on this topic annually for a few years now, and also reports regularly on developments in the various components of bank funding in its quarterly Statement on Monetary Policy.
Today, I am going to talk to that article and highlight some of its main findings.
The discussion around bank funding costs can get confused at times. It is often unclear whether a participant in the debate is referring to movements in levels or in spreads, and if the latter, what exactly the spread is relative to. The article and my speech today provide some facts that can serve as a common foundation for discussion.
The main points I want to highlight are:
- The level of the cash rate set by the Reserve Bank is a primary determinant of the level of intermediaries' funding costs (and hence the level of lending rates). However, there are other significant influences on intermediaries' funding costs, such as risk premia and competitive pressures, which are not directly affected by the cash rate.
- Over the past year, funding costs have fallen in absolute terms but have risen relative to the cash rate.
- Deposit pricing, particularly for term deposits, has been the major driver of recent changes in funding costs, reflecting the strong competition for deposits. This has obviously been welcomed by the savers in the population.
- There has been a rise in the spreads on wholesale debt issued by banks reflecting investors' concerns about the global banking industry. While spreads have narrowed recently, they are still higher than they have been over the past couple of years.
Let me start with the first point. The cash rate set by the Reserve Bank Board is the short-term interest rate benchmark that anchors the broader interest rate structure for the domestic financial system. It is the front end of the risk-free yield curve off which other financial assets are generally priced. When the cash rate is adjusted up or down, the whole structure of interest rates in the economy moves up and down, with the effect most direct at shorter maturities.
But the cash rate is clearly not the only determinant of the rate structure in the economy. To use three examples:
- As one moves out along the term structure of the risk-free curve, term premia play an increasing role.
- Risk premia are an important component of borrowing costs for private sector entities, including the banks.
- Competitive pressures play an important role in deposit pricing.
These sorts of determinants of the rate structure are not directly affected by movements in the cash rate.
As I will discuss shortly, over the past few years, competitive pressures in the deposit market and risk premia for the banking sector globally have risen substantially. These have had a material impact on the cost to banks of funding their lending books. While these developments are not the result of movements in the cash rate, the Reserve Bank Board takes these developments into account in its setting of the cash rate to ensure that the structure of interest rates in the economy is consistent with the desired stance of monetary policy. Moreover, the link between movements in the cash rate and lending rates in Australia is much tighter than in many other countries. In the US, for example, movements in the Fed funds rate have a much less direct influence on 30-year fixed-rate mortgages.
Composition of Banks' Funding
The funding structure of the Australian banking system has changed markedly over the past few years (Graph 1). Deposits have become a much larger share of overall funding, rising from a little under 40 per cent in 2007 to 52 per cent currently. The rise in the share of deposit funding has come at the expense of a decline in the share of short-term wholesale funding from around 30 per cent to 20 per cent currently.
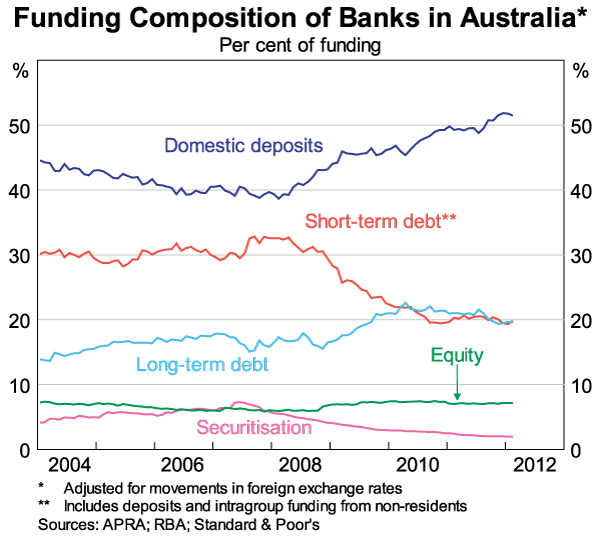
The structure of funding shown in Graph 1 is for the banking system as a whole, not that of any particular financial institution. Similarly, the analysis presented is for the cost of funding this aggregate structure and will certainly differ institution by institution. For example, the regional banks generally fund a larger share of their books via deposits, and have significantly decreased their use of securitisation. Credit union and building societies continue to raise the vast majority of their funds via deposits.
The major change in the funding structure of the larger banks has been the switch from short-term wholesale funding to deposits, although they have also recently increased their use of long-term secured issuance, particularly in the form of covered bonds. While the covered bond issuance has had little effect on the composition of banks' funding at this stage, given the large stock of existing funding, it has allowed the major banks to achieve funding at longer tenors than has been the case previously. Covered bonds have generally been issued for terms of 5 to 10 years, whereas unsecured bank bonds are generally issued with maturities of up to 5 years.
Within banks' deposit funding, there has been a marked shift towards term deposits, which pay higher interest rates than other forms of deposits. Indeed, term deposits have accounted for most of the growth in bank deposits since the onset of the financial crisis. They now account for about 44 per cent of the major banks' deposits, up from 30 per cent in the middle of 2007 (Graph 2).
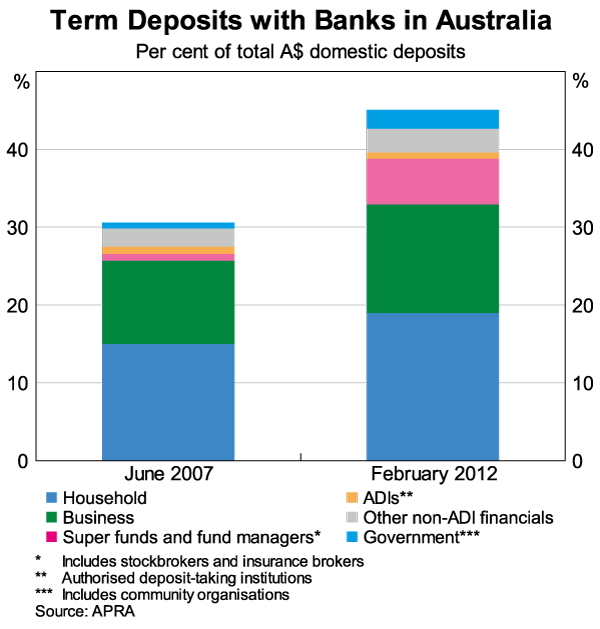
The increase in the share of deposits, particularly term deposits, reflects a number of interrelated factors:
- First, banks have offered relatively attractive rates to depositors.
- Second, strong business profits have resulted in larger corporate cash holdings, which have been increasingly invested in deposits rather than other financial instruments, particularly short-term bank paper.
- Third, households have significantly increased their term deposits placed directly with banks, instead of investing in other financial assets. There has also been a rise in deposits placed via superannuation and managed funds.
Some part of the second and third of these factors reflects as much a change in name as a fundamental shift in funding structure. Instead of holding an exposure to the banking system that is called short-term wholesale debt, some corporates and superannuation funds hold the very same exposure in the form of a term deposit (of comparable maturity). This reflects pressures from regulators, ratings agencies and the market for financial institutions to be more deposit funded, because deposits are assessed to be more stable, even though, in this instance, the behavioural response of the investor is probably not materially different.
For banks, term deposits have the advantage of generally being a relatively stable funding source. The average contractual maturity of term deposits is fairly short, at somewhere between four and seven months. But these term deposits are typically rolled over a number of times so that the effective maturity is more around a few years.
From the banks' point of view, the rates on new term deposits can also be adjusted quickly to influence the growth in this source of funding. However, because term deposits have a relatively short contractual maturity, changes in the pricing flows through the whole term deposit book quickly. Hence movements in these rates can be one of the biggest short-run influences on changes in overall funding structure.
While most of the competition among banks has been for term deposits, banks have also offered more attractive transaction and savings accounts. They are paying higher interest rates on these accounts and are offering greater functionality. The increase in the value of funds invested in these deposits has largely been placed in online saver accounts and accounts with introductory bonuses and/or bonuses for regular deposits. Banks have reported little growth in the value of low-interest transaction-style deposit accounts.
At-call online saver accounts are generally assessed to have more rapid run-off rates under the Basel III liquidity standards, so they will not be particularly attractive from the banks' point of view once those liquidity standards take effect from the beginning of 2015. That does not seem to have affected the pricing of these products yet, but it will be interesting to see how that evolves both in terms of pricing and product design as we approach that date.
Cost of Funding
Having discussed the structure of funding, I will now turn to the cost of that funding.
The Reserve Bank uses a wide range of sources to derive our estimates of banks' funding costs. We use data reported by financial institutions to APRA and banks' regular profit statements to the market to track the composition of funding. We monitor the prices offered on various forms of deposit accounts, and maintain a comprehensive database of wholesale funding, which is updated issue by issue. We supplement all of this with extensive consultations with financial institutions, big and small.
The analysis presented contains our best estimates. But there remains a degree of imprecision around them. Moreover, as I mentioned earlier, our estimates are for the system as a whole, not for any particular financial institution.
That said, in summary, our estimate is that the absolute level of banks' funding costs fell from mid 2011 to February 2012, but by less than the reduction in the cash rate. There were particularly pronounced increases in the cost of term deposits and long-term wholesale debt relative to the cash rate as financial market conditions deteriorated in late 2011.
Deposits
Competition for deposits, which had moderated somewhat in early 2011, intensified again in late 2011. Consequently, our estimate is that while the cash rate has fallen by 50 basis points since mid 2011, the major banks' average cost of deposits has declined by about 25 basis points. In other words, while the average interest rate on deposits has indeed fallen, it has risen relative to the cash rate.
The average spread above market rates on the major banks' advertised term deposit ‘specials’ has increased by about 35 basis points over the past year (Graph 3). Furthermore, an increase in the share of deposits written at rates higher than the rates advertised by banks has meant that the average rate on outstanding term deposits has not fallen as quickly as benchmark rates, as term deposits have been rolled over. That is, banks have been increasingly paying customers more than the rate advertised in the window if the customer asks for it, reflecting competitive pressures. Moreover, there has been some shortening in the average maturity of term deposits recently given the inverted yield curve, which has meant that changes in pricing have passed through more quickly.
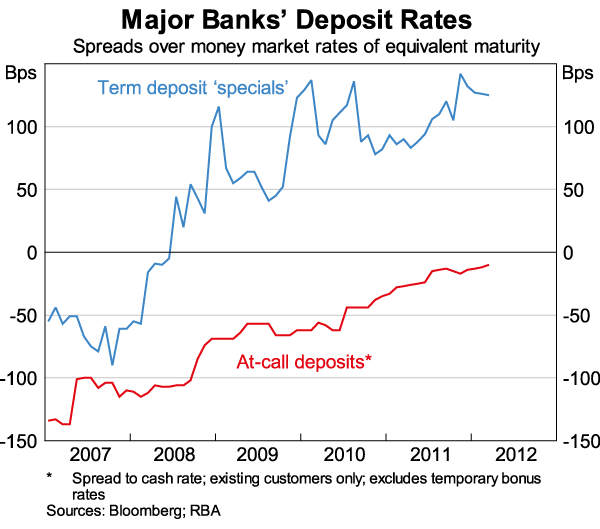
The average advertised rate on at-call savings deposits rose by around 20 basis points relative to the cash rate over 2011. Again, in absolute terms, the interest rate declined. Taking into account an increase in the proportion of savings deposits earning bonus rates, the average rate on these deposits is estimated to have increased by between 35 and 50 basis points relative to the cash rate.
Interest rates on transaction accounts have not fallen in line with the cash rate as many only pay very low nominal interest rates. Hence, as the cash rate falls, there is no scope to lower the interest rates on these accounts.
Wholesale Debt
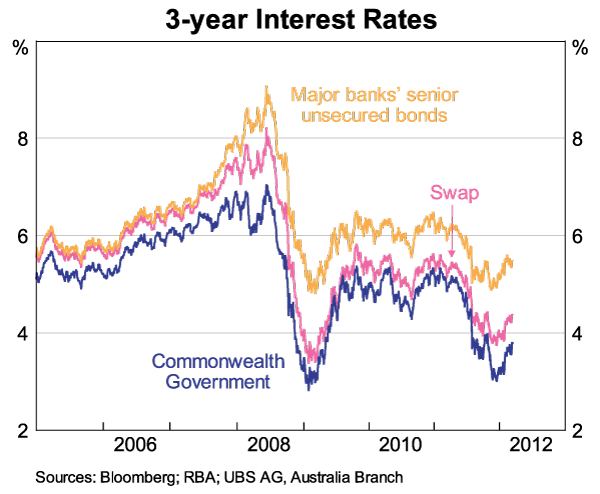
The absolute cost of issuing new unsecured wholesale debt fell during 2011 (Graph 4). Relative to risk-free benchmarks, however, the cost of issuing wholesale debt has increased since mid 2011. The increase in spreads on banks' wholesale funding reflects global investors demanding more compensation for taking on bank credit risk, although the rise for Australian banks has been less marked than it has been for other banks globally. This widening in spreads was at its peak at the beginning of the year but over recent weeks these spreads have narrowed noticeably.
There has also been an increase in the costs associated with hedging the foreign exchange risk on new foreign-currency denominated bonds. This rise in the basis swap reflected the dearth of Kangaroo issuance earlier in the year at a time when the banks were raising foreign-currency debt. The pick-up in Kangaroo issuance in recent weeks has alleviated some of that pressure.
Spreads on banks' new wholesale debt have come down somewhat following the ECB's 3-year longer-term refinancing operations. However, they still remain higher than in mid 2011 (Graph 5).
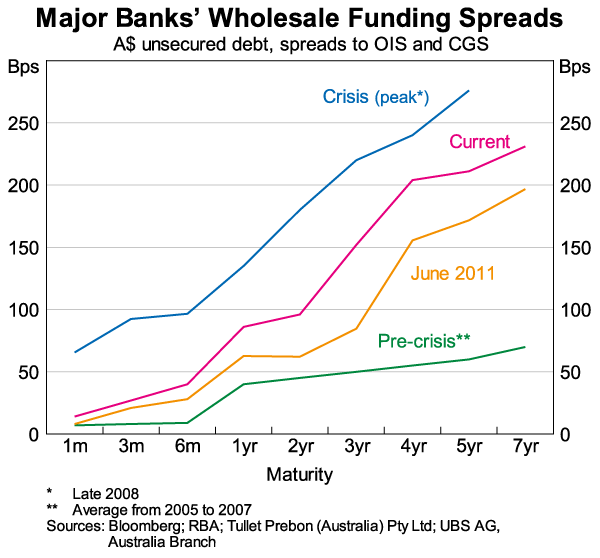
While the relative cost of new long-term wholesale funds is currently higher than that of maturing funds, this has had only a moderate effect on the major banks' average bond funding costs relative to the cash rate to date. This reflects the fact that it takes at least 3 to 4 years for the major banks' existing stock of bond funding to be rolled over. Since spreads began to rise sharply in August 2011, the major banks' issuance of new bonds amounts to about an eighth of their outstanding bonds. As a result, the cost of the major banks' outstanding long-term wholesale debt is likely to have risen by about 25 basis points relative to the cash rate over the past year.
The increase is smaller if fixed-rate wholesale debt is assumed to be swapped back into variable-rate obligations. The extent of the rise in relative costs for individual banks varies according to each bank's use of interest rate derivatives.
Short-term wholesale debt is mainly priced off 1- and 3-month bank bill rates. While these rates generally fell (in terms of level) over the latter half of 2011 due to the sharp fall in the expected cash rate over this period, there was an increase in the cost of short-term debt relative to the expected cash rate as measured by the bank bill to OIS spread over the same period (Graph 6).
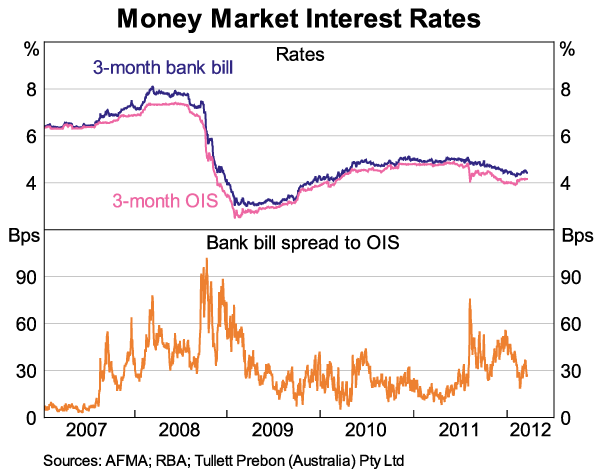
The increase in this spread also contributed to a higher average cost of long-term wholesale debt, relative to the cash rate, given that most of this debt is benchmarked to short-term bank bill swap rates. These pricing conventions ensure that changes in the cash rate, and expectations about its future level, have a direct effect on both short- and long-term wholesale funding costs. Since the start of the year, the spread between bank bills and OIS has narrowed noticeably. The reduction in the spread reflects, in part, the reduction in short-term issuance because of a higher level of term wholesale issuance.
Short-term issuance is somewhat of a buffer for the major banks. When global markets are dislocated, they tend to issue more onshore short-term debt. This tends to drive up the cost, which may also be rising at the same time because of the tensions which are causing the dislocation globally. Conversely, when conditions improve and term wholesale issuance picks up, short-term issuance declines, reducing the spread with further downward pressure from the improved market sentiment.
If the lower spread between bank bills and OIS is maintained, this should alleviate some of the upwards pressure, relative to the cash rate, on the cost of funding banks' aggregate loan books.
Overall Cost of Funding
Taking the costs of individual funding sources noted above, and weighting them by their share of total bank funding, provides an estimate of the overall change in the cost of funding banks' aggregate loan books.
Compared to mid 2007, the average cost of the major banks' funding is estimated to be about 120–130 basis points higher relative to the cash rate (Graph 7). Most of the increase occurred during 2008 and early 2009 when the financial crisis was at its most intense. Since the middle of 2011, however, there has been a further increase in banks' funding costs relative to the cash rate of the order of 20–25 basis points. The graph shows that a fairly large part of this increase comes from the pricing of deposits.
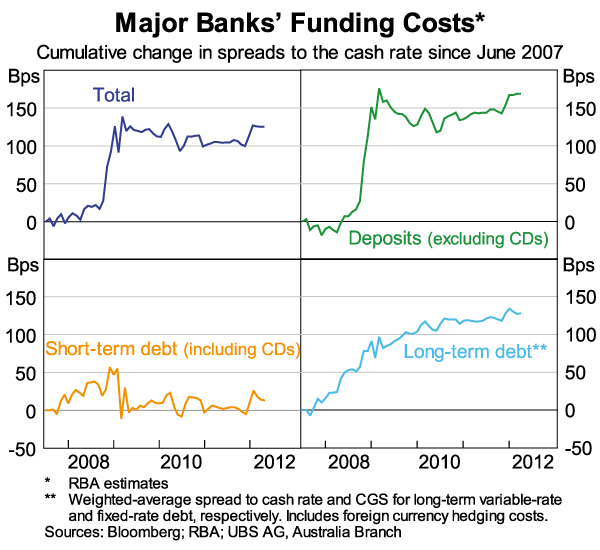
The increase in funding costs, relative to the cash rate, differs across institutions given differences in their funding compositions and the pricing of different liabilities. The available evidence suggests, for example, that the overall increase in the regional banks' funding costs since the onset of the financial crisis has been larger than that experienced, on average, by the major banks. This mainly reflects the larger increase in the cost of the regional banks' deposits and a more significant shift in their funding mix.
Banks' Lending Rates
I have primarily focused on funding costs today, but in closing I will briefly touch on developments in lending rates. The Bulletin article goes into this in more detail.
The cost of funding is the most important factor that influences the lending rates banks set. But there are a number of other factors that affect pricing including: the credit risk associated with the various types of loans, the liquidity risk involved in funding long-term assets with short-term liabilities, and choices about growth strategies in different markets.
For close to a decade prior to the global financial crisis, banks' overall cost of funds followed the cash rate closely, as risk premia in markets were low and stable. Accordingly, interest rates on business and housing variable-rate loans tended to adjust in line with the cash rate.
Nevertheless, over this period there was a gradual decline in the spread between average interest rates paid on loans and the cash rate. For example, the spread between the average mortgage rate paid and the cash rate declined from 275 basis points in 1996 to around 125 basis points in 2007 (Graph 8).
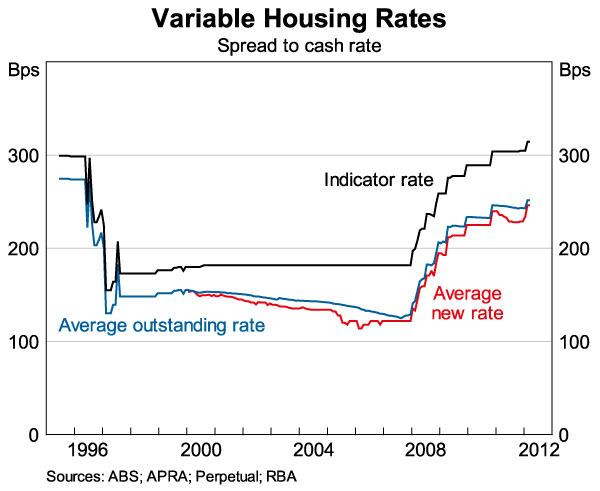
Since the onset of the financial crisis, banks have increased the spread between lending rates and the cash rate for all loan types. The increases have varied across the different types of loans, partly reflecting differences in the reassessment of the riskiness of those loans and expectations regarding loss rates.
But the primary factor driving the increase in the spread between lending rates and the cash rate has been the increase in the relative cost of funding that I have described above. Financial institutions have increased their lending rates in the face of the increase in costs to maintain their net interest margins within the range observed in recent years.[2] In turn, this has been with the aim of maintaining profitability.
Without seeking to answer the question as to whether or not these movements in lending rates have been ‘appropriate’, the aim of my speech today, and the Bank's recently published analysis, has been to provide some facts to help in that discussion.
Endnotes
I thank Chris Stewart and Cameron Deans for their help. [*]
Deans C and Stewart C (2012), ‘Banks' Funding Costs and Lending Rates’, RBA Bulletin, March pp 37−43. [1]
As noted in Deans and Stewart (2012), there are a number of other factors which affect the reported net interest margin in addition to movements in lending rates and funding costs. And similarly, there are additional factors which affect the translation of net interest margins to profitability. [2]
