Speech Recent Economic Developments

Philip Lowe
Assistant Governor (Economic)
Keynote Speech to Colonial First State Investment Forum
Sydney –
- Audio 18.23MB
I would like to thank Colonial First State for the invitation to speak at today's Investment Forum. It is a pleasure to be here this morning.
Last Friday, the Reserve Bank released its latest quarterly Statement on Monetary Policy. What I would like to do this morning is to pick up on three of the interrelated themes of that Statement. The first is the nature of the recovery in the global economy. The second is the outlook for the Australian economy and the expected increase in Australia's terms of trade. And the third is recent developments in inflation, particularly the divergent trends in the prices of tradable and non-tradable goods and services.
The Global Economy
The week since the Statement was finalised has been a turbulent one on global financial markets due to concerns about the fiscal situation in Europe. When these concerns first arose, the focus was on public finances in Greece and there were limited flow-on effects outside of Europe. While the problems continue to be focused on Europe, more recently there were signs of a rise in risk aversion globally. This saw equity markets fall and strains re-emerge in many money markets. There were also safe-haven capital flows into the US dollar and the yen, as well as into government bonds in the United States and Germany. Left unchecked, these events had the potential to lead to a widespread retreat from risk-taking by investors, damaging the recovery in the world economy.
In the face of this escalation in market instability, recent measures by the European Union and its member states, the IMF, and the ECB and other central banks have provided investors with some confidence that the underlying issues are being addressed, and that support mechanisms are in place. Restoring confidence is clearly a necessary step in what will be a very difficult road ahead for a number of countries. These events again remind us of the very hard choices that countries can be forced to make if prudent policies are not implemented in the good times. In a number of European countries, governments are being forced to cut back at the same time that private demand is declining. The obvious result is a very weak economy. In these countries, the capacity to use countercyclical fiscal policy to support aggregate demand has been diminished because of the lack of fiscal discipline in more tranquil times.
While financial markets have been turbulent, the recent data on economic activity suggest that the global economy is continuing to recover from the sharp downturn in late 2008 and early 2009. In its latest update, the IMF is forecasting that the world economy will expand by 4¼ per cent in 2010 (Graph 1). This is a much better outcome than was expected 12 months ago, when the IMF was forecasting growth of just 2 per cent. At the time, the outcomes that we have seen recently were viewed as a possible ‘upside risk’, although most observers thought the likelihood of this risk materialising was quite low. The main focus at the time, as it has been over the past week, was on the possible downside risks which were seen to be both very real and very serious.
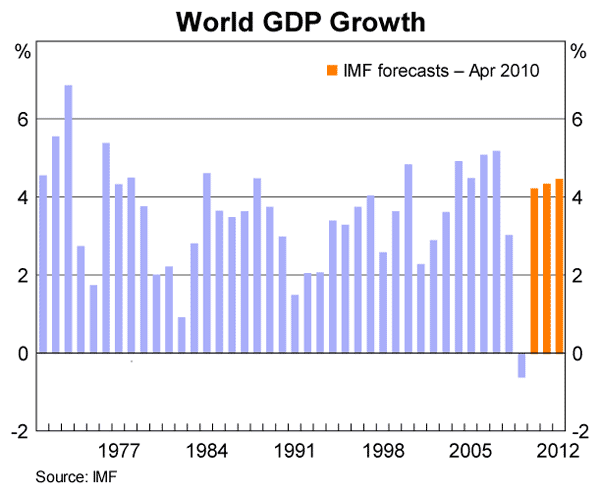
We now know that the various policy measures that were taken did help arrest the collapse of confidence following the failure of Lehman Brothers. These measures on the fiscal, monetary and financial fronts provided reassurance that policymakers would not stand on the sidelines. In doing so, they helped reduce the extreme risk aversion that was evident at the time. They also had the more traditional effect of directly supporting spending in the economy when many people were reluctant to spend.
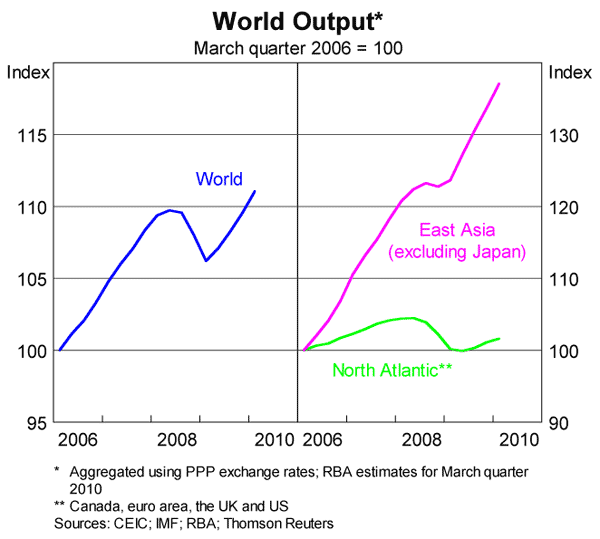
While the global economy is recovering, the recovery has been quite uneven to date. In Asia, it has been V-shaped, but in the countries of the North Atlantic, particularly those in Europe, it has been subdued (Graph 2). Output remains below the level it reached in 2008 and, in many countries, it will still be some time before that earlier peak is reached again.
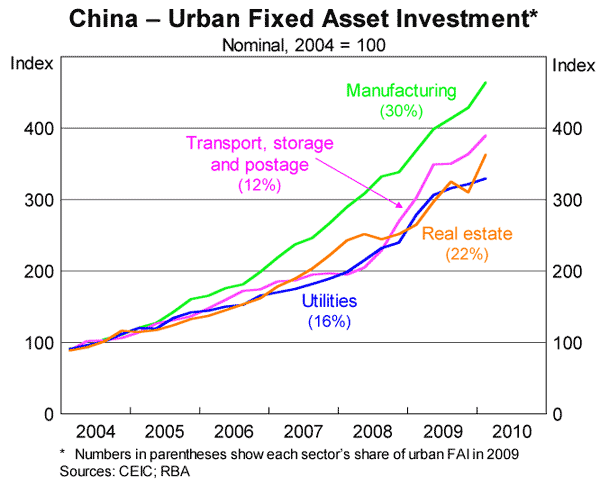
China continues to be at the forefront of the recovery. Growth over the first few months of 2010 was strong, and recent indicators suggest that this momentum has continued. Investment in the manufacturing sector and in infrastructure has, if anything, surprised on the upside (Graph 3). The main issue continues to be the potential for the Chinese economy to run too hot, putting upward pressures on the prices of goods and services and on housing prices. Recently, the Chinese authorities have been responding to this risk, especially through steps to rein in the property market.
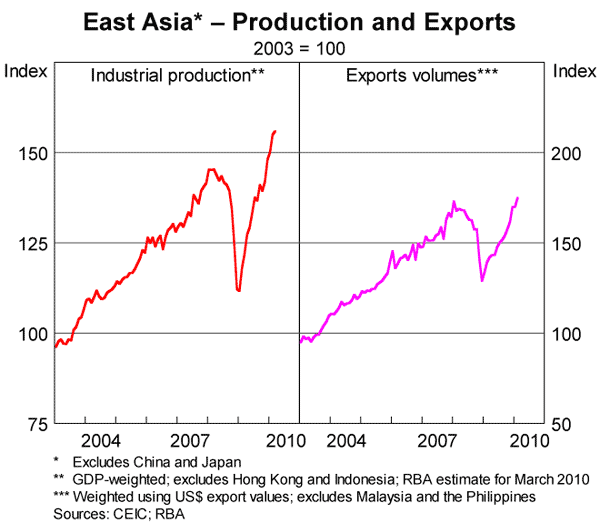
The picture is broadly similar elsewhere in Asia, where there has been a sharp recovery in industrial production and exports (Graph 4). Policy settings in the region remain stimulatory, particularly when viewed against the V-shaped recovery. Over the past month or so, a number of countries – including India, Malaysia and Singapore – have taken steps to withdraw some of this stimulus. These are welcome developments given that one risk that has been getting some attention is the possibility that stimulatory policy settings remain in place for too long causing inflation pressures to build in Asia. If this risk were to materialise, a more pronounced tightening of policy, and perhaps a sharper slowdown in growth, would be likely to occur over the medium term.
In the economies of the North Atlantic the challenges are very different.
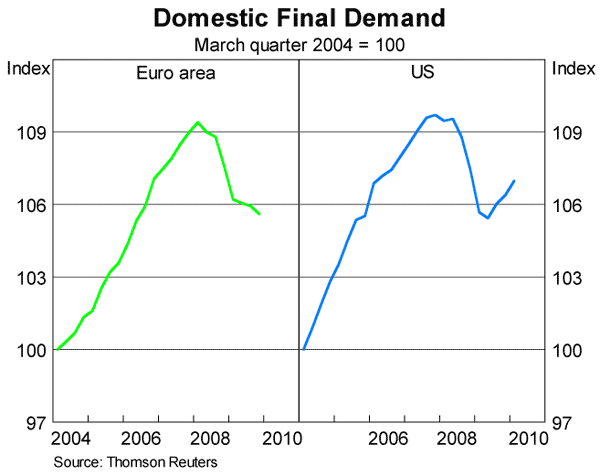
In many countries, financial systems have not returned to full health, consumer confidence is still low, housing markets are yet to show sustainable signs of recovery and governments face very significant medium-term fiscal challenges. Conditions in Europe, in particular, remain weak, with domestic final demand still not growing (Graph 5). In contrast, in the United States, domestic demand is now growing again, and recent economic data have generally been a bit better than earlier expected. Both consumption and spending on plant and equipment by businesses have increased, surveys suggest that business conditions have improved, and employment is growing again. However, as in Europe, the recovery in the United States remains dependent on stimulatory settings of both fiscal and monetary policy, and fiscal issues cloud the medium-term outlook.
This international environment is clearly a mixed one. Australia's major export partners are growing strongly, and there are reasonable prospects that they will continue to do so. This is a positive for Australia. There are, however, downside risks. Despite the recent announcements having stabilised confidence in Europe, concerns about public finances could build again. If they did, it would weigh on growth prospects for the countries directly concerned, and it could also weigh on prospects in Asia, particularly if it were associated with a marked increase in risk aversion globally. At the same time, one cannot rule out further positive growth surprises for the global economy, particularly if confidence in Europe holds up and policy remains stimulatory in Asia. As usual, the Reserve Bank will be watching carefully over the weeks and months ahead to assess how the balance of these risks is evolving.
The Australian Economy and the Terms of Trade
I would now like to turn to the Australian economy, which continues to improve from the relatively mild downturn a year or so ago.
As is the case for the world economy, the recovery in Australia has been stronger than expected. In a very real sense, our experience has been much closer to that of many of our major trading partners in Asia, than it has been to that of the other advanced economies of the world. As a result, we are operating closer to full capacity than other developed countries, and the challenges we face are quite different to the ones that they face.
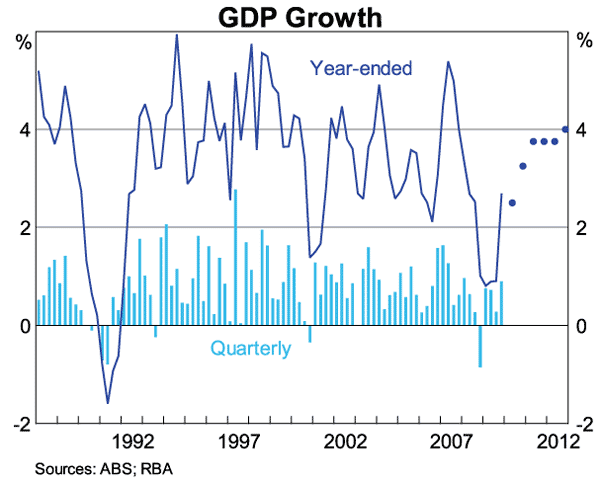
In the Statement last week, the Bank published its updated forecasts for the next few years. The central forecast is for the Australian economy to expand by around 3¼ per cent over 2010, before growth picks up to be in the 3¾–4 per cent range over the next couple of years (Graph 6). The forecast for 2010 is unchanged from that of three months ago, while the forecasts for the following years have been revised up a little to above-average growth, partly reflecting above-average growth in both the labour force and the capital stock.
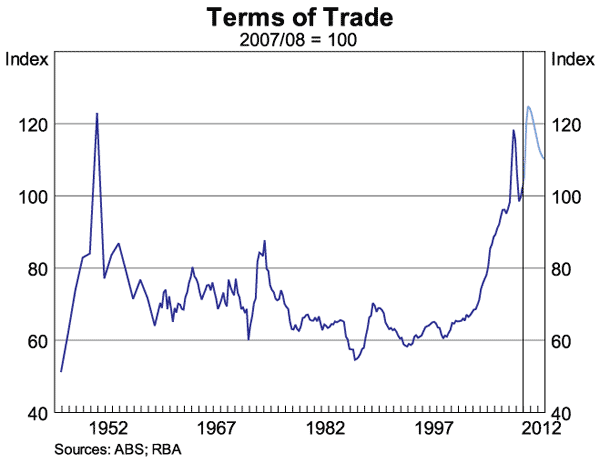
An important factor underpinning this positive outlook is the lift in Australia's terms of trade, which are expected to regain their peak of a couple of years ago. This would bring them back to around the very high level they reached in the early 1950s when wool prices spiked at the time of the Korean War (Graph 7). Over the past six months, the prices of most commodities have increased, although it is the prices of iron ore and coking coal that have risen particularly strongly. These commodities share the common feature that they are inputs into the production of steel.
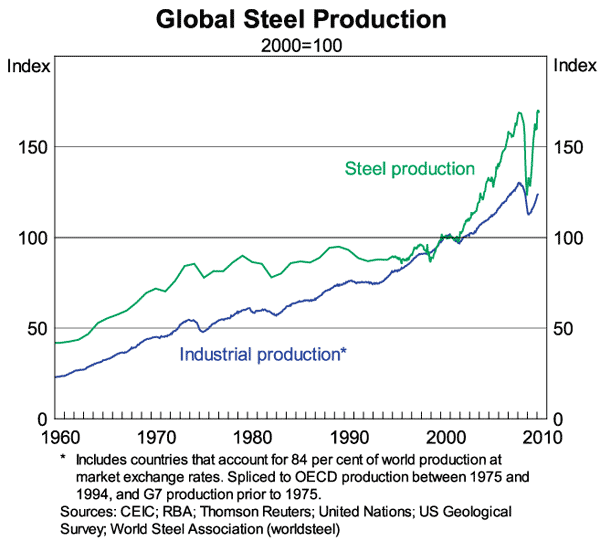
Looking back in time, global steel production grew strongly in the 1960s and early 1970s when Japan was industrialising, but then was relatively flat for about a quarter of a century (Graph 8). Over the past decade, growth in global steel production has again been very strong, running well ahead of that in global industrial production. This strength largely reflects the very strong growth in manufacturing and infrastructure investment in China, both of which have been quite intensive in their use of steel.
If the industrialisation experience of the United States and Japan is any guide, strong growth in Chinese demand for steel could be expected for quite a few years yet. And over a slightly longer horizon, Indian demand for steel – which currently is relatively low – could also be expected to grow strongly. Of course, over time, a significant global supply response is likely to lead to less pressure on raw materials prices than is currently the case. Notwithstanding this, Australia does look to be well placed to benefit from strong global demand for the main inputs into the production of steel. The outlook for the LNG sector also remains very positive.
This boost in the terms of trade this year will add significantly to national income. In putting together the Reserve Bank's forecasts it has been assumed that more of this boost to income is saved than was the case in the earlier boom in the terms of trade. This reflects two factors. The first is the different position of the Federal budget and the second is the more cautious approach to spending currently being displayed by the household sector. If this lift in saving does not occur, then demand in the economy could well be stronger than forecast, and this would put additional pressure on capacity.
At the moment though, with the economy still emerging from the earlier downturn, there is still some spare capacity and conditions clearly differ across sectors. Retail spending remains subdued following the large increase last year, and commercial construction is weak outside of the boost from public-sector infrastructure spending. In contrast, dwelling construction continues to pick up, the period of business-sector deleveraging looks like it has come to an end, and investment in the resources sector is at very high levels.
The Bank will continue to monitor these differences carefully. Overall though, the central scenario for Australia remains a positive one. Our major trading partners are growing solidly, commodity prices are high and domestic income is likely to grow strongly over the year ahead. If this central scenario were to eventuate, a major challenge will be to expand the supply side of the economy so that demand can grow solidly without adding to inflation. At the same time, we need to be aware that circumstances can change quickly. If they do, Australia is in the fortunate position, as are a number of countries in Asia, of having the policy flexibility to be able to respond.
Inflation
The third issue I would like to talk about is recent trends in inflation in Australia.
The March quarter CPI confirmed that inflation pressures have moderated significantly (Graph 9). In mid 2008, underlying inflation was running at a little above 4½ per cent, a level that was clearly too high, with the economy pushing up against capacity constraints. In contrast, over the past 12 months, the various measures of underlying inflation all suggest that it is now running at around 3 per cent – a marked reduction from rates two years ago.
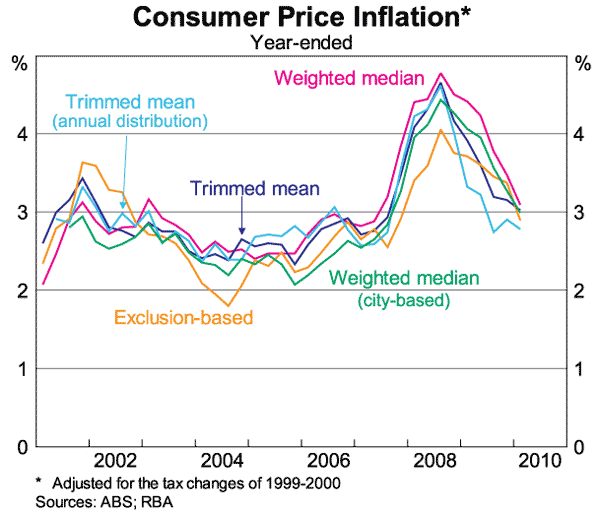
This decline reflects two broad developments – the earlier slowdown in demand growth and the appreciation of the exchange rate. The downturn in the economy in late 2008, together with the elevated degree of uncertainty at the time, led to a considerable slowing in wage growth in the private sector. Weak demand growth also put downward pressure on firms' margins, and the appreciation of the exchange rate has recently led to price reductions for many imported goods.
Given the inevitable lags, these factors are likely to see underlying inflation in year-ended terms come down a bit more in the near term. Notwithstanding this, the outcome for the March quarter was slightly higher than we, and most market observers, had been expecting. One clearly needs to be cautious in interpreting a single figure. However, this outcome is consistent with the idea that the disinflationary forces in the economy are not quite as strong as previously expected, largely because the economy has performed better than previously expected.
One other aspect of the recent data on inflation worth noting is the divergent trends in the prices of tradable and non-tradable items. Over long periods of time, the prices of non-tradables – which are mostly services – have tended to rise more quickly than the prices of tradables – which are mostly goods. For example, over the past decade the average annual increase in the prices of non-tradables was 3¾ per cent, while the average increase in the prices of tradables (excluding food and fuel) was much lower, at just ¾ per cent. The primary reason for this difference is the faster rate of productivity growth in the production of goods than in services.
Looking at the recent inflation data, we can see that this difference is currently quite large (Graph 10). One very concrete example of this can be seen in divergent movement in the price of health services – a non-tradable – which has increased by 6 per cent over the past year, and the price of clothing – a tradable – which has fallen by 3 per cent over the same period.
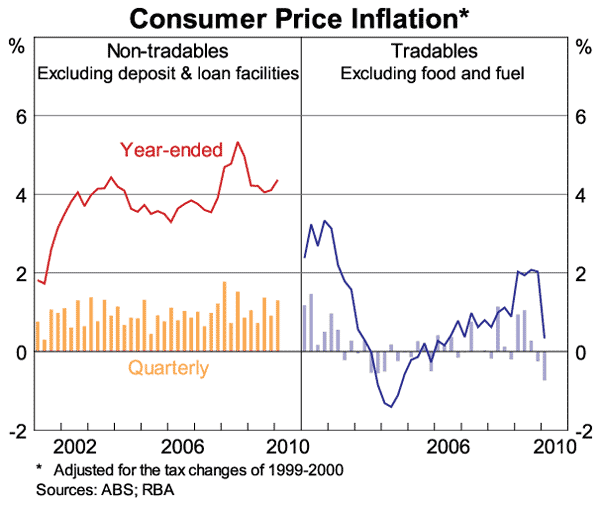
The recent decline in the prices of tradables reflects the appreciation of the exchange rate that I noted earlier, as well as tariff cuts at the beginning of 2010, and discounting by retailers in the face of subdued growth in retail sales over the past year. Looking ahead, these factors are likely to continue to contribute to low rates of tradables inflation for some time yet.
For non-tradables, the picture is somewhat different, with year-ended rates of inflation picking up recently. This is partly explained by a number of specific factors that have affected the prices of individual services. But, more generally, it would appear that demand for a range of services has been strong relative to the economy's current capacity to supply them. This pressure on capacity is, in turn, putting pressure on prices.
One obvious example here is housing, with the rate of population growth recently exceeding the rate of increase in the number of dwellings for the first time in many decades. One result of this is that rental vacancy rates are generally low and rents are rising solidly, although recent rates of increase are below the pace of a year ago.
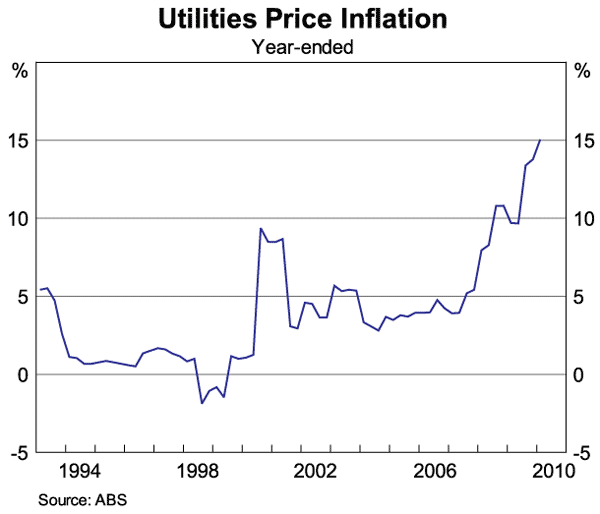
Another example is utilities, where prices have been rising very strongly recently (Graph 11). Over the past year, the price of electricity is up by 18 per cent, the price of gas is up by 9 per cent and the price of water is up by 14 per cent. These large increases follow an extended period in the 1990s when utilities prices increased by considerably less than the general rate of inflation, and the level of investment in infrastructure was relatively low. Recently, there has been strong growth in demand for electricity, especially in the peak periods, and this is requiring further expansion of infrastructure to expand supply capability and ensure the reliability of the network in these peak periods. To fund this supply expansion, as well as in response to higher raw material costs, the industry regulators have approved large price increases. Looking ahead, above-average price increases are likely to continue for some years, although below the current rate of increase.
Overall, the Reserve Bank's central forecast is that underlying inflation will trough at around 2¾ per cent later this year, before gradually picking up over the next couple of years. The inflation rate as measured by the CPI is expected to be higher than the underlying rate over 2010, partly reflecting the recent increase in the excise on tobacco which is likely to add around 0.4 percentage points to CPI inflation.
Over the past couple of decades, low and stable inflation has clearly been one of the critical elements in Australia's good economic performance. We need to make sure this continues. Sustaining low rates of inflation requires inflation expectations to be well anchored and growth in demand not to outpace the expansion of supply. With aggregate demand likely to be supported by strong commodity prices over the next few years, there needs to be a strong emphasis on improving the supply side of the economy. Here, well-targeted investment and improvements to productivity are obviously the keys.
While on the topic of inflation, I would like to touch on one final issue. You may be aware that the Australian Bureau of Statistics (ABS) is currently undertaking one of its regular reviews of the CPI. In its submission to the review, the Reserve Bank has argued that there is a case to move to a monthly CPI. While the current CPI provides a comprehensive and reliable measure of consumer price inflation in Australia, more frequent data on prices would be helpful in assessing trends in inflation. This is particularly so around turning points and when unusual factors are affecting the aggregate CPI. The Bank welcomes the open and transparent manner in which the current review is being undertaken and looks forward to its completion.
Conclusion
We continue to live in turbulent times. Recently, concerns about the quality of public-sector balance sheets in some countries have overtaken concerns about the quality of private-sector balance sheets. While recent announcements have alleviated these concerns somewhat, the path ahead is likely to be a difficult one for many of the advanced economies. In Asia, the outlook is more promising, although challenges also lie ahead, particularly in judging the appropriate timing to move to less expansionary policy.
For Australia, while the international environment continues to be a challenging one, the central scenario for the domestic economy remains quite positive. Importantly, Australia has the flexibility to respond to changing circumstances and is well placed to benefit from the strong growth in Asia.
Thank you for your time this morning.