Speech Forecasting in an Uncertain World

Philip Lowe
Assistant Governor (Economic)
Address to Australian Business Economists Annual Forecasting Conference Dinner
Sydney –
- Audio 24.27MB
Thank you for the invitation to join the Australian Business Economists (ABE) this evening. It is both an honour and pleasure to be able to speak at the ABE's annual dinner.
This evening, I would like to talk about an issue that I know is close to the hearts of many of you. It is also one that you have been discussing all afternoon. And that is economic forecasting.
As economists, forecasting is something we are required to do on a regular basis. As a policy adviser, as a business person or as an investor, one has no choice but to be forward looking. So for many of us, some form of forecasting – with all its difficulties and pitfalls – is the bread and butter of our professional lives.
Tonight, I would like to talk about three aspects of forecasting from the perspective of a central banker. The first is the general role that forecasts play in the setting of monetary policy. The second is the approach to forecasting that we use at the Reserve Bank.[1] And the third is some of the issues that we have been grappling with as we have put our current forecasts together.
Monetary Policy and Forecasting
Australia's monetary policy framework is best described as a medium-term inflation target. Over time, we want to ensure that inflation averages somewhere between 2 and 3 per cent. And this is exactly what has happened since this framework was put in place. Since 1993, CPI inflation, excluding the effects of the introduction of the GST, has averaged exactly 2.5 per cent.[2] This is in contrast to average inflation of 8.7 per cent over the previous two decades (Graph 1).
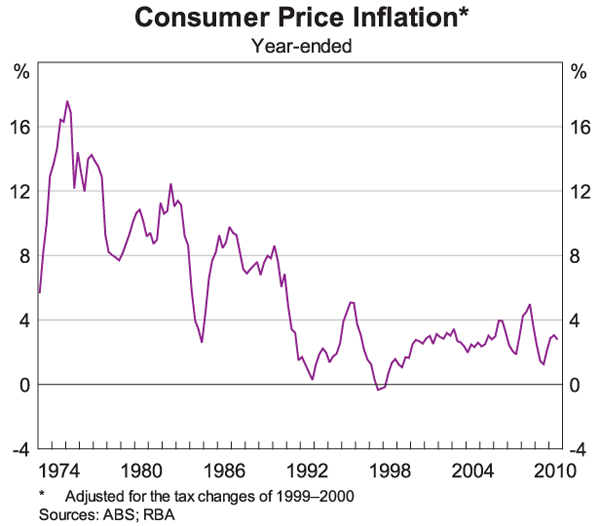
An important feature of inflation-targeting frameworks is that they are forward looking. We know that it takes time for changes in monetary policy to have their full effect on the economy, just as it takes time for changes in other variables – like the terms of trade or government spending – to have their full effects. This means that if we are to achieve our medium-term objective, and to avoid unnecessary swings in the economy, we need to be thinking about what might happen in the future.
When inflation-targeting regimes were first established around the world, many observers characterised the appropriate policy rule as setting the policy rate so that the inflation forecast was at the midpoint of the target band at some specific horizon, say two years. It was also often argued that for reasons of enhancing credibility, there should be some form of ‘penalty’ on the central bank if inflation moved outside the target band; in effect, the edges of the band should be viewed as an ‘electric fence’, to be avoided if at all possible.
This form of inflation targeting, however, never seemed particularly attractive to the RBA. While we are committed to ensuring that inflation outcomes are consistent with the medium-term target, we have not felt the need to set the cash rate so that our inflation forecast at a specific horizon was exactly 2½ per cent. Nor have we felt that the edges of the target are like an electric fence. We have, from the outset, had a more flexible approach than this. Since the current framework was adopted, our two-year-ahead inflation forecast has on occasions been below 2 per cent, and on other occasions it has been above 3 per cent.[3] And in terms of actual outcomes, year-ended CPI inflation has been outside the 2 to 3 per cent range a bit more often than it has been within the range.
This more flexible approach has two advantages. The first is that, in the event that inflation turns out to be unexpectedly too high or too low, the central bank has some flexibility about the pace at which inflation is returned to the target range. Provided the central bank's commitment to medium-term price stability is credible, this flexibility can deliver better outcomes for the real economy.
The second advantage is that this flexibility provides greater scope to take into account not just the central forecast, but also the medium-term risks around that forecast.
Let me try and make this a little more concrete by asking you to think about an economy that experiences a positive supply shock, say an improvement in productivity or lower world prices for the goods that it imports. Normally, this type of shock would be expected to boost economic growth, increase asset returns and lower inflation, at least for a time.
What then is the right monetary policy in this economy? In a world in which the setting of policy is determined solely by the two-year-ahead inflation forecast, the answer may well be to lower interest rates. If inflation is forecast to be below the target midpoint in two years time, lower interest rates, at least for a while, would help get inflation closer to target.
But would lower interest rates be the best response? To answer this I would need to tell you some more parts of the story. If asset prices were rising very quickly, investors were exuberant, and the financial sector was making credit liberally available, then lowering interest rates simply to hit the inflation target at one specific point in the future may not be the best response. Experience has taught us that low interest rates at a time of rapid increases in leverage and asset prices can pose significant medium-term risks to the outlook for the economy and for inflation. Ignoring these risks, and making leverage cheaper by lowering interest rates, simply to ensure that the short-term inflation forecast was at the target, is unlikely to be the best policy.
The general point here is that while the central forecast for inflation itself will often provide a good guide for policy, this will not always be the case. On some occasions, the medium-term risks are just as important.
It is sometimes argued that the way to deal with these risks is to simply extend the forecast horizon to say three years. So, instead of setting the interest rate so that the two-year forecast is at the midpoint of target, set it so the three-year forecast is at the midpoint of the target. The idea of thinking about what might happen beyond just the next two years makes a lot of sense, but the mechanical response of just extending the forecast horizon is probably not the best approach. The further out one goes, the less certain one can be about the future. It is hard enough to make judgements about the risks that the economy faces, let alone forecasting exactly when those risks might actually materialise. This makes it very difficult to incorporate the future realisation of risks into central forecasts. While we might have a reasonable degree of confidence that some particular risk will materialise at some point, predicting that point is extremely hard. In my own view then, this means that just simply extending the forecast horizon for the point forecast of inflation is an unsatisfactory way of dealing with risk.
The better approach is to have a flexible inflation target that effectively anchors medium-term inflation expectations, but provides the scope to take into account the various risks that arise in the complicated world in which we live. This means that we need to be thinking about the whole distribution of possible outcome, both in the short-term and medium-term, and not just the point forecasts over the next one or two years. Under this approach, at times, the two-year inflation forecast will be away from the midpoint of the target band. The flexibility embedded in this approach obviously needs to be exercised with care, and relatively rarely, but good policy means that, in some circumstances, it does need to be utilised.
In setting policy from month to month, the RBA Board spends a lot of time discussing the likely evolution of inflation and output and the risks facing the economy. In late 2008, when the outlook took a turn for the worse and the downside risks increased, the Board lowered the cash rate quickly and in large steps, despite inflation at the time being above the target band. Then, in late 2009 and early 2010 when the outlook had brightened, the cash rate was increased, with lending rates returning to around normal levels. And just last month, the Board again increased the cash rate, with the result that monetary policy is now judged to be slightly on the restrictive side.
This latest decision was taken not because the economy is currently growing too quickly or that inflation is currently too high. Clearly, neither is the case. Rather, it was made on the basis of the outlook for output and inflation. With the economy currently operating with relatively limited spare capacity at a time when a substantial lift in investment is expected, it was judged that inflation was more likely to rise than fall over the next few years. Given this, the Board judged that it prudent to make an early and modest adjustment to the cash rate. In doing so, the Board has sought to reduce the probability of inflation rising to uncomfortably high levels and thus requiring a more substantial increase in interest rates later on.
Before I turn to the forecasting process itself, it is important to emphasise that the Board's decisions are not driven in a mechanical fashion by the forecasts. Both the Bank staff and the Board are very conscious of the limitations of numerical forecasts. Predicting exactly which quarter inflation is likely to increase, and at what pace, is inherently difficult. What is often more useful is the analysis and storyline that support the numerical forecasts. It is this analysis, rather than exact numbers, that is rightly the main focus of our internal discussions and our communication with the public.
Forecasting at the Reserve Bank
I would now like to turn to the actual forecasting process at the RBA.
As many of you know, we publish a table that sets out our forecasts of inflation and growth each quarter in the Statement on Monetary Policy. We also discuss the broad analysis underlying these forecasts and the main risks. Consistent with our general approach, we do this in words, rather than using fan charts showing statistical bands of uncertainty as has become popular in some other countries.
The forecasts that are published in the Statement on Monetary Policy are discussed at the Board meeting three days earlier and are developed through a series of internal meetings over the preceding month. Outside of this quarterly cycle, the forecasts are kept under review by the staff.
The actual forecasting process has three key elements. The first is the day-to-day assessment of trends in the economy. The second is the use of formal econometric models. And the third is the information that we obtain from our business liaison program. I would like to touch on each of these.
The obvious starting point is to understand what is currently happening in the economy and the financial system and what that means for the future. In our Economic Analysis Department there are around 50 economists continually monitoring the pulse of the domestic and global economies. Elsewhere in the Bank, staff are analysing developments in the financial system and financial markets.
Inevitably the data that we look at are subject to measurement error and they are often conflicting. This means that much of our time is spent discussing the data and what they tell us about recent trends, as well as the future. Judgement is obviously critical here, with the strong collective memory of the Bank staff playing an important role. The judgments that are reached are also anchored by some underlying economic relationships and concepts. As we prepare our forecasts, we are constantly asking ourselves questions such as: how much spare capacity does the economy have; what constitutes full employment; what is the neutral real interest rate; what is the potential growth rate of the economy; what is the state of private-sector balance sheets; and how well anchored are inflation expectations. I know many of you ask the same questions.
In most cases it is not possible to come up with definitive answers to these questions, and the Bank certainly does not have doctrinaire views. What we do is continually confront our conditional assessments with the ongoing flow of economic data. When things turn out differently to what we expect, we study the outcomes very closely to see what we can learn. This process of continual testing, learning and re-testing is at the core of our forecasting process.
The second element of our forecasting is the use of a suite of forecasting models. This suite includes simple, single-equation models, multi-dimensional vector autoregressive models, and an estimated structural Dynamic Stochastic General Equilibrium (DSGE) model. We use this suite, rather than just a single model, because of the considerable uncertainties in the modelling process. Most of the time, we look for the central tendency of the various models and use them to inform the more judgemental process that I just discussed. The models are also used in the development of various scenarios.
The third part of the forecasting process is our liaison with business. Each month the RBA staff across the country conduct around a hundred meetings with businesses and agencies in an effort to better understand what is happening right now and what is likely to happen in the future. Over recent years, a couple of examples stand out where this liaison has been particularly important. One was in helping us understand the implications of the much tighter credit conditions in 2008 and 2009. And the other has been helping us understand the scale and the timing of the pick-up in investment in the resources sector. In both cases, our liaison provided us with valuable information that was not available elsewhere and had a significant role in shaping our forecasts.
So that in a nutshell is how we go about forecasting. It is a combination of judgement, formal models and liaison. And, as I said a few minutes ago, it is as much about the underlying analysis and storyline as it is about a particular set of numbers.
A Higher Capital Stock
I would now like to discuss a couple of practical considerations that we have been thinking about as we have put our forecasts together over recent times.
The first of these is the implications of a significant increase in Australia's stock of physical capital.
As the Governor spoke about at length last week, Australia is experiencing a perhaps once-in-a-century boom in the terms of trade, largely reflecting the urbanisation and industrialisation of Asia. This boom has increased the average return on physical capital in Australia, although clearly there is significant variation across sectors, with the return on capital in some sectors having declined.
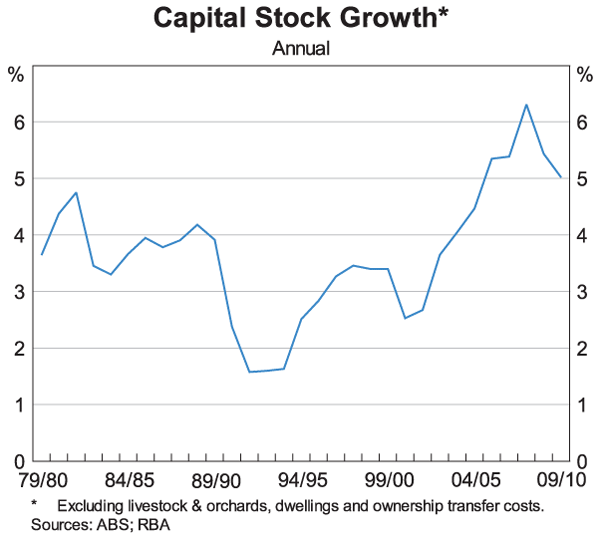
The increase in the average return on capital means that it is plausible to argue that the optimal capital stock in Australia has increased, perhaps significantly so. Not surprisingly then, the ratio of business investment to GDP has been high over the past five years, and it is expected to remain high over the next few years. Since 2005, Australia's capital stock (excluding dwellings) is estimated to have increased at an average annual rate of around 5½ per cent. This is up by 2 percentage points from the average rate of increase over the previous quarter of a century (Graph 2).
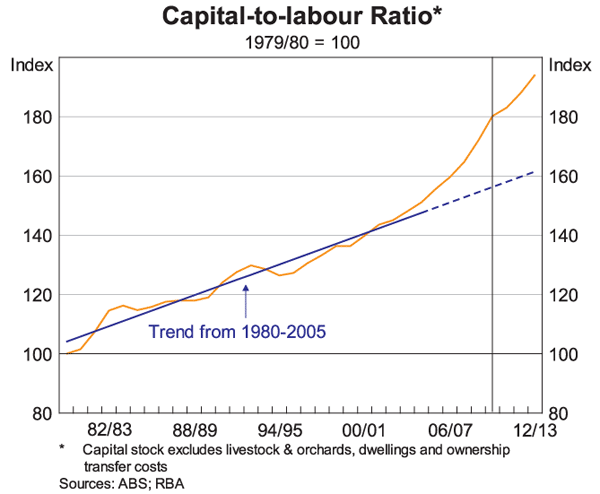
One implication of this pick-up in investment is a pick-up in growth in the economy's overall capital-labour ratio. Again, over the 25 years to 2005, this ratio increased at an average annual rate of around 1¾ per cent. In contrast, over the past five years, it has increased at twice this pace, and this faster rate of increase is also likely to continue for a while yet (Graph 3). In effect, we are becoming a more capital-intensive economy, with movements in world prices leading to a significant expansion of the resources sector, which is one of the most capital-intensive sectors of the economy.
From a forecasting perspective, this raises a host of interesting questions. I want to touch on just three of them.
The first question is the implication for the growth rate of potential output. If everything else were constant, faster growth in the capital stock should lead to faster growth in potential output. If we use a simple production function, for example, and hold everything else constant, the 2 percentage point increase in the growth rate of the capital stock (excluding dwellings) that we have seen would lift potential growth by ½ percentage point or possibly a bit more.
But of course, everything else is not constant. In particular, total factor productivity growth has slowed significantly over the past decade. Indeed, according to the national accounts, almost all the growth in output since the early 2000s has been accounted for by growth in labour and capital inputs, rather than by improving the way we use that labour and capital (Graph 4).
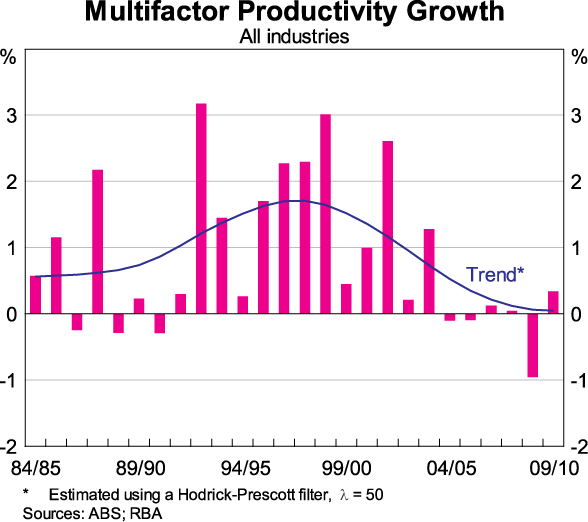
One important forecasting issue is whether this is likely to continue, or whether a return to closer-to-average productivity growth will see potential output grow a little more quickly than we have become accustomed to over the past decade. The latter is clearly the preferable outcome, although as yet there are few signs of a lift in productivity growth.
A second question is the implications for inflation. If indeed potential output growth were to pick up, this would mean that the economy could grow more quickly over the medium term without causing inflation to rise. But in the short term, producing and installing the increased capital can add to demand pressures in the economy. Of course, one way in which these pressures can be mitigated is by importing the required machinery and equipment. To some extent this is what has been happening. Much of the physical capital for a number of the large resource projects is, by necessity, imported. And the appreciation of the exchange rate has lowered the relative price of capital goods from abroad. Over time, imports of capital goods have grown considerably more quickly than investment (Graph 5). Yet, even as we rely more on imported machinery and equipment to increase the capital stock, it still takes significant domestic resources to install this imported machinery and equipment. So an important forecasting issue here is to what extent the period of accelerated growth in the capital stock will affect inflation pressures in the economy, and to what extent can these pressures be reduced by importing goods from abroad.
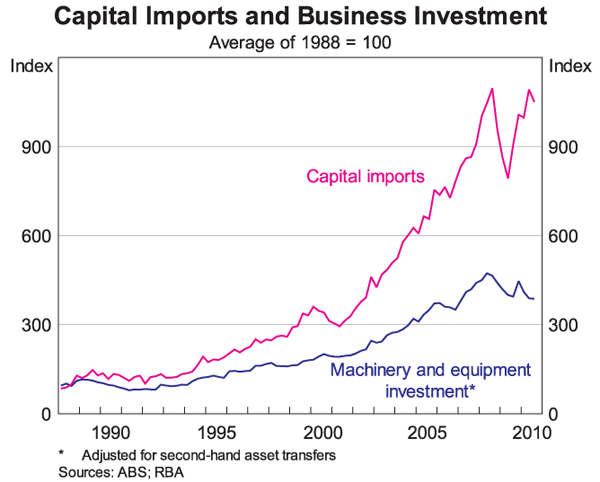
A third question is the implications for the risk profile of the overall economy of the higher capital stock. While the central scenario is a positive one, there are risks. In the late 1980s, for example, we saw a large increase in the capital stock, particularly of commercial buildings, but when the recession came, much of this investment had to be written off. The result was large losses to banks and investors. Similarly, there is no guarantee that the current wave of investment will earn high returns. So a relevant forecasting question here is how these risks are likely to play out and how they are influenced by the way in which the increase in the capital stock is financed.
In thinking about each of these three questions – the impact on potential growth, the implications for inflation and the changing risk profile of the economy – it is the combination of judgement, models and liaison that I discussed a few moments ago that we rely on. As in other areas, we do not have fixed views, but instead we are continually testing, learning and re-testing.
Confident but Cautious
A second consideration shaping our recent forecasts is the attitude of households to spending and borrowing. Over the past year or so, we have had the rather unusual situation in which households, when surveyed, report that they are quite optimistic about the future, yet at the same time, they are quite restrained in both their spending and borrowing.
While measuring saving rates is notoriously difficult, the latest national accounts show a marked increase in the household sector's saving rate over recent years, with the increase fully reversing the decline that took place from the end of the 1980s to mid 2003 (Graph 6). Somewhat remarkably, the increase in the household saving rate in Australia, at least as measured, has been larger than that in many other countries, including the United States where household balance sheet repair is a major factor weighing on the economy. And unlike in the United States, where household confidence is very low, this rise in saving has occurred in Australia at a time when confidence is quite high (Graph 7).
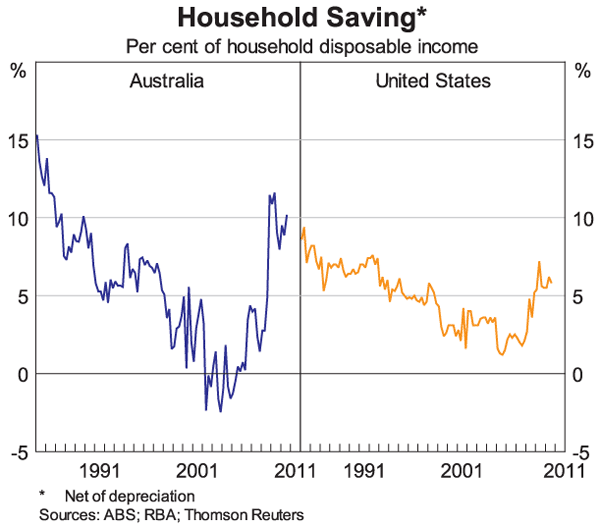
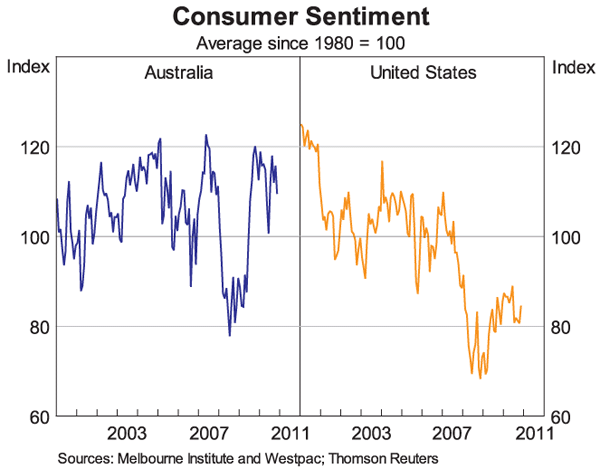
There are a number of explanations for this increase in household savings in Australia, but it is likely that the most important is a rethinking of attitudes to debt and spending following the events in the global economy over the past few years. It would appear that many households now view high levels of debt and low rates of saving as more risky than they did previously. This has led some to save a little more and others to borrow a little less. And the strong growth in household incomes over the past year has made this easier to do.
The forecasting issue here is how persistent is this change likely to be. Is it just a temporary phenomena that will wane as memories of GFC fade? Or has there been a long-lasting change in attitudes after two decades of rapid increases in household borrowing?
It is difficult to know what the right answer is, but the restraint being exhibited by the household sector is turning out to be quite long-lasting. In preparing our own forecasts, we have, for some time, been assuming that the household saving rate stays high for quite a while yet. If this were to occur, not only would it lead to a lowering of risk in household balance sheets, but it would reduce inflationary pressures during the period of high investment. This is obviously an area that we are watching closely and it is one where our approach of testing, learning and re-testing is important as we continue to review our forecasts.
Conclusion
So, in summary there is no shortage of interesting issues to ponder over as we think about the future. The world economy is undergoing fundamental change as the weight of economic activity moves from the North Atlantic economies to Asia, and as the household sectors of many countries re-think their attitudes to spending and borrowing. These are important structural changes that are likely to shape the Australian and the global economies over coming years. I wish you luck in incorporating these changes into your central forecasts and into the risks around those forecasts!
Thank you for your attention this evening and I wish you all the best for 2011.
Endnotes
Previous discussions of the role of forecasts at the RBA can be found in Stevens G (1999), ‘Economic Forecasting and its Role in Making Monetary Policy’, RBA Bulletin, September, pp 1–9, and Stevens G (2004), ‘Better than a Coin Toss? The Thankless Task of Economic Forecasting’, RBA Bulletin, September, pp 6–13. [1]
Excluding the effect of the GST and mortgage interest payments, the average inflation rate has been 2.6 per cent. [2]
In part, this reflects the fact that for much of the inflation-targeting period, the forecasts were prepared on the assumption that the cash rate was held constant over the forecast horizon. [3]