Speech The Australian Foreign Exchange Market
I am very happy to be here today at the Insto function to talk about the foreign exchange market in Australia. I hope you have an enjoyable day listening to what looks like a very interesting line-up of speakers and topics.
In part to provide some background for the rest of the day's proceedings, I thought I would look back over the past 20 years or so at how the Australian foreign exchange market has evolved during the floating exchange rate period. I will then discuss two developments of current interest to the foreign exchange markets: carry trades and low volatility.
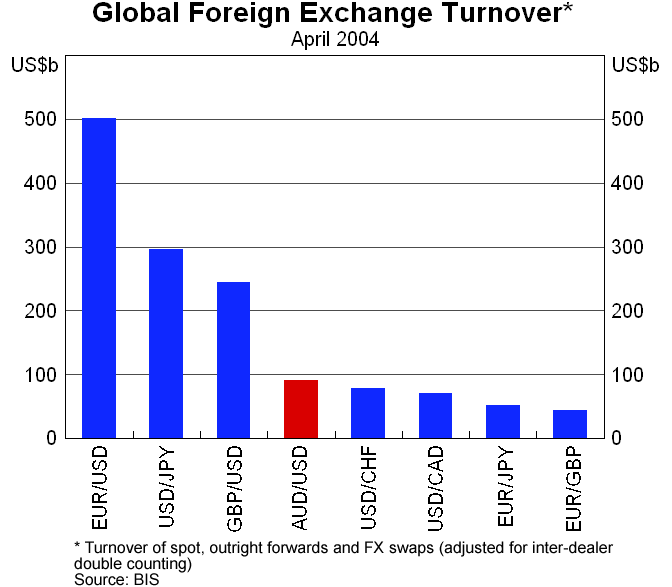
Since the exchange rate was floated in December 1983, the Australian foreign exchange market has grown considerably to be the highly liquid, globally integrated market that it is today. In 2004, the local market was the seventh largest in the world and the AUD/USD was the fourth most traded currency pair globally.
For many years now, the Reserve Bank has collected data on the foreign exchange market in Australia which allow one to analyse its development. In addition, the Bank for International Settlements (BIS) has, since 1989, conducted a triennial survey of foreign exchange markets globally, including the Australian market, where the RBA co-ordinates the responses. The most recent was conducted in April 2004, while the next is to occur in April next year. Combining this with our own survey means one can assess the development of the Australian market relative to those elsewhere in the world.
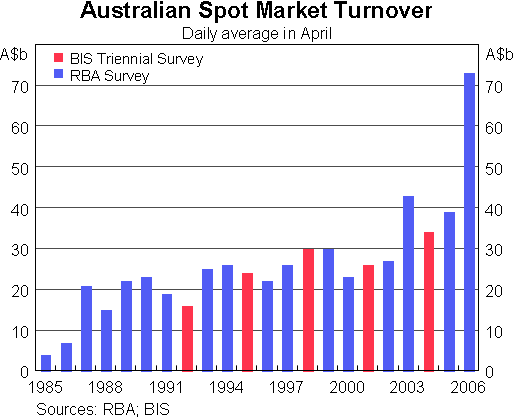
Drawing on these data, Graph 1 shows the large increase in the size of the Australian foreign exchange market over the past two decades. Spot trading in foreign exchange in all currencies has grown from A$4 billion a day in 1985 to be over A$70 billion a day in April of this year. By way of comparison, this 15 per cent per annum increase compares to an increase in Australia's nominal GDP of 7 per cent per annum over the same period.
The graph shows particularly strong growth over the past year. This surge also occurred in the other markets for which we have more timely data, including London and New York, where the growth has been almost identical to that in Australia. In Australia, the recent growth in turnover has been predominantly in EUR/USD and AUD/USD. The large growth in turnover over the past year or so is possibly related to the increased treatment of foreign exchange as an asset class in its own right and the rapid growth in funds under management by hedge funds, a number of whom have currency-related strategies. In the past, more traditional funds managers had often hedged exchange rate movements out of their returns.
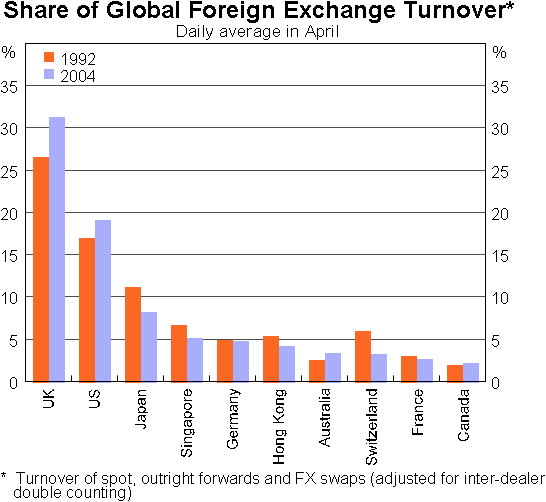
The growth in the Australian foreign exchange market over the past two decades has broadly paralleled that in the global market. The share of trades conducted in the Australian market has risen slightly over the past 12 years so that the Australian market is the seventh largest in the world, up from the ninth largest a decade ago. Thus the foreign exchange market is relatively large compared to Australia's economic size, with the Australian economy being the 15th largest in the world.[2]
Graph 2 also shows that London has consolidated its position as the global centre of foreign exchange over the past decade. Around one-third of all transactions now occur in London.
There have been some notable changes in the structure of the foreign exchange market in Australia over the past two decades:
- the rising share of activity in the swaps market.
- the increasing share of activity accounted for by global banks
- the rise of electronic broking
- declining margins
- the changed nature of doing business
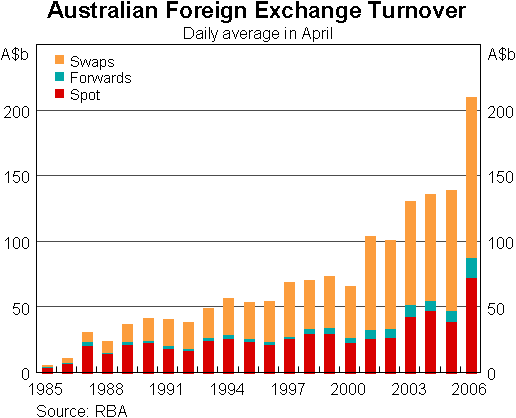
On the first change, Graph 3 shows the turnover in spot, outright forwards and swaps in the Australian market. The most notable development is the large rise in swaps, which now account for around 60 per cent of all daily transactions in the market. As an aside, the share of swaps in the Australian market is somewhat higher than that in the global market. Back in 1984, the swap market was only in its infancy. The rapid growth in swaps turnover reflects the rise in the share of Australia's foreign liabilities that is accounted for by banks, which actively use swaps and other derivatives to manage their foreign exchange exposure, as well as Australian residents becoming increasingly sophisticated in hedging their foreign exchange risks.
The participants in the Australian market are markedly different from that 20 years ago. Around the time of the float, the bulk of the participants in the market were local banks. However, soon after the float a number of foreign banks were given licences to participate in the local market. While some foreign banks had been in the country for many years prior such as (what is now) BNP Paribas, there was a marked increase in the number of new entrants in the middle of the 1980s which significantly increased competition.
Notwithstanding the new entrants, the concentration of the market has increased in recent years. In the late 1980s, the 10 largest participants in the local market accounted for around 60 per cent of all foreign exchange transactions. Today they account for close to 90 per cent. To a large extent this reflects a number of mergers of global financial institutions. However, as I point out shortly, this increased concentration has not been associated with any obvious decrease in competitive pressures.
For the first ten years of the float most interbank foreign exchange trading in Australia was undertaken through voice brokers or on a call out basis (dealing direct). That is, base prices were placed through brokers but if banks required additional liquidity they would call each other. There were conventions on the size of spreads for the amount requested, for example 7 points for $10 million, and clubs such as the $20 club where members were obliged to quote each other in that amount. The spread could however widen to 20 or 50 points in times of extreme market dislocation.
Banks employed large numbers of staff to compete with other market players and had the capacity to deal in high-volume periods. Through these years, volatility in the exchange rate was high and market transparency was low. Consequently, there would often be quite different views on where the market was trading at any one time. Some of those who worked through this period (including some in this room) argue that the skill of price-making has been somewhat lost, complaining that many traders are all at sea when they are unable to refer to an electronic pricing system and more often than not will not take risk on board.
The nature of the trading was different, with little automation and deals recorded with note book and pencil to be later entered in the ledger by hand. There was no spreadsheet to ensure conversion calculations were correct so the process involved rechecking a number of times with calculators. Telex machines confirmed the deals with back offices.
In the following years, banks competed away profit margins and the number of traders and voice brokers steadily declined. The voice brokers' demise was accelerated in the early nineties by the rise of electronic broking systems (deal matching systems). The first of these systems was EBS in USD/DEM while AUD first traded on a Reuters deal matching system in 1992. Although the market moved rapidly towards these systems there were concerns that they may not perform effectively during times of very high volume and price movements. In the event, these fears have not been realised with almost all interbank dealing undertaken on the matching systems. Electronic brokered trades are now around 90 per cent of the market.
More recently, the market has seen the development of individual and multi-bank internet trading platforms for wholesale customers. These platforms have proved popular and stimulated yet another level of market development. While there are still differing opinions on this topic, it appears as though the matching systems still hold sway and that the other dealing systems have simply allowed more customers access to trade FX at finer margins. Moving forward there are indications that this technology will be made available to retail customers to access foreign exchange markets at close to wholesale margins.
This combination of heightened competition and technological change, particularly in communications, has contributed to a marked narrowing in margins. Generally, the bid-ask spread on an AUD/USD rate for A$10 million is 1-2 basis points these days.
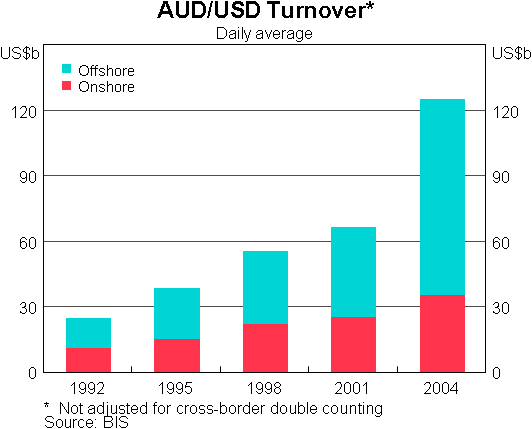
Turning from looking at foreign exchange markets in the aggregate to individual currencies, the AUD/USD pair is the fourth most traded currency pair around the globe. Not surprisingly, it is by far and away the most traded pair in the local market, accounting for just under two-fifths of all trades. The share of AUD/USD transactions which take place offshore rather than in the local market has risen considerably, reflecting the continued interest globally in Australian investments. In 1992, just under half of the trading in AUD/USD took place onshore, but now this has fallen to under a third.
More generally, in the most recent BIS survey in 2004, the Australian dollar was on one side of 5½ per cent of all transactions, making it the sixth most traded currency after the US dollar, euro, yen, pound and swiss franc.
| A$b | Per cent of total | |
|---|---|---|
| AUD/USD | 78.1 | 36.9 |
| EUR/USD | 35.9 | 17.0 |
| USD/Other (mostly GBP, CAD, CHF) | 30.9 | 14.6 |
| USD/JPY | 23.0 | 10.9 |
| USD/NZD | 17.2 | 8.1 |
| USD/other Asian | 6.0 | 2.8 |
| AUD/other | 5.9 | 2.8 |
| AUD/JPY | 2.7 | 1.3 |
| AUD/NZD | 2.0 | 1.0 |
| Total | 211.3 | |
|
Source: RBA |
||
Carry Trades
Having provided some background on the foreign exchange market, let me now turn to two factors that are having a notable influence on the market today.
One of the factors contributing to the increased activity in the Australian dollar in recent years has been the carry trade. As you are all aware, the carry trade in a foreign exchange context involves borrowing funds in lower-yielding currencies such as the Japanese yen and Swiss franc and investing them in higher-yielding currencies such as the Australian dollar or the New Zealand dollar.
For those of you who might remember some of your undergraduate economics, the carry trade stands in direct contradiction to uncovered interest parity which is often an important component of macro-financial models. The basic premise of uncovered interest parity is that any positive interest differential between two currencies is offset by the expected change in the exchange rate between those currencies over the life of the investment. In contrast, those who undertake carry trades do not expect the exchange rate movement to wipe out the interest differential, sometimes they even expect the converse, namely that any exchange rate move will increase the value of the investment.
To illustrate the possible returns from a yen/aussie carry trade in recent years, Graph 6 shows the 90-day interest rate spread between Australia and Japan without any hedging of the investment and the (annualised) movement in the AUD/JPY over the 90-day period. Graph 6 shows why this trade has been particularly popular. For much of the past four years, the exchange rate movement has increased the return from such an investment, and often quite substantially, as the Australian dollar has appreciated against the yen. This was particularly the case in 2005.
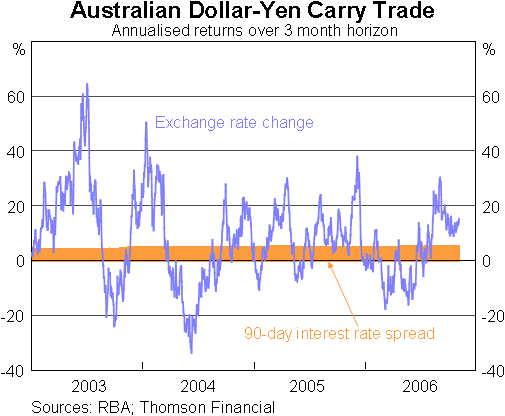
Only on very few occasions has the Australian dollar depreciated against the yen sufficiently to more than offset the positive carry. One of these occasions was earlier this year when the Australian dollar depreciated against the yen as markets came to the realisation that the long period of quantitative easing and the zero interest rate policy was coming to an end in Japan. At the same time there was a generalised shift out of assets that were seen as being more risky which was reflected in a repatriation of some funds by Japanese investors. These two events interacted with each other to make the carry trade less attractive for a time, but in recent months, it appears to have come back, with recent returns around the same as those realised in 2005.
Related to this has been the issuance of Australian dollar Uridashi bonds, which are marketed directly to Japanese retail investors. Again, in recent years the Japanese retail investors have benefited from the substantially higher yield on offer than that available locally in Japan, but have not generally seen that higher yield eroded by currency movements. If anything, the yield has often been boosted by currency movements.
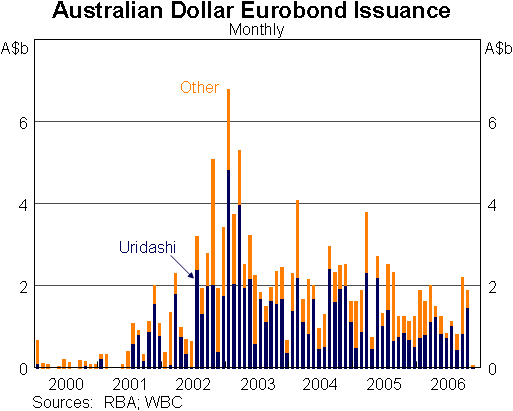
The carry trade, in and of itself, may not be all that large relative to the aggregate capital flows in the Australian market. Nevertheless, the higher turnover in the Australian dollar over the past few years that I described earlier probably reflects in part the influence of these investors, along with the development of currencies as an ‘asset class’ as part of the search for yield.
Foreign Exchange Stability
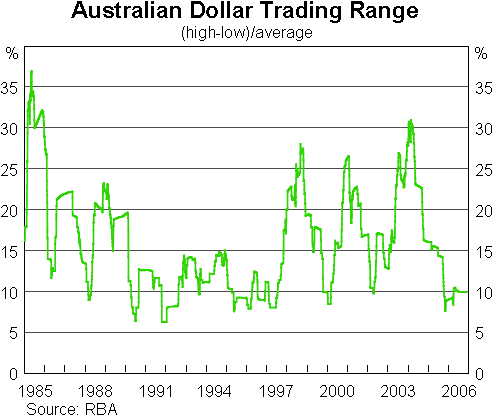
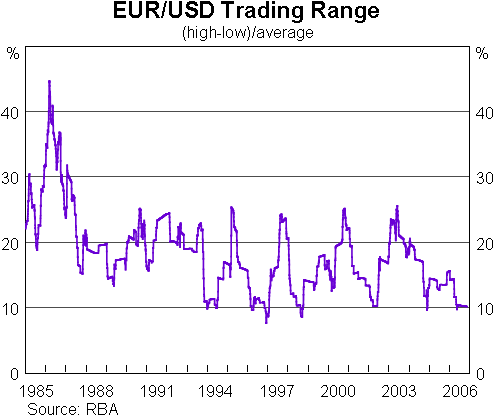
Ironically, despite the rapid growth in turnover in the Australian foreign exchange market, the exchange rate itself has been remarkably stable. This is not a phenomenon unique to the Australian market; the G3 currencies have also exhibited a relatively low degree of volatility, notwithstanding sizeable movements in short-term interest differentials and concerns in some quarters about the durability of the US capital account surplus.
Graph 8 shows one measure of volatility in the AUD/USD exchange rate over rolling twelve-month periods. It shows that the most recent 12 months have been one of the least volatile in the floating exchange rate period. Graph 8 also shows a similar calculation for the EUR/USD and shows the same low level of volatility. Implied volatilities for the currencies, which tend to track the historical volatilities closely, yield a similar picture. I suppose this lack of volatility has not made it a particularly exciting time for a number of you!
I don't have a satisfactory explanation for this relative stability in exchange rates.[3] The continued strength of the global economy along with the increased transparency and predictability of monetary policy decisions have probably made some contribution. The large reserve holdings of central banks, and their relatively conservative management to benchmark, have no doubt also played a role. But perhaps you will hear a convincing explanation later in the program.
To finish, I would like to thank those of you who participate in the RBA's monthly survey of the foreign exchange market which has provided the basis for much of what I have presented today. We are currently slightly revamping the survey to bring it more directly into line with the triennial BIS survey, and to make sure that it provides the necessary information for you the practitioners. Other foreign exchange centres, through their foreign exchange committees, are also in the process of improving the timeliness and usefulness of the information that they collect on the functioning of their markets. I hope these small changes do not cause any significant problems and that you will all continue to provide us with this useful information in the future. This will allow us to monitor the continued growth of the Australian foreign exchange markets in the years to come.
Endnotes
I thank Benn Robertson, Chris Becker, Dan Fabbro and the RBA's FX dealing staff for their help with this talk. [1]
This is on a market exchange rate basis rather than a purchasing power parity basis. The former is arguably the more appropriate metric when financial variables are under consideration. [2]
Two recent analyses of this issue are “Recent Volatility Trends in the Foreign Exchange Market”, Speech by Dino Kos, Federal Reserve Bank of New York, 11 May 2006. <http://www.ny.frb.org/newsevents/speeches/2006/kos060511.html> and “The recent behaviour of financial market volatility”, BIS papers No 29, August 2006. [3]
