Speech Talk to AIG ‘Economy 2006’

Tony Richards
Head of Economic Analysis Department
Address to Australian Industry Group
Economy 2006
Forecasting Industry Prospects Forum
Sydney –
Good morning and thank you for the invitation to participate in this conference.
As you may know, the Reserve Bank has an extensive liaison program which operates in all states and territories. Each month, we meet with around 100 firms and organisations to learn about developments in different regions and industries. We combine this with information from a wide range of statistics to gain a deeper understanding of trends in the economy. We are also fortunate to be able to rely on a range of business surveys, including some from AIG, in this process.
Over the past three weeks, the Bank has provided several assessments of recent economic developments and the policy outlook, in particular in our quarterly Statement on Monetary Policy and the Governor's parliamentary testimony. Our assessment of the economy remains little changed from those two earlier assessments, so my talk today is not intended to modify them. However, some important data have become available since then, and I will touch on these as I discuss some aspects of recent developments and the economic outlook. But nothing I say should be interpreted as altering the policy outlook provided by the Bank during February.
Let me begin with the world economy. The world economy is now in its fifth year of recovery from the 2001 recession. We can illustrate this with a graph for the average GDP growth rates in Australia's major export destinations.
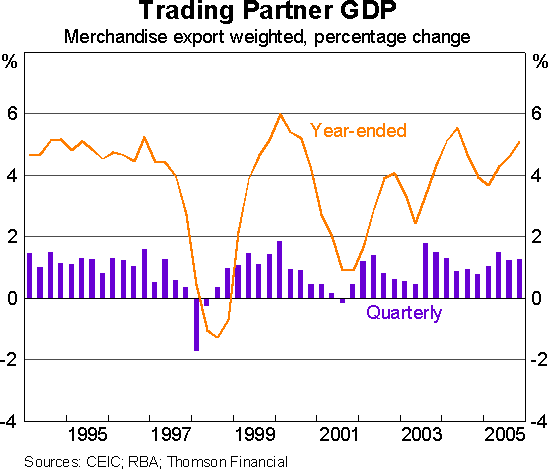
Based on the experience of earlier recoveries, there is every reason to think that this global recovery still has further to run. Most importantly, the world economy still appears to have a fair bit of spare capacity, in terms of both labour and capital. So it is not surprising that global growth forecasts for 2006 and 2007 suggest a continuation of above-average growth.
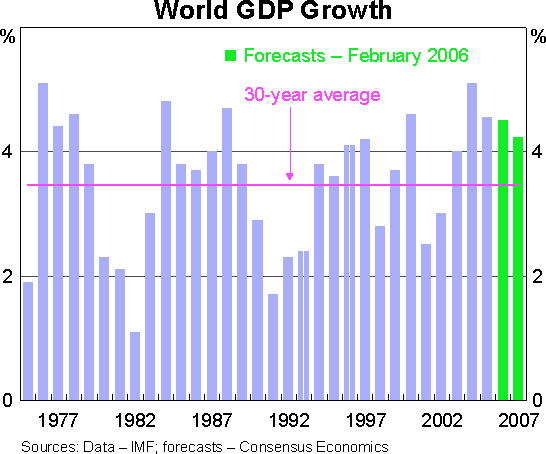
It is noteworthy that the higher level of oil prices relative to a few years ago does not appear to have had much impact on growth outcomes or forecasts. One reason is that the strength in oil prices is not the result of a cut in global supply, as occurred in the two episodes in the 1970s. That is, it is not a negative supply shock for the world economy. Instead, the increases in prices have been, in large part, a reflection of the growth in demand for oil, which is driven by the strength of the world economy.
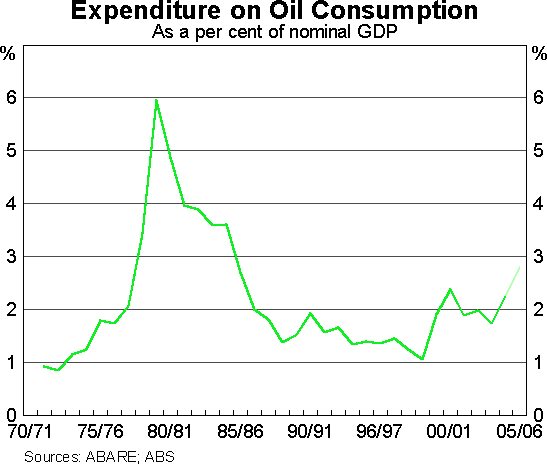
Another relevant fact is that oil is a smaller component of total spending than it was at earlier times. This is true for many countries, but we can illustrate it for Australia with a graph that shows spending on oil as a proportion of total spending in the economy. The reduced importance of oil relative to the late 1970s and early 1980s reflects two facts. First, the economy uses less oil to produce each unit of output than previously: that is, we have become more efficient users of energy. Second, despite the price increases over the past few years that have taken prices to around US$60 per barrel, oil is not as expensive in real terms (that is, relative to other goods and services), as it was 25 years ago when oil was trading at around US$35 per barrel.
The higher level of oil prices has not resulted in any substantial pick-up in global inflation. Headline CPI inflation in the major economies has only picked up a little, and core inflation rates have been fairly stable. The maintenance of low inflation is quite different to the experience of the 1970s.
But there has been significant inflation in global commodity prices, which is a positive development for an economy like Australia. You will all be familiar with the large increases in coal and iron ore prices that have occurred over the past couple of years. But the strength in commodity prices is much broader than this. Base metals prices have nearly doubled over the past three years. And rural commodity prices have risen by 17 per cent over the past year. Reflecting these increases, the Reserve Bank's index of commodity prices is now at the highest level in the 24 years for which we have data.
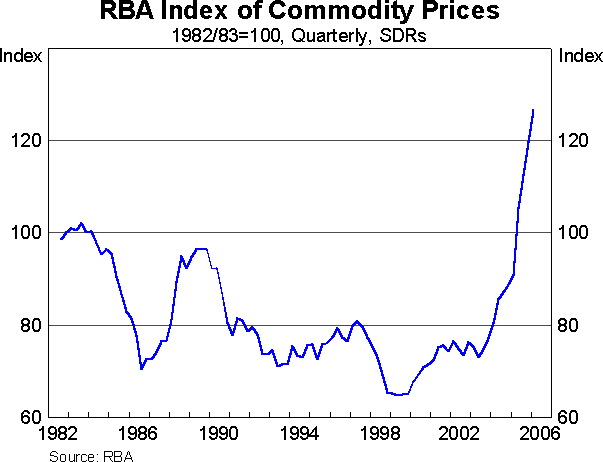
This strength in the prices of commodities has occurred at the same time as global prices for many manufactured goods have actually fallen. The result is that the terms of trade, which are the ratio of our export prices to our import prices, have strengthened very markedly in recent years. The rise in this ratio is equivalent to an increase in Australia's real income. As a nation, we can buy more goods and services than previously.
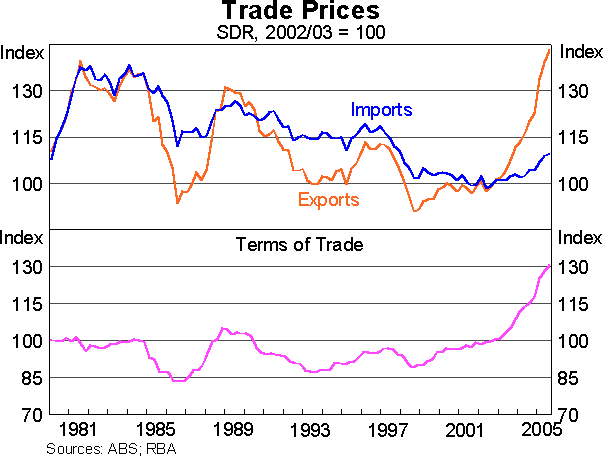
The expansionary impact of higher commodity prices and the stronger terms of trade occurs through several channels. Higher prices flow through into higher profits for resources companies, which accrue to both domestic and foreign shareholders. They also boost tax and royalty revenues to federal and state governments. And they lead to higher investment in new resource projects which have multiplier effects on the domestic economy.
The benefits accrue all through the economy. Most obviously they have resulted in boom conditions in parts of Western Australia, Queensland and the Northern Territory where resources are located. But people in other regions benefit too. People in Sydney or Melbourne or Adelaide hold shares in resources companies, either directly or through their superannuation funds. Firms providing manufactured goods or professional services to the resources companies may be located in these cities rather than in the resource rich areas. And even if the increase in the terms of trade results in an appreciation of the exchange rate, which may hurt import-competing firms, it results in lower import prices which benefit people all over the country.
Now let me turn to some recent data on the domestic economy. The broadest measures of production and spending in the economy come from the national accounts, which were released yesterday for the December quarter. GDP increased by 0.5 per cent in last quarter of 2005, and year-ended growth was 2.7 per cent. Domestic spending rose solidly in the quarter, reflecting strong growth in business investment and public demand, and moderate growth in household consumption, which more than offset a further decline in dwelling investment. Although exports picked up in the quarter, the growth was again outpaced by solid growth in imports. As a result, growth in real spending in the Australian economy has continued to run ahead of growth in production. This partly reflects the expansionary effects of the increases in the terms of trade.
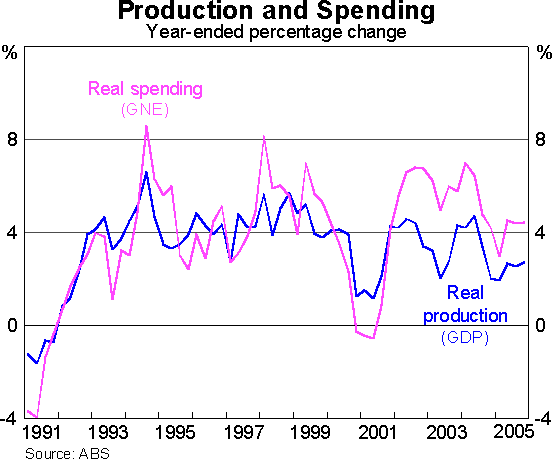
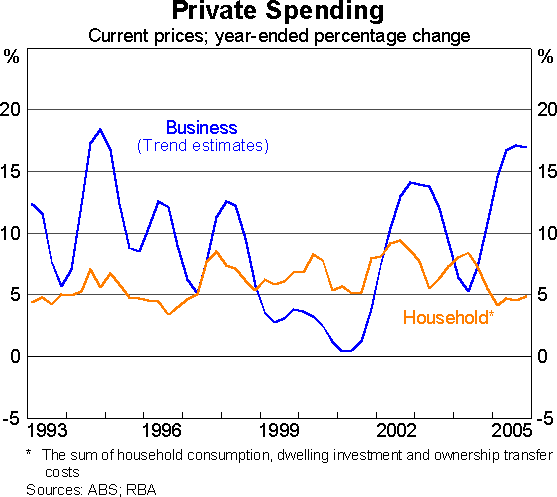
The national accounts and the broader flow of recent economic data present a picture of strong growth in spending by businesses, and relatively subdued growth in spending by households. Investment spending by businesses has historically been quite volatile, but by any measure the recent growth is rapid. In contrast, spending by households (which is represented here as the sum of household consumption spending and spending on dwelling investment) is traditionally much more stable (though this is partly due to the way that implicit rent from the housing stock is treated). There was a long period of fairly strong growth in household spending (in both real and nominal terms) over most of 1997–2003. However, there has been a fairly notable slowing more recently. This reflects both the fall in investment in housing and a slowing in the growth of consumption spending.
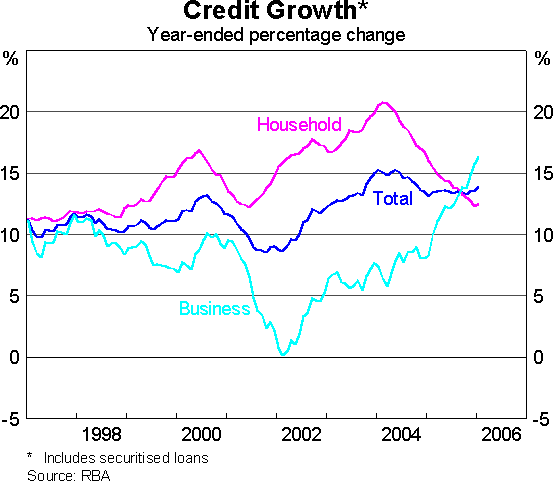
The recent divergences in the two sectors are also apparent in data for household and business borrowings from banks and other lenders. These show that growth in credit to households was well above growth in credit to businesses for the period from 1998 to 2004. However, the growth of lending to households has recently slowed significantly, and lending to businesses has picked up.
The slowdown in the growth of household spending and borrowing corresponds to the period of the sharp slowing in growth of house prices. There was a long boom in house prices over 1996–2003, with average nationwide house prices growing at an annual rate of nearly 20 per cent in the last two years to the end of 2003. Since then, nationwide prices have been essentially flat.
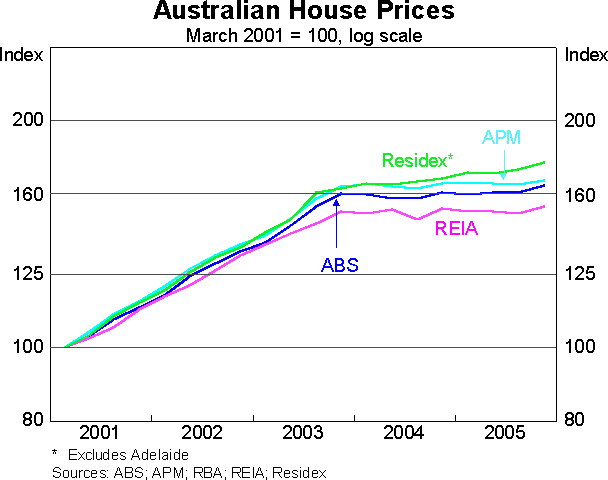
As is shown in this table, there has been a sharp slowing in the rate of price growth in all capitals except Perth. And as you will be aware, there has been some divergence in the experiences of Sydney and most other capitals over the past two years. Average prices have fallen in Sydney, but this has been offset in the nationwide aggregate by rises in some of the other capitals. But Sydney's recent relative weakness followed an earlier period when prices grew much faster than in the other capitals. We showed a graph in our recent Statement that price relativities between Sydney and the other capitals have now returned to the pre-boom levels of the early to mid 1990s.
| Percentage change over two years to: | ||
|---|---|---|
| December 2003 | December 2005 | |
| Sydney | 41 | −8 |
| Melbourne | 30 | 2 |
| Brisbane | 76 | 7 |
| Adelaide | 50 | 10 |
| Perth | 42 | 35 |
| Canberra | 52 | 1 |
| Australia | 42 | 2 |
| *APM composition-adjusted measure | ||
The earlier strong growth in house prices was obviously related to the rapid growth in household borrowing, with the causality running in both directions. With house prices rising, households were comfortable in increasing their indebtedness. And banks were happy to lend. But much of the credit was used to further bid up the prices of houses.
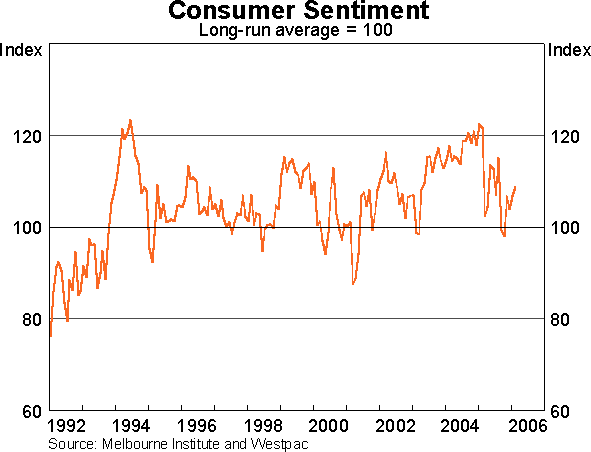
What we have seen more recently is that households are not incurring new debt at the rate that they were, and there has probably been some tendency for some households to step up the rate at which they are paying off their debt. Although income growth has held up reasonably well, households have reduced the rate at which their spending is increasing. The result has been a stabilisation, and even a modest increase, in the household saving rate. It is worth noting that data for the saving rate are notoriously noisy and can get revised substantially. However, it would not be surprising if there was some tendency for it to rise a bit further: that is, for spending growth to run below income growth for a while longer. But household spending is likely to be supported by reasonably positive consumer sentiment. For example, the responses to the survey from Westpac and the Melbourne Institute show sentiment above long-run averages, although down somewhat from the very high levels seen until around a year ago.
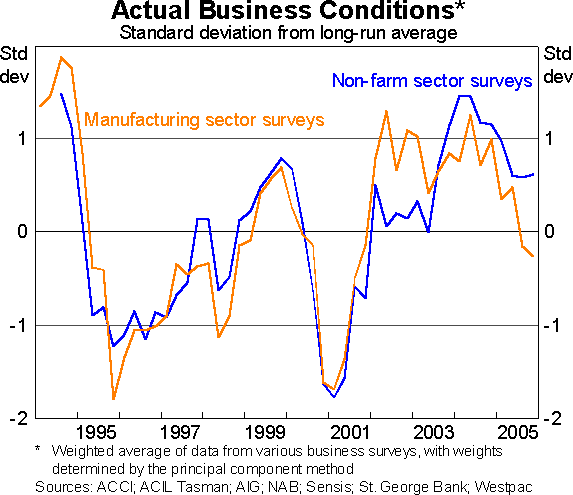
However, any tendency for continued moderation in the growth of household spending could be offset to a large extent by strength in business spending. The business surveys generally point to overall business conditions being well above average levels, although firms in the manufacturing sector have tended to report less favourable conditions than those in the broader economy. This graph shows an average of responses from several different surveys, including the AIG's Performance of Manufacturing Index.
Consistent with these surveys, both the reported earnings of listed companies and the profits data from the national accounts give a picture of strong aggregate profitability. Not surprisingly, profitability is especially strong in the resources sector. But there has also been some growth in the aggregate profits of non-mining companies.
So it is not surprising that data on business investment show that investment is growing particularly strongly in the mining sector. However, as with profits, the strength is not confined to the mining sector. The ABS capital expenditure survey suggests that a fairly wide range of industries are also increasing their investment.
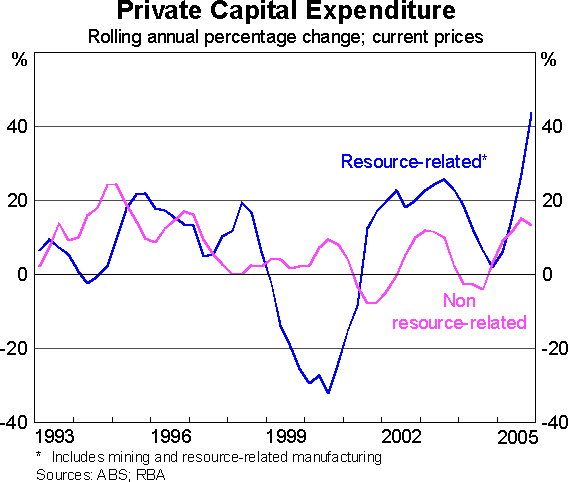
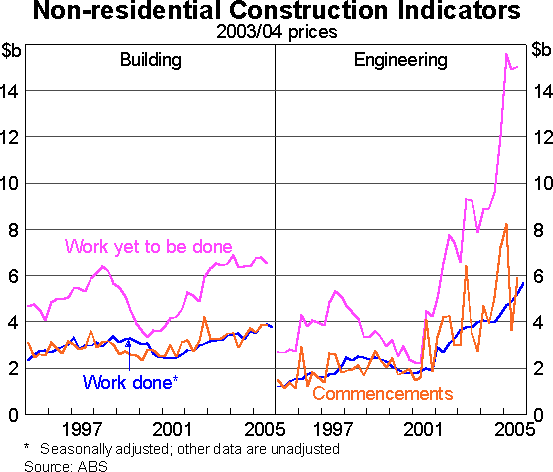
Furthermore, a range of indicators suggest that investment should remain strong for some time. We can see this in the Access Economics survey on major projects that have been committed to, or that are under consideration. We can also see it in the high levels of work yet to be done in building and engineering construction projects that have already been commenced. And our liaison program has highlighted that large resource projects typically have long lead times for planning, and that the timing of projects is sometimes dependent on the timing of projects being undertaken by other firms. This reflects constraints on the availability of resources, particularly in terms of the supply of complex machinery and equipment, and of skilled labour. All this points to the likelihood of ongoing strength in investment in the resources area, which will result in welcome additions to export capacity.
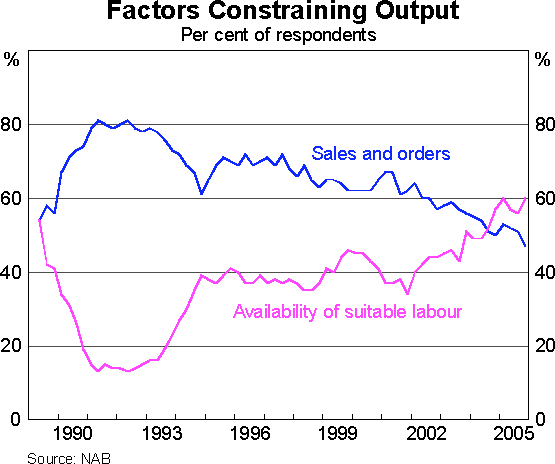
The strength in investment is not surprising given that survey responses suggest that capacity utilisation in the non-farm economy is at very high levels. Another area where there are capacity concerns is the labour market. Historically, when firms have been asked what is the major factor constraining their output, they have responded that it is a lack of orders or demand. However, since the late 1990s there has been a gradual decline in the importance of this constraint. Indeed, for the past year and a half, firms have reported that a lack of suitable labour has actually been a more binding constraint than their order book.
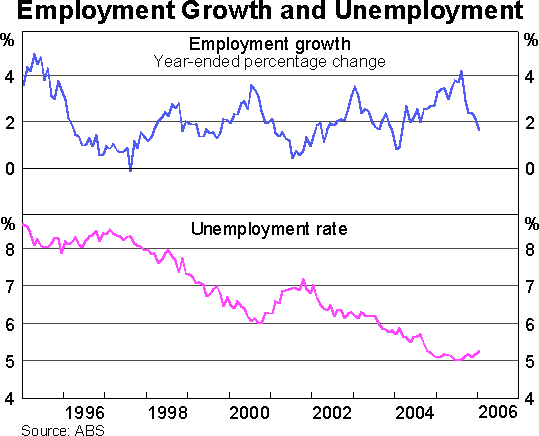
These survey responses are not that surprising given that the unemployment rate, which is around 5¼ per cent, is near its lowest levels since the 1970s. Admittedly, there is some evidence of a recent easing in conditions in the labour market. The unemployment rate is no longer falling, and indeed has ticked up in recent months. However, this is probably best regarded as a pause in growth following a period when some of the indicators suggested very strong growth. Overall, with the unemployment rate low and the vacancy rate high, the labour market remains tight.
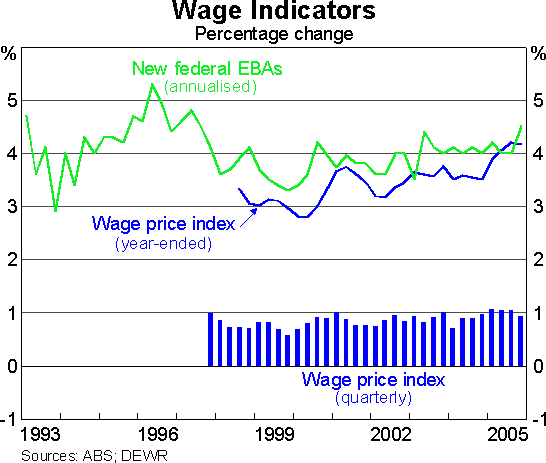
Given conditions in the labour market, we would expect wage outcomes to remain firm. There are several different indicators of growth in wages, and we noted in a Box in our recent Statement that they tended to suggest that wage growth over the year to the September quarter was running somewhat above the average rates seen in recent years. This would suggest that labour costs may be adding to inflation pressures. Since the Statement, the major indicators of wages growth have become available for the December quarter. They suggest that wages growth has remained firm, although there is little evidence that it is accelerating.
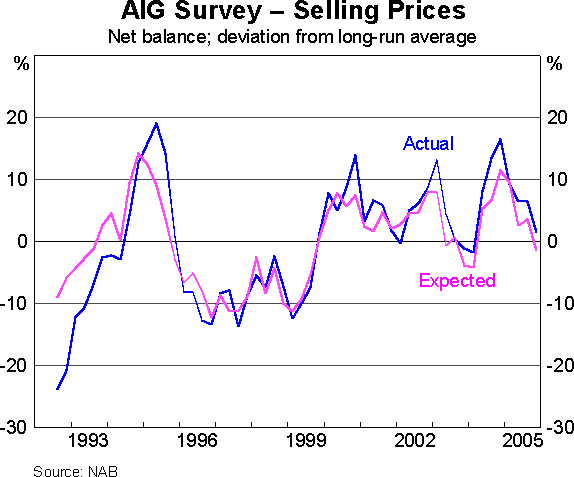
So the inflation outlook is as spelled out in the recent Statement on Monetary Policy, with underlying inflation expected to increase modestly to around 2¾ per cent by the end of this year. This forecast is based on the expectation of continuing cost pressures from firm growth in wages and in raw materials prices. It also takes into account the offsetting influences from global disinflationary pressures on the prices of manufactures and some tradable services. This reflects the higher degree of international competition, most notably from China and other emerging economies. As the Bank said in the Statement, the integration of low-cost producers into the world economy seems to have a long way to run. Indeed, it is likely that this is one of the reasons why underlying inflation has remained relatively contained in recent quarters. One possible manifestation of this impact is in the AIG survey of the manufacturing sector which suggests the absence of any substantial inflation pressures in manufacturing.
In summary, the world economy is growing strongly, presenting a benign backdrop for the Australian economy. With strong investment growth and a forecast improvement in exports, we expect overall GDP growth of 3 per cent or a little more over the next year or so. Furthermore, we should see more balanced growth, with growth of domestic spending expected to be more in line with that of production, which should assist prospects for sustainable expansion.