Speech Australia's Strong Productivity Growth: Will it be Sustained?
Introduction
Good morning. When CEDA approached me about speaking today, I was asked to concentrate on longer-term developments that will have a bearing on Australia's future economic performance.
Such an offer seemed hard to refuse, and so I looked around for a topic on which I could hopefully say something of interest. Given the impressive productivity growth that has been experienced over the past decade, I thought it would be useful to address the question: will this strong productivity performance be sustained?
At the outset I should point out that, in addressing this question, I am interested in prospective productivity developments over, say, the next decade rather than the next year or so. Furthermore, I am going to concentrate on productivity rather than economic growth. That is, I will not have anything to say about the demographic transition that is currently underway which will reduce labour force growth over coming decades and thereby reduce the trend rate of economic growth for any given rate of productivity growth.[2]
Before delving into the details, let me remind you what it is that productivity statistics seek to measure. The two most commonly discussed measures of productivity are labour and multifactor productivity. Labour productivity is a measure of the amount of output that can be produced for given labour input, that is, per hour of work. Multifactor productivity, on the other hand, measures the amount of output that can be produced keeping all inputs (usually capital and labour) in fixed supply. So growth in productivity is a measure of the extent to which more output can be produced with the same inputs.
The Story of the 1990s
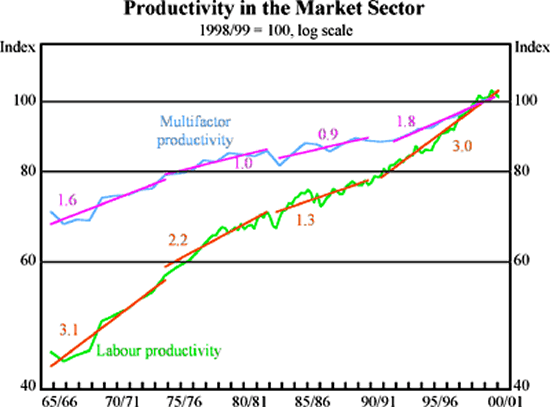
After two previous decades of fairly mediocre performance, Australia experienced a resurgence of productivity growth in the 1990s. Graph 1 shows trend rates of growth of both labour and multifactor productivity during economic expansions over the past three decades in the market sector of the economy. Since the trough of the early 1990s recession in mid 1991, both labour and multifactor productivity have been growing at rates that have not been seen since the 1960s.
Notes: The market sector, which makes up about two-thirds of the economy, excludes those industries for which output is derived directly from inputs. Trend rates of growth are shown over economic expansions, to control for the cyclical nature of productivity growth. The graph is an updated version of a graph in Gruen and Stevens (2000).
Although the pick up in the rate of productivity growth in the 1990s might seem quite modest, small changes in annual productivity growth can make a big difference to living standards if they are sustained for extended periods.
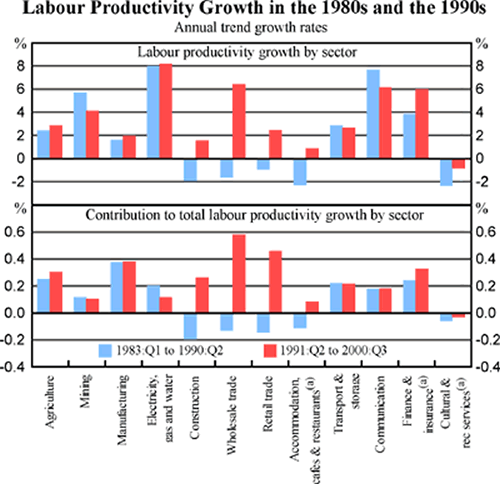
We can look behind these aggregate data, to ask which sectors have made the main contribution to the pick-up in productivity growth. Graph 2 shows a comparison of labour productivity growth across the sectors of the market economy in both the current economic expansion and the previous one in the 1980s. The top panel of the graph shows rates of productivity growth by sector, while the bottom panel shows the contribution that each sector made to the overall rate of labour productivity growth in the market sector of the economy.
Note: (a) Due to data limitations, labour productivity growth in these sectors over the 1980s expansion is calculated from 1984:Q4, not 1983:Q1.
Several sectors experienced rapid productivity growth in both the 1980s and 1990s expansions, including utilities (electricity, gas and water), communications and mining. But since these sectors experienced strong productivity growth in both decades, they clearly contributed very little to the pick-up in productivity growth between the two decades. Instead, the sectors which made the largest contribution to this pick-up were the non-traded sectors of wholesale trade, retail trade and construction. Together these sectors accounted for more than 100 per cent of the pick-up in market-sector labour productivity growth between the two decades, despite contributing only 40 per cent of the hours worked in the market sector.
Why has productivity growth in Australia been so strong over the past decade? Many commentators have suggested that this much-improved performance has been a consequence of the broad range of microeconomic reforms that have been implemented since the 1970s. While it is not possible to draw a direct link between particular reforms and the economy-wide improvement in productivity, the timing of the productivity acceleration is at least suggestive that it was a consequence of microeconomic reform.[3]
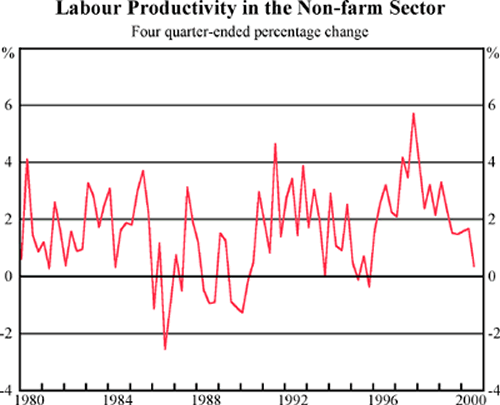
As well as examining averages over a decade or so, we can also look at the evolution of productivity from year to year. Graph 3 shows labour productivity growth over the past twenty years, for the aggregate (non-farm) economy. There were two periods of particularly strong labour productivity growth in the 1990s – for a few years early in the decade as the economy recovered from recession, and again for a few years late in the decade.
Will this strong productivity growth be sustained?
Over the past year or two, however, productivity growth has slowed quite considerably. This has led a few commentators to argue that the beneficial effects of past microeconomic reforms are beginning to wane, and that the days of strong productivity growth in Australia are numbered.
I would like to take issue with this argument from a couple of different perspectives.
To begin with, these productivity numbers bounce around quite a bit, and so we should not draw too confident a conclusion from the productivity performance of the past year or so. After all, when output growth slowed briefly in the mid 1990s, this was associated with quite a pronounced fall in productivity growth at that time. As events turned out, however, this fall in productivity growth was not a harbinger of things to come, but instead a short-lived blip in the statistics.
A more important point, however, relates to timing. In most cases, well-executed microeconomic reform should enhance productivity growth. But for how long should the enhancement last? Should productivity growth be stronger for a couple of years, or for much longer than that? We do not have very good answers to these questions. My hunch is that, for some reforms, productivity growth may be enhanced for a long time.
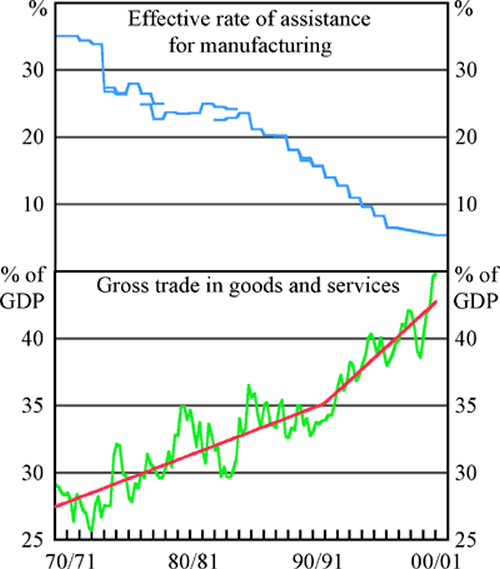
Let me illustrate this point with one of the more significant microeconomic reforms over the past three decades, the fall in barriers to international trade. Graph 4 (upper panel) shows the Productivity Commission's estimates of the effective rate of assistance to manufacturing since the late 1960s. There has been a fairly continuous fall in the effective rate of assistance to manufacturing, from fairly high rates of assistance in the early 1970s, to very low rates by the year 2001.[4]
One of the important ways in which lower protection affects the structure of the economy is by increasing its openness to trade. As trade barriers come down, both imports and exports rise. If we look at the extent of Australia's trade openness over the past few decades, we do see that the economy has become much more open as trade protection has fallen (graph 4, lower panel).
But let me draw your attention to an interesting feature of this graph. There is no close relationship between the timing of falls in protection and rises in trade share. Effective rates of assistance in manufacturing fell significantly, and more or less continuously, for a long time before the 1990s.[5] Despite this long period of falling assistance, the economy opened up gradually in the 1970s and 1980s, but quite a lot more rapidly since then.[6] Notes: Data on the effective rate of assistance for manufacturing are from the Productivity Commission. Breaks in the series reflect the effects of periodic revisions to industry inputs and outputs. Gross trade in goods and services is the sum of exports and imports as a ratio of GDP, in nominal terms.
I don't want to argue that falling domestic protection was the only influence at work here. Lower transport costs and falling protection in overseas markets would also have been contributing to Australia's rising openness to trade. But it does seem that the gradual decline in domestic protection took a long time to have a big effect on the openness of the economy. Eventually, however, the cumulative effect of a long period of gradually falling protection, combined with the changes in behaviour that this helped to bring about, did have a big effect on the openness of the economy. And furthermore, this process of the economy rapidly opening up is continuing apace, if we can take the latest data as a guide.
How do these observations relate to Australia's prospective productivity growth over the next ten years or so? Openness to trade is one of the important drivers of productivity growth. This is especially so for small economies, since as well as aiding the process of technology transfer to the domestic economy, trade can substitute to some extent for a lack of large internal markets that foster competition and allow economies of scale to be exploited.[7]
How quickly should the increased openness translate into faster productivity growth? Well again, I would not be too confident that we understand the timing here, but my suspicion is that the rapid, and continuing, opening up of the economy over the past decade or so will be good for productivity growth for some time to come.
One place you might expect to see this strong productivity growth is in the manufacturing sector itself. Declining protection has had a profound impact on this sector. Its export orientation, for example, has changed radically in twenty years, with exports rising from about 6 per cent of manufacturing output in 1980 to around 30 per cent by 2000. Despite this sea-change in the export orientation of this sector, however, labour productivity growth in manufacturing was only marginally stronger in the 1990s than it was in the 1980s (see Graph 2).
It would not be surprising to see a stronger productivity performance from this sector over the coming decade.
What about the ‘new economy’? If we are interested in prospective developments in Australian productivity over the next ten years or so, ‘new-economy’ developments are also worth thinking about.
The collapse of prices on the United States' Nasdaq stock exchange since last March has rather dampened enthusiasm for the new economy. But widespread misperceptions of the likely potential earnings of companies in the technology sector — which seem to have been responsible for some of the earlier run-up in share prices — should not be confused with the capacity of the new economy to enhance the economy's productive potential. Many new-economy developments, like the internet, reduce search costs and enhance competition, which is likely to be good for productivity, but not necessarily for the earnings of the companies involved.
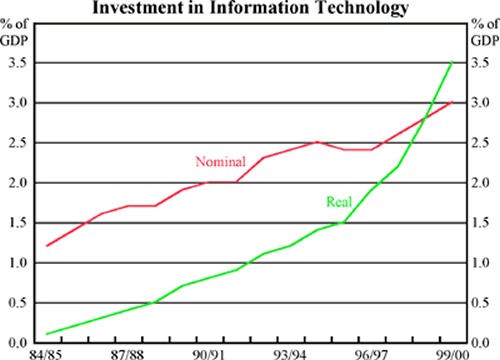
But are the gains from the new economy being captured by the mostly foreign companies at the forefront of these technological advances, or are they being shared with the users of this technology? While many companies are clearly making significant monopoly profits, users are also benefiting. After all, the rapid fall in prices for computers and computer-related equipment is a measure of the extent to which users are benefiting from the strong productivity growth being generated in the production of these goods.
To illustrate this point, graph 5 shows nominal and real investment shares in Australia for information technology (hardware and software) since the mid 1980s. Nominal investment shares have been rising steadily, but fairly gradually, over this time. But the rapid declines in price for information-technology products, both software and hardware, have translated into very rapid increases in real investment shares. Over time, a dollar of expenditure has purchased a rapidly rising quantity of these products.
Note: Real investment is chain-weighted, based in 1998/99 prices.
How much has this rapid rise in real information-technology investment contributed to labour productivity growth in the 1990s? We can estimate this contribution using the growth-accounting approach that was applied to the United States in a much-cited paper by Stephen Oliner and Daniel Sichel (2000) from the Federal Reserve Board. Table 1 presents a comparison of results for the Australian market sector with Oliner and Sichel's results for the comparable United States non-farm business sector.[8]
Labour productivity growth in the Australian market sector has been very strong in the 1990s – significantly stronger than in the United States. Since Australia produces very few information technology products, the productivity benefit that these products bring to the economy arises, in this growth-accounting framework, from the boost to the productive capital stock that they provide – that is, their role in ‘capital-deepening’.[9]
| Australia Market sector |
United States Non-farm business sector |
|||
|---|---|---|---|---|
| 1991-95 | 1996-99 | 1991-95 | 1996-99 | |
| Annual labour productivity growth | 2.1 | 4.1 | 1.5 | 2.6 |
| Contribution from | ||||
| Information technology | 0.9 | 1.3 | 0.5 | 1.0 |
| Hardware | 0.4 | 0.8 | 0.2 | 0.6 |
| Software | 0.5 | 0.5 | 0.2 | 0.3 |
| Communications | na | na | 0.1 | 0.1 |
| Other capital | 0.4 | 0.6 | 0.1 | 0.1 |
| Labour quality | na | na | 0.4 | 0.3 |
| Multifactor productivity growth | 0.8 | 2.2 | 0.5 | 1.2 |
| Income shares | ||||
| Hardware | 2.0 | 2.5 | 1.4 | 1.8 |
| Software | 2.5 | 2.7 | 2.0 | 2.5 |
| Communications | na | na | 1.9 | 2.0 |
| Other capital | 36.2 | 35.8 | 26.8 | 26.7 |
| Labour | 59.3 | 59.0 | 67.9 | 66.9 |
| Annual growth rates of inputs | ||||
| Hardware | 21.2 | 32.6 | 17.5 | 35.9 |
| Software | 20.4 | 17.0 | 13.1 | 13.0 |
| Communications | na | na | 3.6 | 7.2 |
| Other capital | 1.1 | 2.5 | 1.6 | 2.8 |
| Labour | −0.1 | 0.7 | 1.2 | 2.2 |
| Notes: The contribution from the ‘communications’ capital stock in Australia is included in the ‘other’ category, and there is no adjustment for labour quality. The time periods shown are those used by Oliner and Sichel. Australian results are from Simon (forthcoming); US results from Oliner and Sichel (2000). | ||||
The results in Table 1 should be treated with some caution, because the assumptions that underlie them are in some ways fairly heroic. Comparisons between countries are also hampered by unavoidable differences in methodology, so I would treat with some suspicion the result that the capital deepening from information technology has contributed more to labour productivity in Australia than the United States.[10]
Nevertheless, the numbers do suggest that investment in information technology has contributed quite a lot to Australian labour productivity growth in the 1990s. Indeed, growth in IT capital appears to have contributed more to labour productivity growth in the 1990s than other capital – a statement that is also true for the United States. Furthermore, the contribution of IT capital appears to have been getting somewhat stronger over the course of the decade. In thinking about productivity over the coming decade, we should expect that a continuation of these rates of investment in information technology should generate further significant contributions to growth in labour productivity.
Let me conclude this rather brief foray into the new economy by admitting that this growth-accounting exercise might seem rather far-fetched to those with a practical bent, relying as it does on smooth ‘production functions’ to describe how inputs of labour and various types of capital are combined to produce output.
So, it is perhaps as well to supplement these results with a concrete example of information technology making a significant contribution to productivity. Such an example would not be hard to find in a technology-intensive sector like communications, but let me instead give you an example from a rather more prosaic sector: the wholesale trade sector.
Wholesale trade made the largest contribution to the market-sector's strong labour productivity growth over the 1990s. This was partly because wholesale trade is a relatively large sector, but also because it experienced strong labour productivity growth (Graph 2). Interestingly, computer-based technologies appear to have contributed significantly to this improved performance.
For example, barcoding and scanning of products, initially introduced by grocery retailers, became widespread in the wholesale trade sector in the 1990s. By enabling accurate electronic records to be kept of products all along the supply chain, this technology has reduced inventory levels, the number of times goods need to be handled, as well as the response times of wholesalers to the demands of their customers. In turn, this innovation has led to others, including warehouses which operate with paperless ordering systems, and warehouse management systems which manage all facets of the content of warehouses, including the age of stock, use-by dates, etc. (Johnston, et.al., 2000).
While barcodes and scanners may now seem too passé to be classified as part of the new economy, it is not hard to imagine that the significant and increasing share of real investment in products like these will have a continuing noticeable effect on productivity growth in the years ahead.
Conclusion
I started my talk this morning by posing the question: Will Australia's strong productivity growth be sustained?
Well, by now you can tell that I haven't answered the question.
Of the myriad of influences that will undoubtedly affect Australia's productivity growth over the next decade or so, I have confined myself to a discussion of only a couple of them.
Rather than present a broad overview, my aim has been to look at a just a few notable developments that may be significant drivers of Australia's productivity growth in the years to come.
Only time will tell how important they will turn out to be. I hope, however, that I have convinced you that there are some grounds for optimism about productivity growth in Australia over the coming decade.
Endnotes
I am very grateful to Adam Cagliarini and John Simon for their help in preparing this paper. [1]
For discussion of this demographic transition, and its implications for economic growth, see Commonwealth Treasury (2000). [2]
Many of the contributors to the Reserve Bank volume, The Australian Economy in the 1990s, came to this conclusion, although it was not unanimous (see John Quiggin for an alternative view). [3]
Manufacturing is not, of course, the only sector to have received assistance, but it and agriculture are the only sectors for which there are long runs of data on effective assistance. I focus on changes to manufacturing assistance because manufacturing accounts for about 12 per cent of the economy's output, compared to 3 per cent for agriculture, and so changes to manufacturing assistance should have a corresponding larger aggregate impact. Furthermore, imports of manufactures account for ⅔ of Australia's imports of goods and services, so distortions in manufactured-goods prices are likely to have implications for productivity across the wide range of the economy that uses imported manufacturing inputs. [4]
One could date the beginning of the significant falls in protection to the 25 per cent tariff cut in 1973. Over the following decade, effective rates of assistance to manufacturing continued to fall, but mainly due to changes in industry composition within the manufacturing sector. Since 1983/84, the continuous falls in effective rates of assistance to manufacturing have been dominated by declining rates of assistance across the whole manufacturing sector (see Productivity Commission (2000), p 12). [5]
The graph shows the line of best fit allowing for a one-off change in slope, which occurs in 1991:Q3. Before then, the gross trade share of GDP rose by an average of 0.4 per cent each year, compared to 0.8 per cent since then. [6]
As usual in economics, the empirical evidence is not definitive. There remains a debate about whether openness causes productivity growth or vice versa. Nevertheless, recent evidence is suggestive both that openness causes growth and that the effect is quantitatively important (see, e.g., Dowrick (1994), Frankel and Romer (1999), Ahn and Hemmings (2000)). [7]
Two previous authors, Wilson (2000) and Toohey (2000) have applied the Oliner-Sichel approach to Australian data. They use estimates of the ‘wealth’ capital stock of information technology products rather than the conceptually more appropriate ‘productive’ capital stock used here. (The wealth capital stock measures the current market value of the stock of capital assets, whereas the productive stock measures their productive capacity. Since computers fall in value very rapidly, but remain quite productive while in use, these two measures are fairly different. See Oliner and Sichel, p.6, for further discussion.) The results presented here use unpublished ABS estimates of the gross rental payments to the various types of capital, rather than imputing these returns from aggregate data, as was done previously. The results here imply a significantly larger contribution to Australian productivity growth from information technology than the previous two sets of results. [8]
In contrast to Australia, the United States has also benefited significantly as a producer of information technology. Oliner and Sichel also estimate the direct contribution to US productivity growth provided by rapid productivity growth in the production of information-technology products. While this direct contribution is significant, they estimate that it has been smaller than the contribution made by the boost to the productive capital stock provided by the installation of these products in the wider economy shown in Table 1. [9]
For example, Oliner and Sichel's results do not incorporate those revisions to the US National Accounts that were released shortly before publication of their paper in November 2000. They explain that, had these revisions been incorporated, the contribution of information technology capital to growth would have been ‘slightly greater’ than the results they report, which are reproduced in Table 1. The Australian results use the latest vintage of data, based on the annual Australian National Accounts released in November 2000. [10]
References
Ahn S and P Hemmings (2000), ‘Policy Influences on Economic Growth in OECD Countries: an Evaluation of the Evidence’, OECD Economics Department Working Papers No 246.
Commonwealth Treasury (2000), ‘Demographic Influences on Long-term Economic Growth in Australia’, Economic Roundup, No 9.
Gruen D and G Stevens (2000), ‘Australian Macroeconomic Performance and Policies in the 1990s’ in D Gruen and S Shrestha (eds), The Australian Economy in the 1990s, Proceedings of a Conference, Reserve Bank of Australia, Sydney, pp 32–72.
Dowrick S (1994), ‘Openness and Growth’ in P Lowe and J Dwyer (eds), International Integration of the Australian Economy, Proceedings of a Conference, Reserve Bank of Australia, Sydney, pp 9–41.
Frankel JA and D Romer (1999), ‘Does Trade Cause Growth?’, The American Economic Review, 89(3), pp 379–399.
Johnston A, D Porter, T Cobbold and R Dolamore (2000), ‘Productivity in Australia's Wholesale and Retail Trade’, Productivity Commission Staff Research Paper, Aus Info, Canberra.
Oliner SD and DE Sichel (2000), ‘The Resurgence of Growth in the Late 1990s: is Information Technology the Story?’, The Journal of Economic Perspectives, 14(4), pp 3–22.
Productivity Commission (2000), Trade & Assistance Review 1999-2000, Annual Report Series 1999-2000, AusInfo, Canberra.
Simon J (2001), ‘Australian use of information technology and its contribution to growth’, Reserve Bank of Australia (forthcoming).
Toohey T (2000), ‘Information Technology and Productivity’, ANZ Economic Outlook, October, pp 17–19.
Wilson D (2000), ‘Australian Productivity: Catching a “New Economy” Wave’, Global Economics Paper No. 50, Goldman Sachs & Co, New York.
