Speech Living in a Low Inflation Environment: Implications for Business and Labour

Ian Macfarlane
Deputy Governor
Talk to the Securities Institute of Australia (New South Wales Division)
Sydney –
Introduction
I was pleased to be invited to speak by the Securities Institute of Australia, and even more pleased that I was asked to speak about how Australia should adjust to low inflation. The implication behind the request was that the Institute felt that a number of people had been slow to make the adjustment, and there was even a hint that some of its members might be among them. If that is the case, it is a tribute to the Institute that they have organised today's meeting to look at this issue.
I will start with some material I have used before which summarises the state of inflation in the world and in Australia, then I will move on to talk about the implications of this for security analysts, employers and employees.
The Low Inflation Environment
The World
You are all familiar with the fact that inflation in the OECD area is now lower than at any time since the early 1960s. Furthermore, even though we are well into the expansionary phase of the international business cycle in most countries, there does not seem to be any tendency for inflation to rise. Table 1 shows inflation in OECD countries over the past five years and over the past year. As you can see, inflation is quite low over both of these time-frames, but the figures for the past year are lower than over the past five years, suggesting that inflation is, if anything, still trending down.
| Past 5 Years | Latest | |
|---|---|---|
| Australia | 2.5 | 3.3 |
| Austria | 3.3 | 2.1 |
| Belgium | 2.1 | 2.2 |
| Canada | 1.9 | 1.5 |
| Denmark | 2.1 | 1.8 |
| Finland | 2.2 | 1.2 |
| France | 2.3 | 2.7 |
| Germany | 3.4 | 1.8 |
| Italy | 4.9 | 5.6 |
| Japan | 1.0 | 0.2 |
| Netherlands | 3.0 | 2.2 |
| New Zealand | 1.6 | 2.1 |
| Norway | 2.1 | 1.1 |
| Portugal | 8.4 | 4.1 |
| Spain | 5.2 | 3.8 |
| Sweden | 2.7 | 1.5 |
| Switzerland | 2.8 | 1.2 |
| United Kingdom | 3.2 | 2.8 |
| United States | 3.2 | 2.7 |
| Average | 2.9 | 2.4 |
I would summarise the current situation as being one where we live in a 2 to 3 per cent world. That, not entirely coincidentally, also summarises Australia's inflation target, which both the Reserve Bank and the Government are committed to achieving. That figure of 2 to 3 per cent is also the one I believe people should put into any of their forward-looking calculations when doing any financial analysis or planning.
The growth of wages shows a similar picture. As you know, wages growth can only exceed inflation by an amount equal to the increase in labour productivity if inflation is to remain low. This has put a pretty firm upper limit on how far wages have been able to grow in the OECD area. At present, I am not aware of any major OECD country which sees its inflation performance being threatened by an upsurge in wages.
| Past 5 Years | Latest | |
|---|---|---|
| Australia | 3.4 | 4.2 |
| Austria | 4.3 | 4.3 |
| Belgium | 3.4 | 1.6 |
| Canada | 2.1 | 0.7 |
| Denmark | 3.1 | 3.0 |
| Finland | 5.2 | 5.7 |
| France | 2.4 | 2.6 |
| Germany | 4.2 | 2.0 |
| Italy | 4.6 | 4.3 |
| Japan | 1.9 | 1.6 |
| Netherlands | 3.1 | 2.8 |
| New Zealand | 1.8 | 3.2 |
| Norway | 2.7 | 3.2 |
| Portugal | 9.0 | 6.2 |
| Spain | 6.3 | 3.6 |
| Sweden | 4.4 | 5.1 |
| Switzerland | 2.3 | 1.5 |
| United Kingdom | 4.3 | 3.8 |
| United States | 2.7 | 3.4 |
| Average | 3.1 | 2.9 |
There are a couple of other points worth making about the world inflation environment.
- The first concerns the competitive pressures being exerted by world trade. It is a well-established fact that over time import and export prices rise more slowly than domestic prices. This is because the most productive parts of the economy are the ones that move into international trade, and productivity keeps increasing due to the constant pressure from international competitors. In Table 1, the average inflation rate for OECD countries over the past five years was 2.9 per cent, but the average increase in their export prices was 0.7 per cent, and import prices fell by 0.5 per cent per annum. It is these latter two price indices that our exporting and import-competing firms have to match.
- Another point concerns Asian inflation compared with OECD area inflation. It is true that inflation rates in Asia are higher than in Europe and North America, but the difference is not as big as it first appears to be. The Asian countries with relatively high inflation are mainly the ones whose cost structures are a long way below Australia's, such as China, Indonesia and the Philippines. The ones that are closer to our standard of living and cost structure – and hence the ones our industries are most likely to compete with – have much lower inflation. For example, Japan has 0.2 per cent, Singapore 1.1 per cent, Taiwan 2.8 per cent, Malaysia 3.6 per cent, and Korea 4.6 per cent. In addition, export prices for those countries are a lot lower than their domestic prices which are held up by the mediocre productivity performance of their non-traded sectors.
Australia
Underlying inflation in Australia has averaged 2.5 per cent per annum over the past five years. (For those who are still not comfortable with the concept of underlying inflation, headline inflation has averaged 2.4 per cent per annum over the same period.) Over the past year – that is, in the four quarters to the March quarter – underlying inflation was 3.3 per cent. This looks a bit high compared to the five-year average of 2½ per cent and compared to our medium-term aim of averaging somewhere between 2 and 3 per cent. It is also higher than most of the OECD countries shown in Table 1. It would be a concern to us if we thought that inflation was going to stay at 3.3 per cent, or worse still, go higher. However, this is not our assessment, and we are reasonably confident that inflation will return to 2-point-something per cent by the September quarter. Why do we think this will be the case?
- The first reason is clear from the pattern of quarterly CPIs (Graph 1). The reason the 12-months-ended growth rate is as high as 3.3 per cent is that it is still reflecting two big increases in June and September 1995 (1 per cent and 1.2 per cent respectively). These rises were partly a lagged response to the rapid economic growth of 1994 and partly reflected increased sales taxes on cars introduced in May and on other taxable goods from July. These large quarterly increases will drop out by the time we get the September CPI. The two most recent quarterly increases were 0.7 per cent in December and 0.4 per cent in March. Even if prices rise at the higher of these two figures in coming quarters, the 12-months-ended increase in underlying inflation should come back to somewhere around 2½ per cent in the second half of this year.
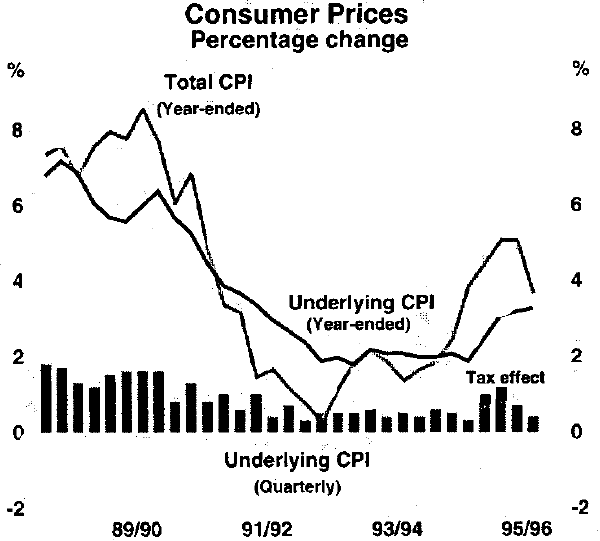
- An important influence on inflation is what is happening to the exchange rate. The rise in the Australian dollar from US70 cents in June 1995 to US79 cents at present should significantly reduce inflation when its full effect has come through. To date, we have only seen part of this effect and more should show up in subsequent quarters.
-
The CPI (either underlying or headline) is not the only measure of inflation, nor
is it the most up to date. In order to get a better impression of trends in
inflation, we should look at all the available price indices. When this is
done, it is clear that the other measures give a lower picture than the CPI.
For example:
- the quarterly deflators from the National Accounts (shown in Table 3) show increases of between 2 per cent and 2.5 per cent over the 12 months to March;
- the various measures of manufacturing prices show movements over the past 12 months of between −0.8 per cent and +1 per cent. The prices of domestically-produced intermediate and final goods, which are probably most relevant for the type of analysis contained later in this paper, have grown by half a per cent over the past year; and
- partial indices such as those for construction materials show an essentially flat picture and those for import prices are falling.
Putting all this information together suggests that the annual inflation rate should fall over the remainder of 1996. It would be simple if that was the end of the story, but it is not. We have to take a view about what is going to happen next year, and, of course, it gets a little murkier when you look further ahead. Over this longer horizon, what happens to wages will have an important influence, and I will return to this aspect later in the talk.
| Latest observation | Rate of increase over past year | Rate of increase over past three months | |
|---|---|---|---|
| Broad measures | |||
| Consumer Price Index | Mar 1996 | 3.7 | 0.4 |
| Treasury underlying measure | Mar 1996 | 3.3 | 0.4 |
| GDP deflator | Mar 1996 | 2.5 | 0.5 |
| Private final demand deflator | Mar 1996 | 2.0 | 0.3 |
| Private consumption deflator | Mar 1996 | 2.5 | 0.6 |
| Manufacturing prices | |||
| Raw material inputs | Apr 1996 | −4.8 | −2.9 |
| Domestically-produced intermediate goods | Apr 1996 | 0.4 | −0.3 |
| Domestically-produced final goods | Apr 1996 | 0.5 | 0.1 |
| Intermediate imported goods | Apr 1996 | −1.1 | −2.7 |
| Final imported goods | Apr 1996 | −8.3 | −2.9 |
| Construction prices | |||
| House building materials | Apr 1996 | −0.9 | −0.3 |
| Other building materials | Apr 1996 | 1.3 | 0.0 |
| Import prices | |||
| Import price index | Apr 1996 | −2.3 | −2.5 |
| Imported items in the CPI | Mar 1996 | 0.9 | −0.1 |
Implications of Low Inflation
This subject is too broad to cover in detail, so I will confine myself to one aspect that is of current relevance. There has been a lot of attention given so far in 1996 to the slowing in the Australian economy, notwithstanding the mix of strong and weak figures from the Australian Bureau of Statistics. There is a widespread feeling that shows up in most of the surveys of business people that ‘business is tough’ and that there is not much growth around. Another common sign is the frequent stories in the financial press about profit downgrades for public companies. It is this latter subject I would like to examine in more detail because I think it tells us something about how we are adjusting to low inflation.
I believe that there are two aspects of the profit downgrades; the first aspect is largely a move to more realistic figures compared with earlier excessively optimistic ones, and the second aspect is a genuine cost-price squeeze, particularly in the manufacturing sector. The first aspect – which I will call the return to reality – has implications for security analysts and fund managers, while the second has implications for all businesses and workforces.
The Return to Reality
Over the past five years, there has been a tendency among security analysts, and among companies themselves, to expect big increases in company profits each year. While I applaud this optimism insofar as it contributes to increased investment, I think some of it has been overdone. A lot of the downward revisions to profit forecasts we are now seeing reflect the realisation that large increases in profits year after year are not really plausible.
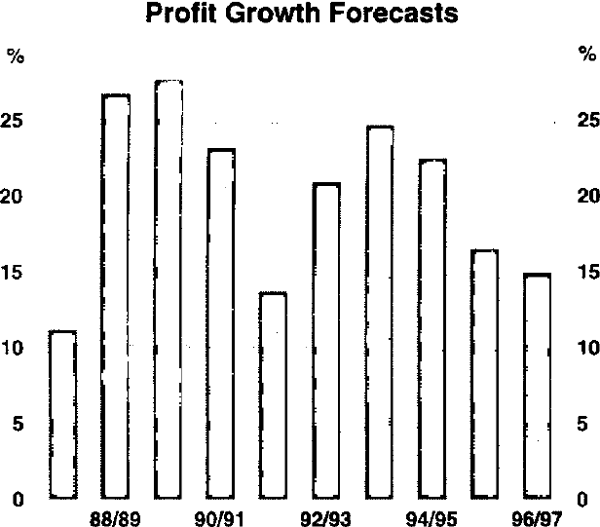
I would like to illustrate my contention that profit forecasts have tended to be too high by making use of the aggregate data that is compiled by Barcep. Graph 2 shows the estimate of profit growth in the coming year for the 10 years from 1987/88 to 1996/97. The average growth rate is 19.5[1] per cent per annum, which seems quite high by any standard. Of more importance for current purposes, the forecasts over recent years seem to be too high for two reasons.
- There seems to be no recognition of lower inflation in the latter part of the period. The average increase expected in the most recent four years was also over 19 per cent, almost the same as over the whole decade.
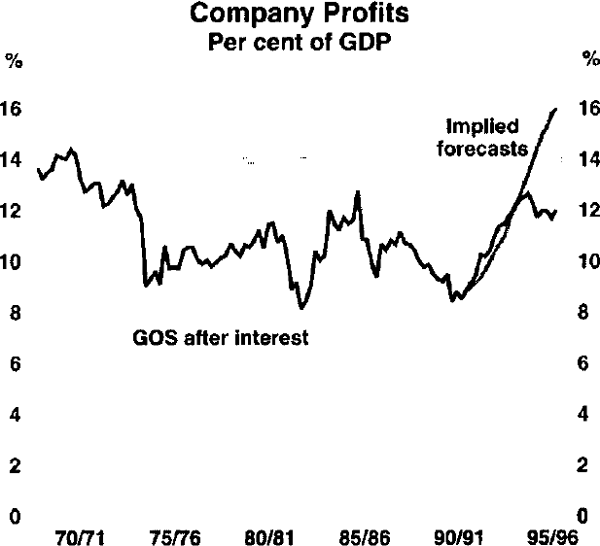
- If company profits had risen at over 19 per cent per annum over the past four years, which is a period when nominal GDP was rising by 5.7 per cent per annum, it would imply an implausibly high level for the profit share of GDP[2] at the end of the period. In fact, it would imply profits rising to 16 per cent of GDP, which is higher than any previous observation (see Graph 3).
For these reasons, we believe that profit forecasts over the past few years have contained a systematic upward bias and that the recent downgrades are, in part, a return to reality. An important reason for the over-prediction of profits was the failure to take into account the fact that all nominal magnitudes, including profits, sales and wages, should grow more slowly in a low inflation environment. Another manifestation of this was the tendency for firms, investors and analysts to want to set excessively high hurdle rates for new investments. Again, lower inflation should be reflected in lower nominal yields of all types. The ‘riskless rate of return’ as proxied by a long government bond has fallen from the 12 to 15 per cent range in the 1980s to the 6 to 10 per cent range over the past few years. Businesses should explicitly lower their hurdle rates of return on equity to reflect this, but there is not much evidence that this has happened.
A Cost-Price Squeeze
The foregoing analysis would, on its own, imply that there is nothing of substance behind the recent profit downgrades, but it is only part of the story. The other – and major – part of the story does contain real substance, and again it says something about how we are adjusting to low inflation.
We often hear the claim from businesses that they no longer have any ‘pricing power’ which means that they have little influence over the price at which they sell their product – the buyers have all the power. It also means that, if an input price goes up, they cannot pass it on to customers by raising their selling price. This is precisely the result we would expect in very competitive markets, particularly where international trade is becoming more important, and where price increases of traded goods around the world are effectively zero, as we saw in the earlier section of this paper.[3]
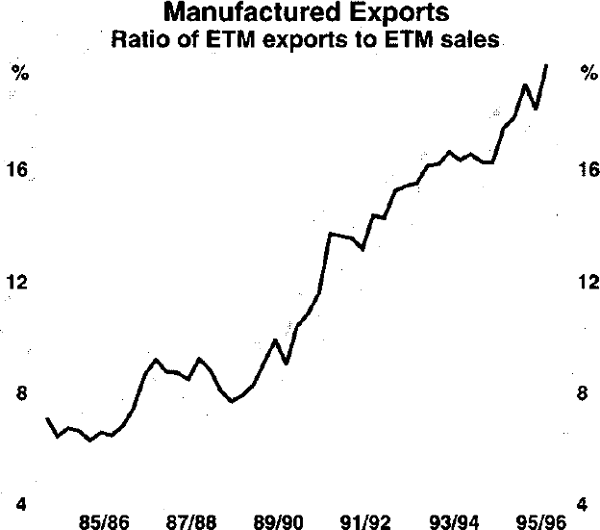
Incidentally, this increase in foreign competition is not just a matter of lower tariffs leading to more imports, it is also because the manufacturing sector is now a significant exporter. Between 1986 and 1995, exports of elaborately-transformed manufactures (ETM) rose at an average annual rate of 15 per cent, and they now represent nearly 20 per cent of manufactures sales compared with about 7 per cent a decade ago. There are also many firms that do not directly export, but are suppliers to exporters. These firms are also constrained in their pricing by the discipline of the international marketplace. In addition, it is also becoming common for multi-national firms to engage in international benchmarking in their purchasing – essentially insisting on international parity pricing of any input regardless of the country of supply. These factors mean that the part of the economy subject to international competitive pressures is much larger than suggested by conventional measures which usually only include those directly engaged in exporting or competing with imports.
This process described above can best be illustrated by looking at the manufacturing sector, for which consistent data are available. As can be seen in Graph 5, manufacturing profits rose from 1992 to mid 1995 even though output prices were constrained. The increase in profits was partly because of the usual cyclical rise in productivity and partly due to wage restraint.
Since mid 1995, however, manufacturing profits have fallen noticeably following the surge in wages over the previous 12 months[4] and slower productivity growth. Why did employers agree to such large wage rises through 1994/95? In part, it may be because they expected further big increases in productivity, but even optimists could hardly expect indefinite gains of 4 to 6 per cent per annum across the sector as a whole. Another explanation is that they expected, as in the past, to be able to pass them on as price rises. A third explanation is that they did not think they had much choice in the matter because they were effectively presented with a demand for two 5 per cent increases over two years as the industry norm.
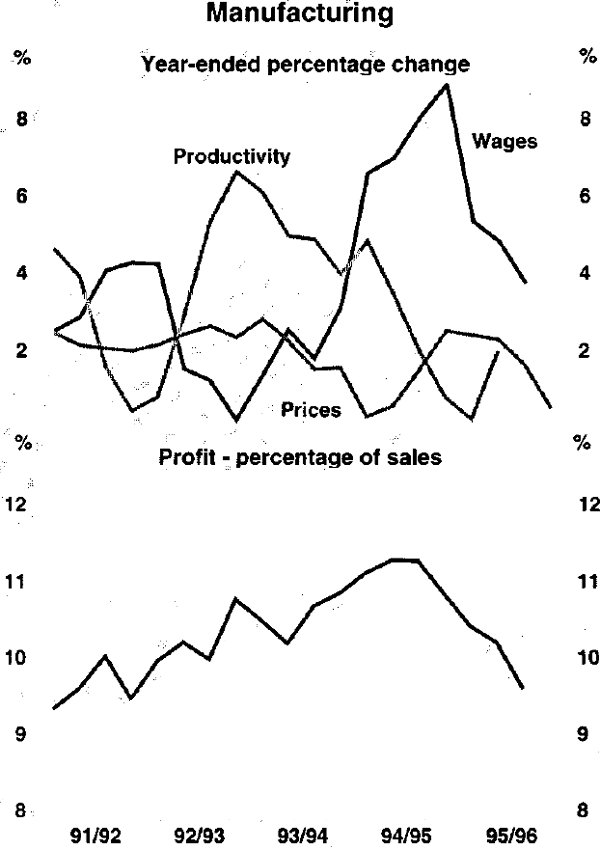
Whatever the reason, they clearly were not able to pass the wage costs on. The annual increase in manufacturers' prices never rose above 2.5 per cent and has now slowed to 0.5 per cent over the past year. Manufacturers, therefore, are in a cost-price squeeze, with their major cost rising by about 5 per cent and their output prices rising by 0.5 per cent. It is not surprising that profits have fallen noticeably over the past year, as has manufacturing employment.
Some people would also point to the influence of a rising Australian dollar in squeezing manufacturing profits. This has no doubt played a role, but it should not be overstated. While the rise over the past year is in our minds, this followed a sharp fall in the previous six months. The trade-weighted index fell from 56.5 in December 1994 to 48.4 in June 1995. It has since risen to 58.3 at present, but this is only a rise of 3.2 per cent over the 18 months since December 1994.
Some Lessons
Obviously the main lesson I would like you to take away is the need for all of us to adjust our thinking to a low inflation world. The sooner we do it, the better for us individually, and the better for the economy. It is possible, indeed likely, for sustained output expansion to co-exist with low inflation if businesses, investors and labour adjust their behaviour to the new environment. If they do not, and cling to the old ways, the consequences could be very damaging – not just for inflation, but even more so for economic growth and employment.
The example above of the cost-price squeeze in manufacturing leading to falling profits and employment is illustrative of large parts of the economy. In a sense, manufacturing is going through a transformation that happened decades (or even a century) ago in agriculture and the resource industries. These latter two sectors have always known that they were ‘price takers’ on the world stage. If their domestic cost structure rose, the principal result was not a rise in Australian inflation, but a contraction of profits, output and employment in those sectors. As the Australian economy becomes more open and domestic competition increases, the more we will see that excessive wage rises lead to unemployment rather than inflation.
This does not mean that we are in a position where large wage rises are no longer any threat to continued low inflation. Clearly, if large wage increases are achieved in the non-traded sector, then some of the resulting cost increases could be passed on into prices. But there are forces at work here too which will exert restraint. The biggest part of the non-traded sector is the government, where wage increases have been quite moderate at about 3¼ per cent over the past year. Also, a large part of the private non-traded sector consists of the small business sector, where the product and labour markets are quite competitive. The only inflation risk comes from those parts of the private non-traded sector where product and labour markets are not very competitive. It is this area where the ‘old approach’ still applies, ie where large wage increases can be passed on to consumers in price increases. That is why monetary policy has to remain vigilant, and why we cannot ever declare victory over inflation.
In the longer run, however, the trends are on the side of low inflation. More and more of the economy becomes open to foreign competition each year, both through trade flows and through the international mobility of direct investment. Within the non-traded sector, competition is also increasing due to product and labour market deregulation, and to the fact that the small business sector is growing faster than large businesses. Finally, central banks around the world have learned the lessons from the 1970s and 1980s and are determined to conduct monetary policy in a way which keeps inflation under control.
Footnotes
It is also possible to obtain a revised estimate that is made during the year in question. This shows a more variable pattern, but still coincidentally averages 19.5 per cent over the 10 years from 1986/87 to 1995/96. [1]
The measure of profits used in this calculation is Gross Operating Surplus of Companies minus Interest. It is not possible to obtain After Tax Profits (the Barcep concept) from the National Accounts. [2]
These influences are covered in more detail in an earlier talk. See ‘Inflation and Productivity’, Reserve Bank of Australia Bulletin, September 1993. [3]
In Graph 5, wages are measured by Average Weekly Ordinary-Time Earnings in Manufacturing. The peak of over 8 per cent in late 1995 is higher than other evidence suggests, but even if the wage increases in productivity agreements (about 5 per cent) were substituted, the story would remain much the same. [4]