Research Discussion Paper – RDP 2023-10 Adoption of Emerging Digital General-purpose Technologies: Determinants and Effects
1. Introduction
Productivity growth is the main driver of living standards over the medium term. However, productivity growth has slowed significantly over recent decades, both in Australia and in other advanced economies, leading to lower economic growth and incomes.
One factor contributing to slower productivity growth in Australia appears to be slower diffusion and adoption of technologies. Adoption and adaptation of technologies and approaches pioneered by other businesses is a key driver of productivity growth. This is particularly the case in Australia, where only a very small share of firms tends to create new-to-world products, technologies or approaches in a given year, whereas 40 to 50 per cent adopt or adapt an existing one to improve their business (DISER 2021; Productivity Commission 2023). However, Australian firms appear to be falling further behind the global productivity frontier over time, suggesting slower diffusion (Andrews et al 2022).
Against this background, it is important to understand in more detail how technologies diffuse, what barriers exist, and what determines whether a firm can profitably use the technology. There is, however, relatively little evidence on these topics, particularly for Australia. For example, several survey-based studies have documented that while adoption of cloud computing technology can be associated with higher profitability, it can also be associated with losses and ultimately abandonment of the technology (Makhlouf 2020; McMillan et al 2022; West 2022). But there is little evidence on what factors could contribute to profitable adoption of technologies. Similarly, several papers have explored the correlates of artificial intelligence/machine learning (AI/ML) adoption or its effects (e.g. Alekseeva et al 2021; Calvino et al 2022; Babina et al 2023, 2024), but there is little evidence on what facilitates profitable adoption.
To provide more evidence on the nature and effects of technology adoption in Australia we construct a new database capturing adoption of cloud computing and AI/ML, two emerging digital general-purpose technologies (GPT), using text from earnings calls and annual reports of listed firms. In particular, we define adoption as the first reference to these technologies in the calls and reports, using a word list developed in earlier work by Bloom et al (2021) to identify references to the technologies.
We focus on these two technologies for several reasons. First, both represent emerging GPT, in that they are ‘generic’ technologies that have the potential to become pervasive and transform business processes and that it will take time from initial introduction for these technologies to mature and for complementary investments to be effectively utilised (Etro 2010; Bayrak, Conley and Wilkie 2011; Crafts 2021). Second, these technologies also have potentially important implications for labour markets. On the one hand, use of these technologies tends to require highly skilled and educated workers, which has the potential to affect demand for skilled labour and could have implications for inequality (Acemoglu and Restrepo 2018; Burgess and Connell 2020; Ellis 2021). On the other hand, AI/ML could provide a complement to lower-skilled workers augmenting their abilities rather than automating them (Agrawal, Gans and Goldfarb 2023b). Third, these technologies are inherently interlinked, with increased computing power provided by cloud computing helping to fuel AI/ML, and many cloud technologies incorporating AI/ML (Loucks 2018).
Using our adoption metric, we find evidence that larger and more liquid firms are more likely to adopt GPT, suggesting that financing frictions and returns to scale could be important barriers to adoption. In part, this could reflect fixed costs in shifting from existing technologies to new technologies. These may be more important for mature, listed companies such as those in our sample, than for smaller or emerging firms. To the extent that our adoption metric is more likely to capture sizeable investments in such technologies, rather than, for example, shifting to a cloud-based version of a software program, this could also help to explain the importance of liquidity.
We also document a surge in adoption of cloud computing technologies across all sectors during the COVID-19 pandemic. However, this appears to have been a one-off spike in adoption with the rate of new firms adopting cloud computing quickly reverting to pre-pandemic levels, despite the fact that a very large share of firms still appear not to have adopted such technologies by the end of our sample in 2022.
We then consider the roles of worker and Board skills in the profitable adoption of these GPT. We find that firms with directors with strong technical backgrounds (experience with relevant technologies) are far more likely to adopt the technologies and to increase their profitability post-adoption. Adopting firms are also more likely to try to hire workers with GPT-related skills, indicating adoption is associated with increased demand for relevant skills. This is consistent with Bahar and Lane's (2022) finding that demand for skills related to cloud computing and AI/ML have increased significantly over the past decade as adoption has increased. The increased demand for skilled workers is particularly evident for firms that have directors with technology experience, which are also more likely to make a profit post-adoption. While it is hard to draw strong causal conclusions, these findings suggest that having sufficiently skilled workers and managers facilitates adoption, and therefore highlights the importance of increasing the availability of relevant skills, for example via education or training.
We also consider whether other director characteristics are associated with a higher probability of profitable adoption. Firms with female representation on the Board are more likely to increase their profitability post-adoption, adding to existing evidence on the benefits of within-firm diversity for firm performance (Gordini and Rancati 2017; EmadEldeen et al 2021) and dynamic capabilities (Wilson et al 2023). However, the magnitude of the effect is smaller, compared to the effect of having Board members with relevant technology experience. Other factors that we were able to explore with the data, such as the educational background of the directors, are not associated with more profitable adoption. That said, given limitations in our data on directors, which are a snapshot as at March 2023, further work exploring these other factors with other data on management could be fruitful.
Finally, we consider whether the nature of adoption may have changed over time. There is a large literature showing that GPT often diffuse slowly over time as complementary inventions or organisational changes facilitate profitable adoption of the GPT (e.g. Agrawal, Gans and Goldfarb 2023a), or as relevant skills become more widely available. Consistent with this, we notice a significant downturn in profitability around the time of adoption for early adopters (2013–2016). Conversely, profitability of late adopters (2017 onwards) is broadly unchanged on average.
This final finding suggests that profitable adoption may have become easier over time, which might mean more scope for effective adoption of these technologies going forward and therefore improved productivity. That said, given the other results in this paper, increasing adoption is still likely to be somewhat dependent on the availability of relevant skills and experience. Moreover, given existing evidence that much of the decline in productivity growth in Australia reflected factors such as declining competitive pressures and dynamism, these issues would also likely still need to be addressed to incentivise adoption (e.g. Andrews et al 2022; Hambur 2023; Hambur and Andrews 2023).
2. Data
2.1 Adoption data
Measuring adoption directly is challenging. Various sources of data have been explored in the literature, including surveys (McMillan et al 2022; Calvino and Fontanelli 2023), job advertisements (Alekseeva et al 2021), patents, and firms' websites (Calvino et al 2022). Each of these sources has advantages and disadvantages. For example, surveys and websites can be representative of the broader business population, but often have limited longitudinal firm information. Hiring and patent data may have more longitudinal information, but potentially only capture a narrow slice of the adoption process.
We take an alternative approach by using the text of annual reports and earnings calls of listed firms, obtained via Refinitiv. This provides a potentially broad measure of adoption with good longitudinal information, though the sample will necessarily be skewed towards larger firms. Similar approaches have been applied in the literature to measure other metrics such as firms' climate change exposures (Sautner et al 2023) and firms' debt covenant exposures (Nguyen 2022).
We look for mentions of words related to each of the technologies of interest in the text. The list of words we use is taken from Bloom et al (2021), who identify word pairings, or ‘bigrams’, that appear to capture technological advancements that have influenced businesses based on patents and US firms' earnings calls. They then group these bigrams into technology clusters. While they identify several clusters, we focus on two for this paper: AI/ML and cloud computing. See Appendix A for a list of the bigrams contained in each technology cluster.
We identify usage of one of these technologies based on the inclusion of one of these bigrams in the text and identify adoption as the first reference to the technology. Rather than simply taking any mentions of the terms as evidence of technology use, we apply several extra filters to ensure that we are legitimately identifying adoption or use of the technology. First, we remove pages with three or more proper nouns, which we identify using in-built parts of speech identification functions in Python's Natural Language Toolkit. This allows us to remove Board member biography pages, which often have references to a director's experience.[1] We also require the annual report or earnings call to have at least two references to the technology. Having applied these filters, we then spot check 10 reports or calls each year and find no false positives where references do not appear to reflect use. As a further robustness, we also consider the results focusing only on annual reports and removing earnings calls where there may be more references to ‘hot topics’. Doing so does not change the results.
While we are confident that we have removed all false positives, we cannot rule out the possibility of false negatives where firms are using the technology but not reporting it, or not reporting it in a way that our method identifies. Assuming these false negatives occur randomly, and we are not consistently missing certain types of adoption or certain types of firms' adoption, the false negatives will tend to be ‘noise’ biasing our analysis towards finding no results. That said, we would expect our approach to mainly pick up substantive implementations of the technology, rather than, for example, simply shifting to a cloud version of word processing software. As such, our results should be interpreted as relating to substantive implementations of these technologies.
2.2 Firm-level financials
To examine the characteristics and performance of adopting firms, we merge our adoption data with financial details sourced from Morningstar. Table 1 displays the median values of various financial statistics for firms outside of the IT sector (which we abstract from for most of the paper) in 2022 as an example, comparing those adopting in that year to those who are yet to adopt.[2]
| Adopters in 2022 | Firms yet to adopt in 2022 | |
|---|---|---|
| Return on assets (%) | 0.8 | −3.9 |
| Revenue ($m) | 108.3 | 1.6 |
| Assets ($m) | 413.9 | 42.9 |
| Cash ratio (%) | 0.1 | 4.2 |
| Debt ($m) | 54.0 | 0.7 |
| Gearing ratio | 0.4 | 0.1 |
| Number of observations | 70 | 928 |
|
Notes: Firms in the IT sector are excluded, as are firms that have adopted prior to 2022. Return on assets is measured as EBITDA/assets*100, cash ratio is measured as cash/assets*100 and gearing ratio is measured as debt/equity*100. Sources: Authors' calculations; Morningstar; Refinitiv. |
||
Generally, adopters are larger in terms of both revenue and assets. However, they have lower levels of liquid assets. They also hold a greater volume of debt, with a higher gearing ratio. Importantly, adopters appear considerably more profitable than non-adopters, as evident from their much higher return on assets.
2.3 Board of Directors characteristics
To consider the role of the Board of Directors, we use information from S&P Capital IQ. Specifically, this database has information and biographies on the past and present Board members at Australian listed companies. Using a snapshot of the Board members as at March 2023, we derive variables for each individual, covering: age; gender; whether they have a Master of Business Administration degree; whether their study was in a STEM-related field[3]; whether they were previously a Board member or a ‘key professional’ in the IT industry; whether they have experience with GPT, as indicated by reference to any of the technology-related words in their biography. For each firm, we create metrics capturing the share of Board members with certain characteristics, based on the position held as of March 2023.[4]
Table 2 provides a snapshot of the data, splitting the sample into those firms adopting technologies in 2022 and those that have not adopted to that point, again focusing on non-IT firms. On average, adopting firms' boards are more likely to have a female member, an individual with an MBA or STEM degree and previous Board positions in IT firms. Adopters are also more likely to have a director with experience in emerging digital GPT, based on the relevant keywords appearing in their biography.[5] As discussed below, given the nature of the board data, we cannot say definitively whether the companies had Board members with these skills at the time of adoption, or whether they joined subsequently to facilitate effective adoption.
| Adopters in 2022 | Firms yet to adopt in 2022 | |
|---|---|---|
| Female (%) | 49 | 36 |
| STEM degree (%) | 39 | 28 |
| MBA degree (%) | 42 | 25 |
| Experience with GPT (%) | 25 | 10 |
| Experience in IT industry (%) | 9 | 2 |
| Age (average, years) | 60 | 60 |
| Number of observations | 67 | 787 |
|
Notes: Based on March 2023 snapshot of Board members. Firms in the IT sector are excluded, as are firms that have adopted prior to 2022. The number of observations that have information about age of Board members is smaller (41 adopters and 423 non-adopters). Sources: Authors' calculations; Morningstar; Refinitiv; S&P Capital IQ. |
||
2.4 Hiring data
As a final dataset, we also incorporate information on firms' job advertisements and whether they mention GPT, which we take as an indicator of trying to bring in those skills. We use the database constructed by Bahar and Lane (2022), which uses Lightcast job ad data from 2012 to 2020 to create indicators identifying whether firms are advertising for GPT-related skills. We match these to our database using a combination of ASX tickers and company names, along with fuzzy matching. Similar data were used by Bloom et al (2021), as well as several papers looking at AI use (e.g. Alekseeva et al 2021; Calvino et al 2022; Babina et al 2023, 2024).
3. Trends in Adoption
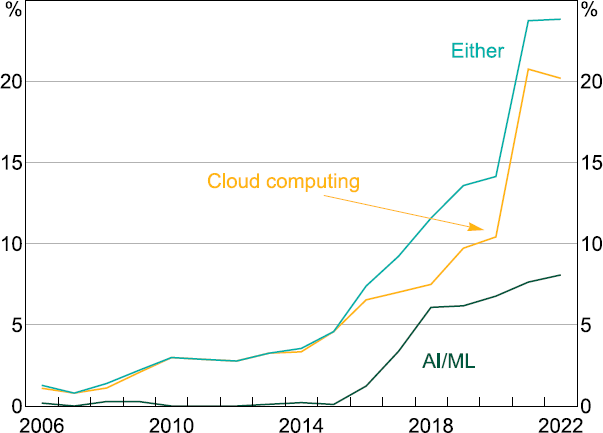
Figure 1 illustrates the proportion of firms referencing cloud computing, AI/ML, and either of these technologies over time. The share of firms first referencing cloud computing technology, which we take as an indicator of adoption, was steady over much of the 2010s. It then ticked up slightly in the late 2010s before spiking during COVID-19. This latter finding is consistent with reports of increased use of digital technologies during the COVID-19 pandemic (McMillan et al 2022). That said, the share of new adopters reverted quickly to the pre-COVID-19 level, suggesting that the COVID-19 pandemic represented a spike in adoption, not a change in the trend. This is notable given adoption is far from universal based on our metric, with only around 1/3 of firms having adopted these technologies.

Sources: Authors' calculations; Refinitiv.
Comparing our results to Bloom et al (2021) for the United States, the share of firms reporting cloud computing reached 10 per cent in 2020 (Figure B1), slightly above the 8 per cent observed for the United States. However, if we focus only on earnings calls, similar to Bloom et al, the level is around 5 per cent. Based on this more comparable metric, it appears that uptake of cloud computing in Australia was probably a bit below that in the United States pre-COVID-19.
Focusing on AI/ML, adoption was negligible until 2015 but then picked up before plateauing at around 3 per cent since 2018. There was no discernible surge in AI/ML adoption during the pandemic. The share of firms ever having referenced these technologies remains low, though this is likely to change with recent advancements in generative AI like ChatGPT.[6]
The share of Australian listed firms reporting AI/ML in 2020 was around 6 per cent, compared to 8 per cent in the United States. Again, this suggests that the uptake in Australia seems to have been below that in the United States pre-COVID-19.
Trends have differed somewhat across industries (Figure 2). Unsurprisingly, the IT and communication sectors were early adopters of both technologies. The financial and health care sectors also appear to have been early adopters, particularly of AI/ML. But the sharp increase in adoption of cloud computing during COVID-19 was widespread.

Sources: Authors' calculations; Refinitiv.
4. Determinants of Adoption
In this section, we explore what factors are associated with firms' adoption of these GPT. This can provide insights into the drivers of, or barriers to, adoption. We first focus on firm balance sheet metrics and demographics. We then consider the characteristics of the Board of Directors, including their demographics, educational background and relevant skills.
4.1 Firm-level characteristics
To examine the firm characteristics that are associated with adoption, we estimate a multivariate regression. The regression is a panel regression, where we focus on firms that have not adopted these technologies up to that point. We take this approach as it allows us to abstract from the effects that adoption could have on firm-level variables (e.g. firms may become larger post-adoption and we want to abstract from this). For this reason, we also lag the factor by two periods.[7]
The regression takes the form:
where Adopti,t, takes on the value 1 if firm i adopts in year t, and 0 otherwise. Factorsi,t−2 includes several variables of interest, including balance sheet metrics and firm age, lagged by two years. We also account for industry-by-time fixed effects to abstract from adoption patterns in each industry . Essentially, we estimate what characteristics predict adoption among those firms that are yet to adopt these technologies. The regression covers the period from 2013 to 2022, though the results are similar if we focus on more recent adopters (e.g 2017 onwards).
We find that firms are more likely to adopt GPT if they are larger, as measured by (log) assets (Table 3). If a firm were to go from the median size for firms yet to adopt by 2022 ($42.9 million) to that for those adopting in 2022 ($413.9 million), their probability of adoption would rise by around 2.7 percentage points. To put this into context, of the firms that were yet to adopt before 2022, around 7 per cent adopted GPT in 2022 (Table 1). This finding is consistent with a number of papers focusing on AI use (e.g Calvino et al 2022; Calvino and Fontanelli 2023), which have tended to attribute the finding to scale advantages, possibly due to high fixed costs in AI adoption. Liquidity also appears important, with firms with positive cash flow being 1.8 percentage points more likely to adopt, and those with higher cash ratios also being slightly more likely, consistent with findings for AI usage overseas (Alekseeva et al 2021; Babina et al 2024). This suggests that financing constraints could be a relevant barrier to adoption.
That said, it is important to interpret this finding in the context of the firms analysed. We focus on listed firms, who tend to be established. For such firms there may be substantial costs in shifting from existing production technologies to new ones. Such costs will be lower for newly established firms. Moreover, our measure of adoption is more likely to capture substantive investments, rather than small indirect adoption of technologies (e.g. switching to a cloud version of a software product).
| Assets (log) | Return on assets | Positive cash flow | Cash ratio | Labour share of expenses | Age |
|---|---|---|---|---|---|
| 0.012*** (0.001) |
−0.012 (0.009) |
0.018*** (0.007) |
0.018* (0.010) |
0.013** (0.006) |
−0.016 (0.017) |
|
Notes: Firms in the IT sector are excluded, as are firms that have adopted previously. There are approximately 5,300 observations. Includes controls for industry*time effects. *, **, *** indicate significance at the 10, 5 and 1 per cent level, respectively. Standard errors are shown in parentheses and are clustered at the firm level. Return on assets is measured as EBITDA/assets*100 and cash ratio is measured as cash/assets*100. Sources: Authors' calculations; Morningstar; Refinitiv. |
|||||
While not statistically significant, we find a small negative link between firm age, as measured by years since listing, and adoption. The direction of the relationship is unsurprising as younger firms likely find it easier to adopt newer technologies given the lack of existing ‘vintage’ capital to replace. However, the lack of a significant relationship is consistent with the mixed evidence on AI adoption in Calvino et al (2022) and Calvino and Fontanelli (2023). That said, given our focus is on listed firms, and we measure age based on years since listing, very few firms may be truly young.
Finally, there is some evidence that firms with a higher share of their expenses being labour are more likely to adopt. That said, the magnitude of the coefficient is small (going from no labour costs to all labour costs raises the probability of adoption by just over 1 percentage point).
We run several robustness tests which do not change the results. These include using a probit model and taking a non-parametric approach by replacing the linear explanatory variables with dummy variables showing which decile of the industry-level distribution the firm was in (see Appendix C). The decile model indicates that the largest firms in each industry (i.e. top two deciles) are far more likely to adopt than other firms.
4.2 Board characteristics
Next, we examine the attributes of a firm's Board of Directors. Due to the cross-sectional nature of our board data, we estimate the model as a cross-sectional regression, where adoption is measured as ever having adopted by 2022. Specifically, we run the following regression:
where Adopt by 2022i is a dummy variable that takes on the value 1 if the firm has adopted a GPT by 2022 (inclusive). Again, we include industry controls to abstract from differences in adoption across industry and just focus of the effect of board characteristics. The variable Board Characteristicsi is a variable that takes on the value 1 if the firm has a director with the characteristic of interest. We include all characteristics together in a multivariate regression. Finally, given the importance of size for adoption, and the possibility that larger firms are more likely to have directors with certain characteristics, we also control for the size of the firm, measured by their (log) assets in 2022.
Focusing again on non-IT firms, we find that having a Board member with prior experience in the IT industry raises the probability of having adopted by around 25 per cent (Table 4). This compares to an unconditional probability of adoption of around 1/3 within the sample (Figure 1, bottom panel). Having a Board member with some experience with GPT is also associated with a higher probability of adoption. One explanation for these findings is that having Board members with these skills contributes to the decision to adopt. Another is that firms bring on Board members with such skills because they intend to or have adopted these technologies, and so these skills facilitate adoption, but do not lead to adoption. Given the lack of longitudinal information we cannot separately test these two explanations. However, both suggest that having directors with technology-related knowledge is important for adoption.
| Without size control | With size control | |
|---|---|---|
| Female | 0.076** (0.026) |
0.004 (0.023) |
| STEM degree | 0.014 (0.040) |
−0.005 (0.034) |
| MBA degree | 0.044 (0.030) |
0.001 (0.030) |
| Experience in IT industry | 0.250** (0.091) |
0.316*** (0.076) |
| Experience with GPT | 0.113** (0.042) |
0.086** (0.043) |
| Number of observations | 1,251 | 1,249 |
|
Notes: Excludes firms in the IT industry. Adoption metric is whether a firm has adopted by 2022. All regressions control for industry*time effects. All explanatory variables are dummies indicating whether the firm has any Board member (as of March 2023) with the relevant characteristic. *, **, *** indicate significance at the 10, 5 and 1 per cent level, respectively. Standard errors are shown in parentheses and are clustered at the industry level. Sources: Authors' calculations; Morningstar; Refinitiv; S&P Capital IQ. |
||
Unconditionally, the presence of a female Board member is linked to around an 8 percentage point increase in the probability of adoption. However, this appears to be driven by the fact that female representation on the Board is highly correlated with firm size. Once we control for firm size, female representation is no longer statistically significantly related to adoption. Similarly, we find no significant relationship between the directors' education and adoption.
It is important to reiterate that these findings should be thought of as correlations, rather than causal. For example, it could be that firms with strong governance have more diverse boards, or boards with more diverse skills, and these same firms may also be more likely to adopt technologies. Still, they provide some evidence that having a mix of skills and backgrounds is associated with greater adoption.
5. Adoption and Firm Profitability
5.1 Empirical framework
We employ a panel event study framework to estimate the effect of GPT adoption on firm-level outcomes. The framework allows us to analyse changes in firm outcomes before and after the adoption of GPT, accounting for the fact that firms adopt GPT at different points in time which can create issues around overlapping treatment periods in difference-in-difference models (Goodman-Bacon 2019). The approach is also similar in nature to the dynamic analysis undertaken in Babina et al (2024) for AI adoption.
The variable Adopti indicates the period when the technology was first referenced by firm i. The outcome of interest is denoted as yit, and the panel event study specification is as depicted in Equation (2).
where:
The adoption event's lags and leads are defined as binary variables signifying that a specific firm was a given number of periods away from the adoption event. The coefficients of interest are the betas related to the lags and leads. We focus on up to four years before adoption and three years after.[8] While a longer post-adoption window could be appropriate if these investments have very long payoff windows, we are constrained by the sample period available.
We control for firm fixed effects in and industry-time fixed effects . The former allows us to control for time-invariant unobserved heterogeneity at the firm level, while the latter accounts for industry-level patterns in adoption, demand conditions, tax incentives and reporting standards. We also control for firm size, measured as log assets, given the earlier findings around its importance for adoption. We cluster standard errors at the firm level to account for correlation of outcomes within firms over time.
For the analysis, our reference or base period, relative to which all other results are interpreted, is two years before adoption. We choose this rather than the identified year of adoption as there is some evidence that firms may be investing or changing their behaviour ahead of adoption.
This approach allows us to consider how outcomes change pre- and post-adoption. If there is no trend in outcomes beforehand, it will provide some evidence that there are no other factors driving both future profitability and the decision to adopt, which would make our results invalid. That said, our results should still be thought of as correlations, rather than as strictly causal. Ultimately firms are selecting into adoption (treatment), rather than it being allocated randomly, and they may do so in expectation of some future outcome.
5.2 Aggregate results
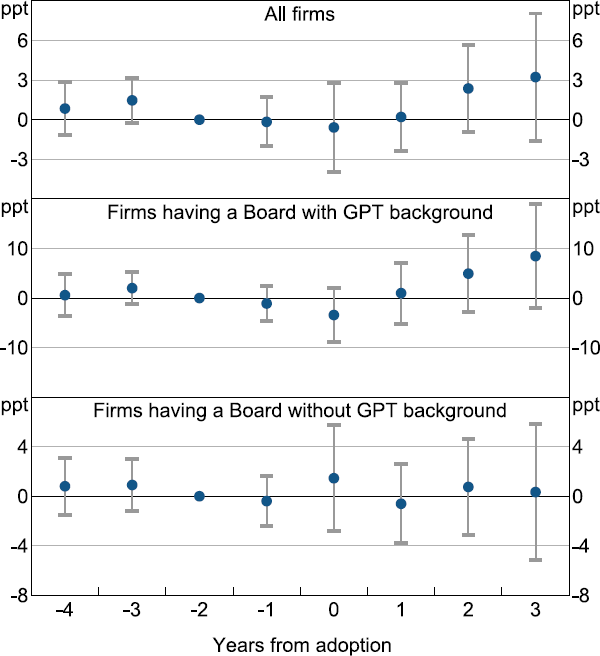
We start our analysis focusing on non-IT firms over the full sample period. This includes any adoption event occurring from 2013 to 2022, and any balance sheet data back to 2009 to account for the pre-adoption behaviour of firms. Profitability generally remains broadly stable following adoption, showing neither statistically nor economically significant differences compared to the pre-adoption period (Figure 3).

Notes: Dots represent point estimates. Whiskers indicate 90 per cent confidence intervals.
Source: Authors' calculations; Morningstar; Refinitiv.
There is a large literature documenting that the diffusion of GPT tends to be slow because of the need to create complementary inventions, or make organisation changes, that facilitate profitable adoption of the GPT (e.g., Agrawal et al 2023a). In the case of cloud computing, this could reflect the developments in cloud-based programs or cloud services. For AI/ML, this could include the development of simple machine learning models and packages.
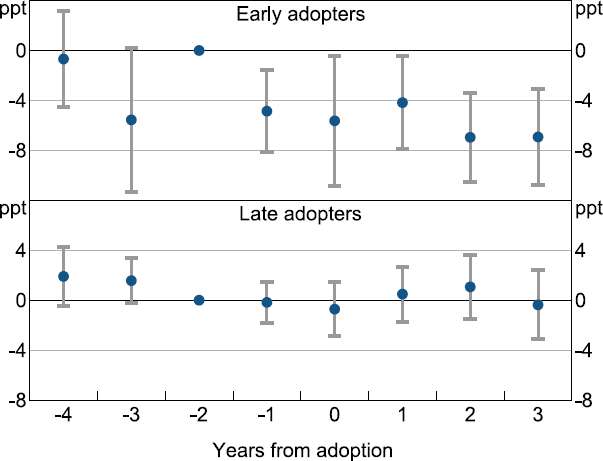
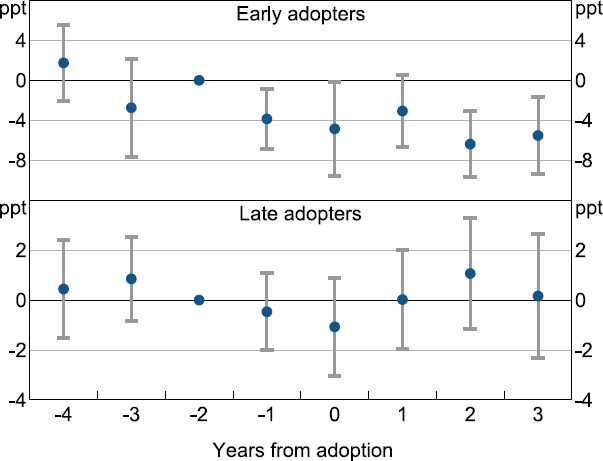
As such, it is worth examining whether profitability evolves differently for early and late adopters.[9] Figure 4 shows that there is a significant downturn in profitability in the years following the adoption event for early adopters, defined as those adopting from 2013 to 2016. Conversely, profitability of late adopters (adopting from 2017 to 2022) seems to remain broadly stable post-adoption. To test whether the difference in post-adoption outcomes for early and late adopters is significant we adopt a staggered difference-in-difference-in-difference model. We do find a marginally significant difference in outcomes, suggesting that late adopters had better post-adoption outcomes than early adopters (Appendix F).

Notes: Dots represent point estimates. Whiskers indicate 90 per cent confidence intervals.
Sources: Authors' calculations; Morningstar; Refinitiv.
Importantly, there is no significant trend in outcomes in the pre-adoption period across all samples, providing some evidence that the findings do not reflect differing prospects and trajectories for the firms. That said, there is some volatility in profitability in the years pre-adoption. However, the results are robust to changing the exact period definitions, for example by lumping all pre-and post-adoption periods together (Appendix E).
It is also possible that there are some other differences between early and late adopters that are driving the differences in their outcomes. One is that changes in accounting standards could potentially play a role. From 2019 to 2020 there was a clarification in accounting standards indicating that most cloud computing expenses should be expensed, though a small share could be recorded as investment (Department of Finance 2022). This is likely to have led more firms to record GPT-related outlays as expenses, which should weigh on their profitability and work against our findings. More generally, the adoption of cloud technology could lead firms to shift from capital expenditure with subsequent depreciation expenses, to operating expenses, making it look like firms' profitability is falling post-adoption when profitability is measured using EBITDA (as we do).
We take two simple approaches to considering these issues. The first is to deduct capital purchases from profitability. The second is to account for depreciation expenses by measuring profitability as EBIT (earnings before interest and tax). The results remain broadly unchanged, though the measure including capital expenditure is noisier (Appendix H).[10]
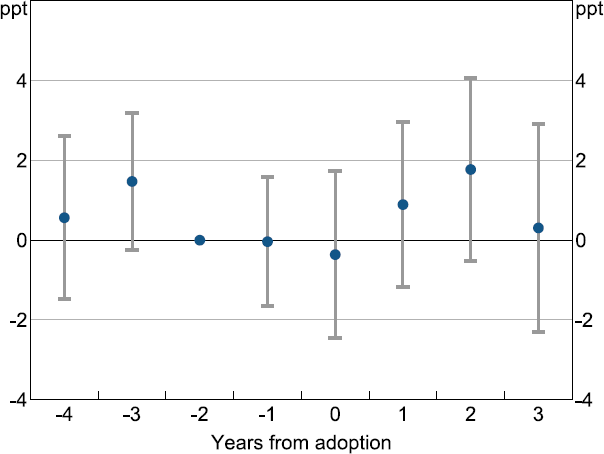
One further concern might be the inclusion of the COVID-19 pandemic in the late adopters sample. It may be that those firms that had adopted cloud or AI/ML technologies were better able to navigate the COVID-19 shock, either because they were better managed or because the technologies helped navigate the shock (consistent with the large spike in adoption). As a simple test, we ended our sample in 2020. Doing so leads to, if anything, stronger evidence that late adopters increase profitability following post-adoption in terms of the magnitude of the effect, though the response is not significant (Appendix I).[11]
Taken together these results suggest that profitable adoption has become easier over time, consistent with further developments in these technologies.[12] If this is the case, it suggests that there may be more scope for effective adoption of these technologies going forward, which could improve productivity. That said, there still appears to be a large degree of variation in outcomes, as reflected in the wide error bands. This suggests other factors may dictate whether adoption is profitable, which we explore below.
5.3 The role of Board of Directors
In this section, we delve into the characteristics of the Board of Directors that correlate with the profitable adoption of technologies. We conduct the same event study looking at profitability post-adoption, but split the sample based on whether the Board has members with certain characteristics or not. We focus on late adopters (post-2016), given this is when the bulk of adoption occurs. Focusing on the most recent adoptions also should help to limit issues around the cross-sectional snapshot of directors becoming less accurate over time.
Focusing first on whether the Board has some members with a background in GPT, there is evidence of an increase in profitability for adopting firms whose current Board has some degree of GPT expertise, at least temporarily (Figure 5). This is not the case for boards with no members with GPT experience. The difference in outcomes is statistically significant (Appendix F) and robust to period definitions (Appendix E). The difference in outcomes appears to be driven by a reduction in operating expenses for firms with a GPT-experienced Board, while revenue remains stable post-adoption for all firms (Appendix D). This contrasts to Babina et al (2024) who find that AI adoption leads to increased sales, but relatively few cost savings. The difference may reflect that the adoption of cloud technologies is far more frequent in our sample and appears to drive much of our results.[13]

Notes: Late adopter sample. Dots represent point estimates. Whiskers indicate 90 per cent confidence intervals.
Sources: Authors' calculations; Morningstar; Refinitiv; S&P Capital IQ.
These results provide some evidence that boards with relevant experience may help profitable adoptions to GPT. Such a finding is somewhat consistent with evidence from Alekseeva et al (2021) and Calvino et al (2022) that having managers with AI skills is highly valued in terms of wage premia or firm productivity, respectively.
One concern with this finding may be that Board members add mentions of GPT to their biographies if their company profitably adopted the technology. However, spot checks of the biography data suggest that this is not a key driver, and that we are mainly picking up the directors' educational background and previous work experience.
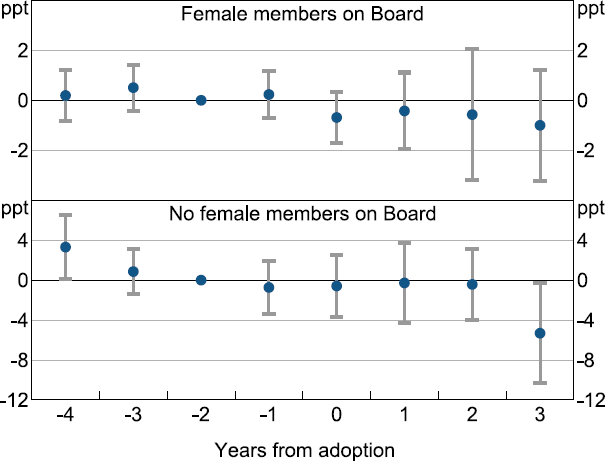
We also observe substantial variation in profitability based on the gender composition of the Board. Figure 6 indicates that there is a statistically significant (if temporary) increase in return on assets for firms with a female Board member. However, there is no evidence of any change in profitability among late adopters with no female representation on the Board of Directors. The difference in post-adoption outcomes across the groups is statistically significant (Appendix F). This finding aligns with and bolsters earlier findings that gender diversity in senior management roles is associated with stronger firm performance (Gordini and Rancati 2017; EmadEldeen et al 2021) and dynamic capabilities (Wilson et al 2023). In terms of magnitude, the increase in profitability for firms with female representation is far smaller than that for those with GPT skills, suggesting the latter is likely a more important driver of company outcomes.

Notes: Late adopter sample. Dots represent point estimates. Whiskers indicate 90 per cent confidence intervals.
Sources: Authors' calculations; Morningstar; Refinitiv; S&P Capital IQ.
Since there is a strong positive correlation between firm size and female representation on the Board, the increase in profitability post-adoption for firms with a female director may be driven by firm size.[14] To check for this, we first conduct the event study separately for larger firms (in the 4th and 5th quintiles of assets) and smaller firms (in the bottom three quintiles of assets). Profitability is unchanged post-adoption for larger firms, whereas it tends to increase for smaller firms though not significantly so (Appendix G). Given the prevalence of female Board members on larger firm boards, this would work against the above findings. To consider this further, we split firms by a combination of firm size and female representation and find that smaller firms with a female director appear to drive the increased profitability (though the increase is not significant, likely reflecting the small sample size). Taken together, this suggests that it is female representation (or some other correlated factor), not size, that is driving the result.[15]
None of the other Board characteristics were associated with differing profitability post-adoption. This is somewhat surprising given the strong correlation between adoption and, for example, having someone with an IT background on the Board. In part, it may reflect the use of a snapshot of the Board and their skills and experience. Future work could explore the question using longitudinal board information.
6. Adoption and Hiring
Above we have considered the role of a director's skills in adoption. But workers' skills are also likely to be important. While we do not have information about the stock of employees, we can obtain information on hiring for at least a subset of firms, using the dataset created in Bahar and Lane (2022) that covers 2012 to 2020.
First, we can consider whether firms that adopt are more likely to place job advertisements for workers with these skills. To do so we run a simple regression of the following form
Our outcome variable Hire a skilled worker by 2022i takes on the value 1 if the firm has put a job ad looking for GPT-skilled workers during the sample, and 0 if none of their job ads asked for these skills. We regress this on an indicator for whether or not the firm has adopted a GPT by 2022. Again we control for industry and size to capture other factors that might explain outcomes.
For the sub-sample of firms for whom we can observe job advertisements, those that have adopted a GPT are far more likely to have advertised for GPT skills at some stage, with the probability being around 16 percentage points higher than for non-adopters once we control for firm characteristics (Table 5). This suggests that firms increase their demand for these skills when trying to use these technologies.
| With no controls | With industry controls | With industry and size controls | |
|---|---|---|---|
| Adopt | 0.372*** (0.079) |
0.397*** (0.083) |
0.162** (0.070) |
| Number of observations | 215 | 215 | 215 |
|
Notes: Excludes firms in the IT industry. Only includes firms that have job ads captured in the Bahar and Lane (2022) sample. *, **, *** indicate significance at the 10, 5 and 1 per cent level, respectively. Standard errors are shown in parentheses and are clustered at the industry level. Size control accounts for firm's largest ever (log) assets. Sources: Authors' calculations; Bahar and Lane (2022) using Lightcast data; Morningstar; Refinitiv. |
|||
We see something similar when we look at the pattern of hiring over time. To show this we apply the same event study as outlined in Equation (2), with the outcome variable of interest being a dummy variable that takes on the value 1 if any of the job advertisements the firm posted during the year were for GPT, and 0 if none were asking for these skills.[16] Focusing on late adopters, there is a pick-up in hiring post-adoption (Figure 7). This is particularly evident for firms with Board members with GPT experience. As noted, these are also the same firms that have the most evidence of increased profitability post-adoption. While certainly not definitive, this provides some tentative evidence that hiring skilled workers is an important step in the profitable adoption of some of these GPT. Such a finding is also somewhat consistent with overseas findings that firms with more skilled workers are more likely to invest in AI/ML in the form of further hiring of skilled workers (Babina et al 2023).
More generally though, taken together these results suggest that adoption of GPT is associated with increased demand for skilled workers and therefore highlight the important role a skilled workforce plays in the effective adoption of GPT. Future work could further explore these results using more complete information on the stock of workers at these firms.[17]

Notes: Late adopter sample. Dots represent point estimates. Whiskers indicate 90 per cent confidence intervals.
Sources: Authors' calculations; Bahar and Lane (2022) using Lightcast data; Morningstar; Refinitiv; S&P Capital IQ.
7. Conclusion
Against the background of slowing productivity growth and technology diffusion, it is crucial to better understand the drivers and barriers to the adoption of emerging digital general-purpose technologies, and their impact on firm outcomes. This paper leverages a unique dataset derived from annual reports and earnings calls to examine the adoption of cloud computing and AI/ML in Australia.
Overall, our findings provide a mixed view of the prospects for future adoption and productivity growth. While we do find that the pandemic led to an unprecedented surge in GPT adoption, rates of adoption reverted quickly to the pre-pandemic trend. As such, the pandemic seems to have been associated with a level shift in adoption, not an ongoing increase in the speed of adoption. That said, we do find evidence that it has become easier to profitably adopt GPT, which could support productivity growth going forward, particularly if firms are encouraged to invest and improve through strong competition.
We also find evidence of the importance of director and worker skills in adoption. Having gender-diverse boards with a strong technical background is associated with a greater chance of profitable GPT adoption. And there is a strong association between adoption and hiring of skilled workers, suggesting firms require skilled workers to adopt these GPT. These findings highlight the importance of building a skilled and dynamic labour force in Australia to facilitate adoption of GPT and support productivity growth.
Appendix A: Technological Keywords
| Cloud computing | Artificial intelligence and machine learning |
|---|---|
| paas, cloud infrastructure, distributed cloud, cloud provider, cloud offerings, cloud service, cloud applications, community cloud, private cloud, public cloud, cloud deployments, cloud environments, cloud management, cloud services, cloud security, enterprise class, iass, hybrid cloud, cloud platform, cloud hosting, personal cloud, enterprise network, cloud computing, cloud based, saas, cloud storage, enterprise applications, cloud solution, enterprise cloud, cloud deployment | neural network, deep learning, language processing, machine learning, machine intelligence, natural language, artificial intelligence, ai technology, supervised learning, learning algorithms, unsupervised learning, reinforcement learning, ai machine |
Appendix B: Trends and Descriptive Statistics
Sources: Authors' calculations; Refinitiv.
| Early adopters | Late adopters | |
|---|---|---|
| Return on assets (%) | 4.9 | 4.2 |
| Revenue ($m) | 32.6 | 98.0 |
| Assets ($m) | 83.7 | 274.4 |
| Liquid assets ($m) | 0.5 | 0.3 |
| Debt ($m) | 5.4 | 37.0 |
| Gearing ratio | 0.3 | 0.4 |
| Number of observations | 374 | 3,456 |
|
Notes: Firms in the IT sector are excluded, as are firms that have adopted prior to the collection year. Return on assets is measured as EBITDA/assets*100 and gearing ratio is measured as debt/equity*100. The number of observations is at firm-year level. Sources: Authors' calculations; Morningstar; Refinitiv. |
||
Appendix C: Robustness Checks for Adoption Determinants
| Assets (log) | Return on assets | Positive cash flow | Cash ratio | Labour share of expenses | Age |
|---|---|---|---|---|---|
| 0.142*** (0.017) |
0.240 (0.003) |
0.301*** (0.107) |
0.246 (0.257) |
0.257* (0.001) |
−0.174 (0.232) |
|
Notes: Firms in the IT sector are excluded, as are firms that have adopted previously. There are approximately 3,650 observations. Includes controls for industry*time effects. *, **, *** indicate significance at the 10, 5 and 1 per cent level, respectively. Standard errors are shown in parentheses and are clustered at the firm level. Return on assets is measured as EBITDA/assets*100 and cash ratio is measured as cash/assets*100. Sources: Authors' calculations; Morningstar; Refinitiv. |
|||||
| Lag 2 | Assets (log) | Standard errors | |||||||||||||||||||
|---|---|---|---|---|---|---|---|---|---|---|---|---|---|---|---|---|---|---|---|---|---|
| 2nd decile | 0.004 | 0.009 | |||||||||||||||||||
| 3rd decile | −0.001 | 0.008 | |||||||||||||||||||
| 4th decile | 0.012 | 0.009 | |||||||||||||||||||
| 5th decile | 0.016* | 0.009 | |||||||||||||||||||
| 6th decile | 0.019* | 0.009 | |||||||||||||||||||
| 7th decile | 0.018* | 0.009 | |||||||||||||||||||
| 8th decile | 0.010 | 0.009 | |||||||||||||||||||
| 9th decile | 0.055*** | 0.011 | |||||||||||||||||||
| 10th decile | 0.081*** | 0.010 | |||||||||||||||||||
|
Notes: Firms in the IT sector are excluded, as are firms that have adopted previously. There are 5,283 observations. *, **, *** indicate significance at the 10, 5 and 1 per cent level, respectively. Standard errors are clustered at the firm level. Deciles defined by industry and year. Sources: Authors' calculations; Morningstar; Refinitiv. |
|||||||||||||||||||||
Appendix D: Operating Expenses and Revenue
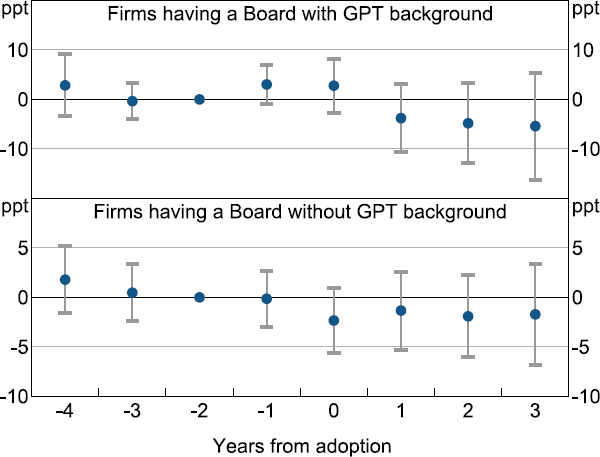
Notes: Late adopter sample. Dots represent point estimates. Whiskers indicate 90 per cent confidence intervals.
Sources: Authors' calculations; Morningstar; Refinitiv; S&P Capital IQ.
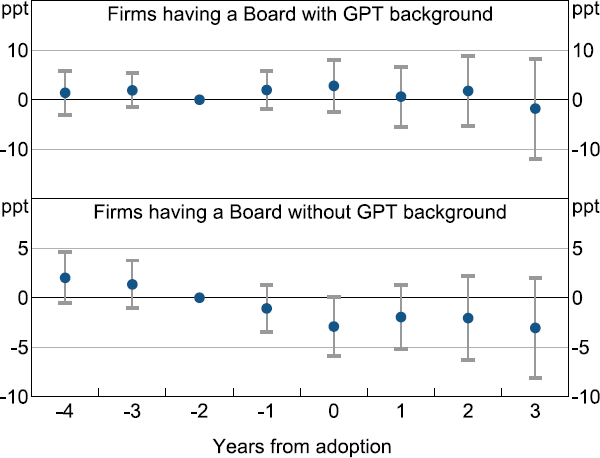
Notes: Late adopter sample. Dots represent point estimates. Whiskers indicate 90 per cent confidence intervals.
Sources: Authors' calculations; Morningstar; Refinitiv; S&P Capital IQ.
Appendix E: Robustness Checks Using Accumulated Lags and Leads
While the event study set-up with multiple leads and lags allows us to examine the timing of adoption effects on profitability, it is useful to know if, taken together, there are significant changes in profitability post-adoption from the pre-adoption periods. To this end, we conduct two robustness checks. First, we accumulate all the leads and lags into binary variables indicating pre-adoption and post-adoption, as follows:
where:
We estimate Equation (E1) for the same sub-samples as explored previously. Results show significant evidence of an increase in profitability in the joint post-adoption periods for late adopters with GPT experience, though the increase is not significant for those with female representation on the Board.
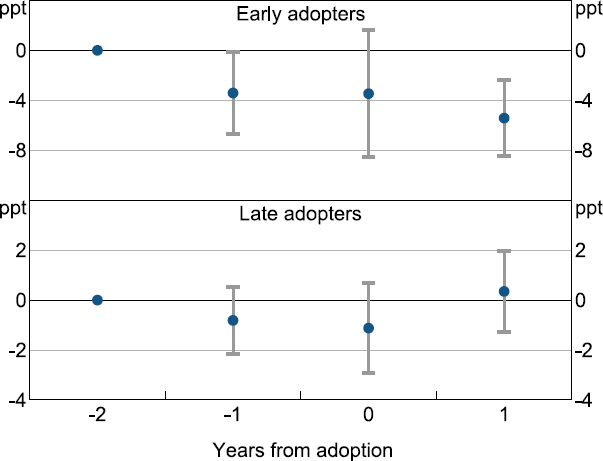
Notes: Dots represent point estimates. Whiskers indicate 90 per cent confidence intervals.
Sources: Authors' calculations; Morningstar; Refinitiv.
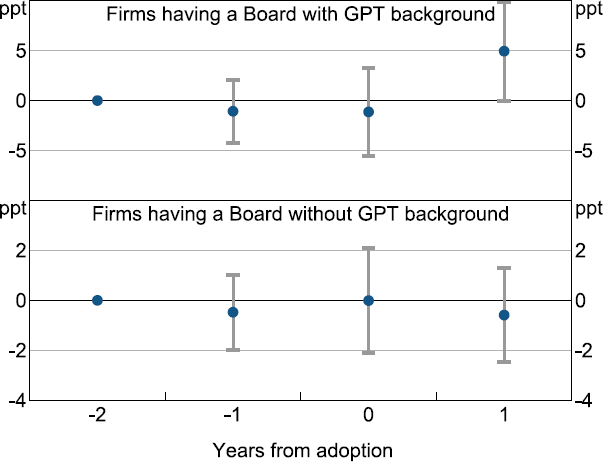
Notes: Late adopter sample. Dots represent point estimates. Whiskers indicate 90 per cent confidence intervals.
Sources: Authors' calculations; Morningstar; Refinitiv; S&P Capital IQ.
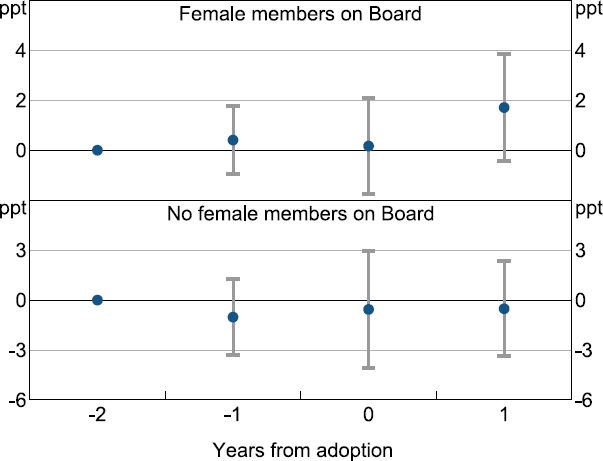
Notes: Late adopter sample. Dots represent point estimates. Whiskers indicate 90 per cent confidence intervals.
Sources: Authors' calculations; Morningstar; Refinitiv; S&P Capital IQ.
Appendix F: Robustness Checks Using Staggered Difference-in-difference-in-difference
We also employ a staggered difference-in-difference-in-difference framework where we interact the treatment variable and the group split. This approach is very similar to the event studies but allows for easier testing of differences in outcomes between groups.
where:
Firms are split into groups g based on their characteristics of interest (having a Board member with GPT background, having a female Board member, early or late or non-adopters). Our coefficients of interest are which trace the difference in profitability of firms in group g between post-adoption and pre-adoption periods, relative to the control group. We start the GPT and female regressions in 2015 and the late versus early adoption regression in 2011 given we do not model longer lags so have less need for prior information.[18]
Results shown in Table F1 confirm the event study findings that suggest the role of GPT background and female representation on the Board for firm profitability following adoption. Similarly, there is a significant difference between outcomes for early and late adopters post-adoption.
| Firms with GPT experience | Firms with female representation | Late adopters | |
|---|---|---|---|
| At adoption | −1.798 (2.142) |
2.062 (1.773) |
3.880 (3.223) |
| Post-adoption | |||
| One year | 3.430 (3.334) |
5.222** (2.526) |
4.496 (3.101) |
| Two years | 7.098* (3.951) |
0.244 (2.937) |
5.606* (3.304) |
| Three years plus | 1.671 (4.890) |
3.106 (3.285) |
5.924 (3.187) |
| Number of observations | 7,555 | 7,555 | 11,598 |
|
Notes: Firms in the IT sector are excluded. *, **, *** indicate significance at the 10, 5 and 1 per cent level, respectively. Standard errors are shown in parentheses and are clustered at the firm level. Sources: Authors' calculations; Morningstar; Refinitiv; S&P Capital IQ. |
|||
Appendix G: Robustness Checks Using Firm Size
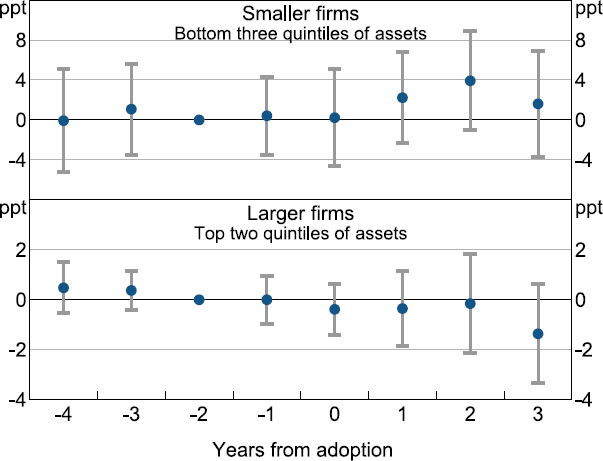
Notes: Late adopter sample. Dots represent point estimates. Whiskers indicate 90 per cent confidence intervals.
Sources: Authors' calculations; Morningstar; Refinitiv.
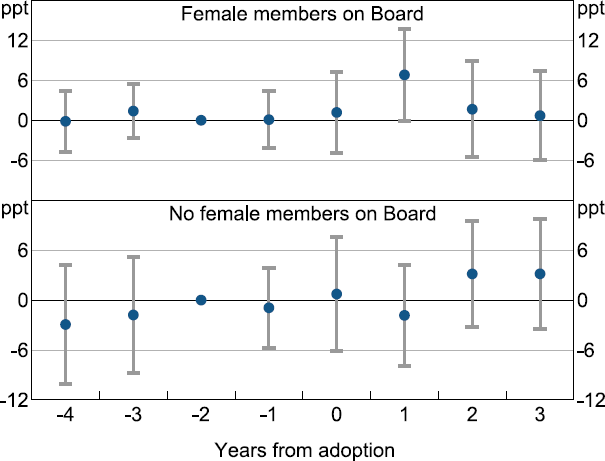
Notes: Late adopter sample. Bottom three quintiles of assets. Dots represent point estimates. Whiskers indicate 90 per cent confidence intervals.
Sources: Authors' calculations; Morningstar; Refinitiv; S&P Capital IQ.
Notes: Late adopter sample. Top two quintiles of assets. Dots represent point estimates. Whiskers indicate 90 per cent confidence intervals.
Sources: Authors' calculations; Morningstar; Refinitiv; S&P Capital IQ.
Appendix H: Robustness to Other Profitability Measures
Notes: Dots represent point estimates. Whiskers indicate 90 per cent confidence intervals.
Sources: Authors' calculations; Morningstar; Refinitiv.
Notes: Dots represent point estimates. Whiskers indicate 90 per cent confidence intervals.
Sources: Authors' calculations; Morningstar; Refinitiv.
Appendix I: Other Robustness Checks
Notes: Late adopter sample. Dots represent point estimates. Whiskers indicate 90 per cent confidence intervals.
Sources: Authors' calculations; Morningstar; Refinitiv.
Notes: Late adopter sample. Dots represent point estimates. Whiskers indicate 90 per cent confidence intervals.
Sources: Authors' calculations; Morningstar; Refinitiv; S&P Capital IQ.
References
Acemoglu D and P Restrepo (2018), ‘Artificial Intelligence, Automation and Work’, NBER Working Paper No 24196.
Agrawal A, JS Gans and A Goldfarb (2023a), ‘Similarities and Differences in the Adoption of General Purpose Technologies’, in S Basu, L Eldridge, J Haltiwanger and E Strassner (eds), Technology, Productivity, and Economic Growth, Studies in Income and Wealth, University of Chicago Press, Chicago.
Agrawal AK, JS Gans and A Goldfarb (2023b), ‘The Turing Transformation: Artificial Intelligence, Intelligence Augmentation, and Skill Premiums’, NBER Working Paper No 31767.
Alekseeva L, J Azar, M Giné, S Samila and B Taska (2021), ‘The Demand for AI Skills in the Labor Market’, Labour Economics, 71, Article 102002.
Andrews D, J Hambur, D Hansell and A Wheeler (2022), ‘Reaching for the Stars: Australian Firms and the Global Productivity Frontier’, Australian Treasury Working Paper No 2022-01.
Babina T, A Fedyk, A He and J Hodson (2023), ‘Firm Investments in Artificial Intelligence Technologies and Changes in Workforce Composition’, NBER Working Paper No 31325.
Babina T, A Fedyk, A He and J Hodson (2024), ‘Artificial Intelligence, Firm Growth, and Product Innovation’, Journal of Financial Economics, 151, Article 103745.
Bahar E and O Lane (2022), ‘How Dispersed are New Technologies in the Australian Job Market?’, Treasury Round Up, October, pp 21-27.
Bayrak E, JP Conley and S Wilkie (2011), ‘The Economics of Cloud Computing’, The Korean Economic Review, 27(2), pp 203-230.
Bloom N, TA Hassan, A Kalyani, J Lerner and A Tahoun (2021), ‘The Diffusion of Disruptive Technologies’, Centre for Economic Performance, CEP Discussion Paper No 1798.
Burgess J and J Connell (2020), ‘New Technology and Work: Exploring the Challenges’, The Economic and Labour Relations Review, 31(3), pp 310-323.
Calvino F and L Fontanelli (2023), ‘A Portrait of AI Adopters across Countries: Firm Characteristics, Assets' Complementarities and Productivity’, OECD Science, Technology and Industry Working Papers No 2023/02.
Calvino F, L Samek, M Squicciarini and C Morris (2022), ‘Identifying and Characterising AI Adopters: A Novel Approach on Big Data’, OECD Science, Technology and Industry Working Papers No 2022/06.
Crafts N (2021), ‘Artificial Intelligence as a General-purpose Technology: An Historical Perspective‘, Oxford Review of Economic Policy, 37(3), pp 521-536.
Department of Finance (2022), ‘Cloud Computing Arrangements’, accessed April 2023. Available at <https://www.finance.gov.au/publications/resource-management-guides/accounting-internally-developed-software-and-cloud-computing-arrangements-rmg-109/cloud-computing-arrangements>.
DISER (Department of Industry, Science, Energy and Resources) (2021), ‘Innovation Activity’, Australian Innovation System Monitor, accessed April 2023. Available at <https://www.industry.gov.au/sites/default/files/minisite/static/e809cbb0-a803-4827-a45b-51598ba272b2/australian-innovation-system-monitor/business-innovation/innovation-activity/index.html>.
Economist, The (2023), ‘Chief Executives Cannot Shut up about AI’, The Economist online, 3 June, accessed June 2023. Available at <https://www.economist.com/business/2023/06/01/chief-executives-cannot-shut-up-about-ai>.
Ellis L (2021), ‘Innovation and Dynamism in the Post-pandemic World’, Address to the Committee for the Economic Development of Australia, Online, 18 November.
EmadEldeen, R, AF Elbayoumi, MAK Basuony and EKA Mohamed (2021), ‘The Effect of the Board Diversity on Firm Performance: An Empirical Study on the UK’, Corporate Ownership & Control, 18(3, Special Issue), pp 337-347.
Etro F (2010), ‘The Economics of Cloud Computing’, VoxEU Column, 25 February, accessed April 2023. Available at <https://cepr.org/voxeu/columns/economics-cloud-computing>.
Goodman-Bacon A (2019), ‘So You've Been Told to Do My Difference-in-differences Thing: A Guide’, Unpublished manuscript, Vanderbilt University.
Gordini N and E Rancati (2017), ‘Gender Diversity in the Italian Boardroom and Firm Financial Performance’, Management Research Review, 40(1), pp 75-94.
Hambur J (2023), ‘Did Labour Market Concentration Lower Wages Growth Pre-COVID?’, RBA Research Discussion Paper No 2023-02.
Hambur J and D Andrews (2023), ‘Doing Less, with Less: Capital Misallocation, Investment and the Productivity Slowdown in Australia’, RBA Research Discussion Paper No 2023-03.
Loucks J (2018), ‘Artificial Intelligence: From Expert-only to Everywhere’, in ‘Technology, Media, and Telecommunications Predictions 2019’, Deloitte Insights, pp 14-23.
Makhlouf R (2020), ‘Cloudy Transaction Costs: A Dive into Cloud Computing Economics’, Journal of Cloud Computing, 9, Article 1.
McMillan H, T Murray, C de Fontenay and R Lattimore (2022), ‘Head in the Cloud: Firm Performance and Cloud Service’, Paper presented at the 2022 ABS and RBA Joint Conference on ‘Economic Implications of the Digital Economy’, 9-10 March, Sydney.
Nguyen K (2022), ‘The Real Effects of Debt Covenants: Evidence from Australia’, RBA Research Discussion Paper No 2022-05.
Productivity Commission (2023), 5-year Productivity Inquiry: Innovation for the 98%, Vol 5, Inquiry Report No 100, Productivity Commission, Canberra.
Sautner Z, L van Lent, G Vilkov and R Zhang (2023), ‘Firm-level Climate Change Exposure’, Journal of Finance, 78(3), pp 1449-1498.
West D (2022), ‘Weighing up the Cost of Disconnected Digital Business Experiences’, MYOB online blog, 9 June, accessed April 2023. Available at <https://www.myob.com/au/blog/digital-disconnection-costs-to-business/>.
Wilson M, R Agarwal, W Li and C Bajada (2023), Dynamic Capabilities: How Australian Firms Can Survive and Thrive in Uncertain Times, Committee for Economic Development of Australia, Melbourne.
Acknowledgements
Thanks to John Simon, Callan Windsor, Flavio Calvino, Min Zhu and seminar participants at the RBA, Australian Conference of Economists, Curtin University, Swinburne University, University of Queensland and the OECD. The views expressed in this paper are those of the authors and do not necessarily reflect the views of the Reserve Bank of Australia. The authors are responsible for any errors.
Footnotes
Initial analysis of the unfiltered data indicated that a very large share of false positives came from these biographies. We also use other cut-offs, such as the 90th percentile of the number of proper nouns within each page in the document. Results are similar. Our approach may lead to some false negatives, for example if Amazon Web services is identified as a proper noun. That said, most of the results are robust to including these pages so this does not appear to be a major issue. [1]
As such, those firms that previously adopted are not included. We take this approach to think about the characteristics of firms when they adopt, rather than after adoption, given adoption could be associated with firm growth. That said, the patterns are similar if we take the simpler approach of just looking at firms that ever adopted, versus those that have not (Table B1). [2]
A STEM degree is a degree in the fields of science, technology, engineering or mathematics. [3]
Ideally, we would create a panel dataset capturing those holding a position in each year. While there is some data on past employment, data on the years at other listed companies is not readily available. We experimented with constructing a panel using names in company reports and work histories in S&P Capital IQ, but the match rate was too low. [4]
One concern with this metric is that references to the technology might reflect the adoption of technology by the firm in question. However, spot checks of the data suggest this is not the case, and that references tend to relate to past work or educational background. [5]
See, for example, The Economist (2023). That said, given AI is such a hot topic, differentiating between legitimate adoption and references may become more difficult going forward. As such, more complex approaches may be needed, for example, looking for nearby verbs indicating use (e.g. deploy) or using more suitable text analysis approaches such as large language models to identify context. [6]
We choose two periods given results from our event study analysis suggest firms may already be undertaking investments in the year before they reference the technology adoption. [7]
We restrict our attention to the four periods prior to adoption only as there is high volatility and noise in the more distant history. [8]
Early adopters tend to be smaller but have similar profitability pre-adoption to late adopters (see Table B1). They are also more likely to be in certain sectors, as shown in Figure 2. [9]
Another approach considered was to use coarsened exact matching, to match our firms across several observables. We considered this approach, and while some of the patterns were similar, the small sample size meant that the results were very volatile and imprecisely estimated. Moreover, given the pre-trends are quite flat in our main regressions, and given the main concerns around causality likely arise around selection on unobservables, we have not pursued this approach further. [10]
The difference in outcomes between firms with and without GPT skills on their board is also evident, though the former no longer shows a significant increase. Removing mining firms, which may have very different technology needs, also does not change the results (Figure I1). [11]
We can't rule out the possibility that the nature of the early and late adoptions differed substantially. For example, early adoptions may have been larger investments, more experimental and more disruptive. They may also have had positive spillovers or greater upside risk in terms of skills formation, learning by doing or pushing the knowledge frontier forwards. Nevertheless, the evidence suggests that more recent adoptions were easier to turn into profit (or at least to avoid a loss), even if this simply reflected the potentially less ambitious nature of these adoptions. [12]
That said, many cloud technologies have in-built AI/ML features. For example, Loucks (2018) estimates that around 70 per cent of firms that adopt AI capabilities will do so via cloud-based enterprise software. As such, we should be cautious in examining the technologies separately. [13]
While we control for size in our baseline regressions, we do not allow the effect of adoption to vary by size. [14]
Sample size of across subgroups is broadly comparable, so the results do not simply reflect very small sample sizes in some sub-samples of the data. [15]
Those for whom we cannot see a job advertisement in the year are not considered. [16]
We explored whether firms that have placed job advertisements for GPT-skilled workers are more likely to increase profitability post-adoption. There is no evidence of a significant difference. In part this may reflect a lack of information on the stock of workers. For example, firms may already have skilled workers, and not need to hire. Further work could look to incorporate information on the stock of workers to better consider this question. [17]
Results are quite similar if we match the earlier specification periods exactly. However, we preferred this sample given the pooling of past periods in this specification. [18]