Inflation and its Measurement
Download the complete Explainer 169KBHow is Inflation Measured?
Inflation is an increase in the level of prices of the goods and services that households buy. It is measured as the rate of change of those prices. Typically, prices rise over time, but prices can also fall (a situation called deflation).
The most well-known indicator of inflation is the Consumer Price Index (CPI), which measures the percentage change in the price of a basket of goods and services consumed by households.
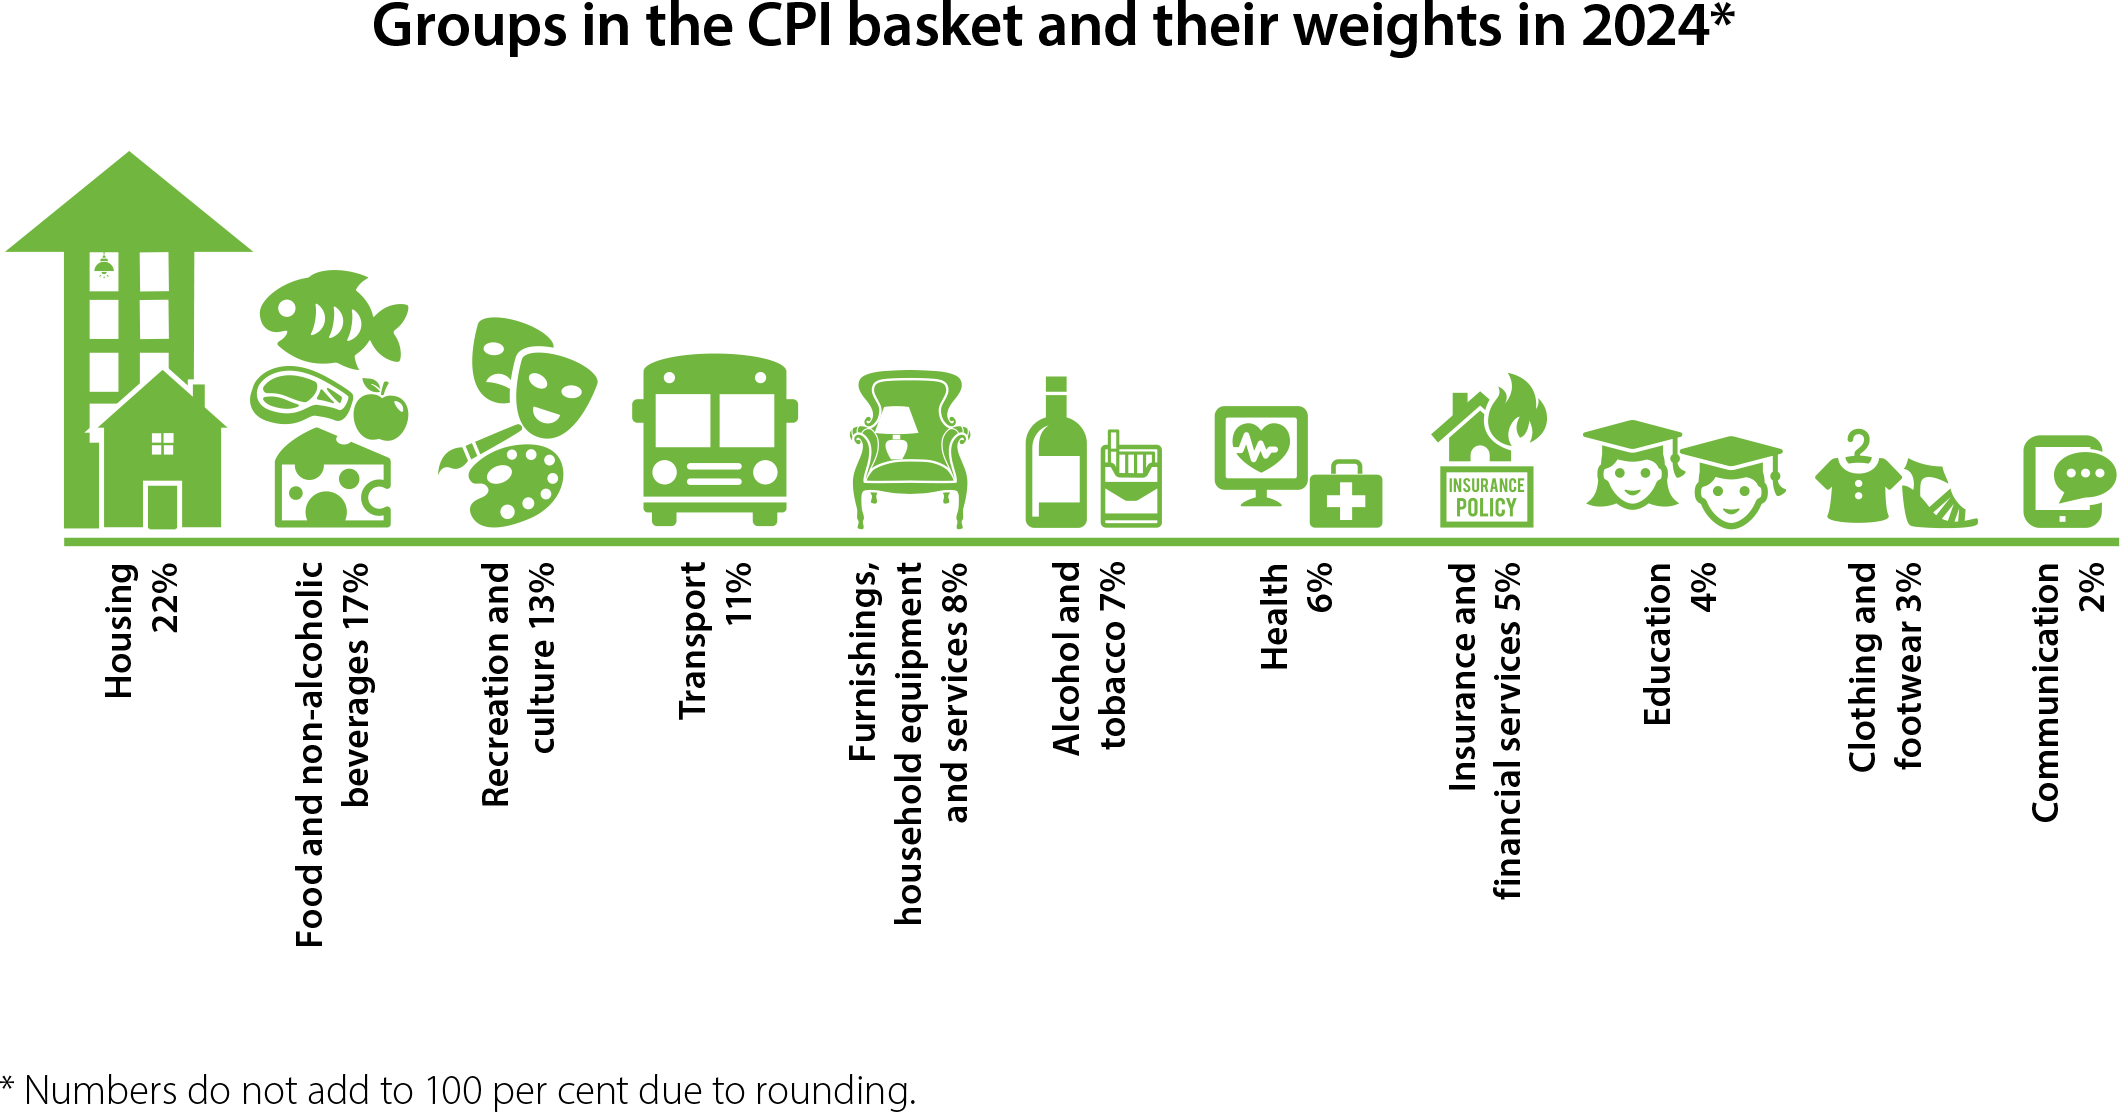
In Australia, the CPI is calculated by the Australian Bureau of Statistics (ABS) and published once a quarter.[1] To calculate the CPI, the ABS collects prices for thousands of items, which are grouped into 87 categories (or expenditure classes) and 11 groups. Every quarter, the ABS calculates the price changes of each item from the previous quarter and aggregates them to work out the inflation rate for the entire CPI basket.

Box: Calculating Inflation – An Example
To better understand how inflation is calculated we can use an example. In this example we calculate inflation for a basket that has two items in it – books and childcare. The formula for calculating inflation for a single item is below.

The price of a book was $20 in 2016 (year 1) and the price increased to $20.50 in 2017 (year 2). The price of an hour of childcare was $30 in 2016, and this increased to $31.41 in 2017.
| Items | 2016 | 2017 | Inflation |
|---|---|---|---|
| $20 | $20.50 | 2.5% | |
| $30 | $31.41 | 4.7% |
Using the formula, inflation for each of the individual items can be calculated.
- For books, annual inflation was 2.5 per cent
- For childcare, annual inflation was 4.7 per cent
To calculate inflation for a basket that includes books and childcare, we need to use the CPI weights that are based on how much households spend on these items. Because households spend more on childcare than books, childcare has a greater weight in the basket. In this example, childcare accounts for 73 per cent of the basket and books account for the remaining 27 per cent. Using these weights, and the change in prices of the items, annual inflation for this basket was 4.1 per cent – calculated as (0.73 x 4.7) + (0.27 x 2.5).
How Are Prices Collected?
The ABS collects prices from a wide range of sources, such as retailers, supermarkets, department stores and websites where households shop. It also collects prices from government authorities, energy providers and real estate agents. For some items, the ABS has access to data that allows it to record prices frequently. For example, scanner data from supermarkets give information about the price and number of items a consumer buys in one transaction. For other items, the ABS records prices either monthly, quarterly or annually. In total, the ABS collects around one million prices each quarter.
How Is the CPI Basket Chosen?
In deciding which goods and services to include in the CPI basket and what their weights should be, the ABS uses information about how much – and on what – households in Australia spend their income. If households spend more of their income on one item, that item will have a larger weight in the CPI. For example, the ABS included smart phones in the CPI to reflect consumers taking advantage of advances in technology. Data on household spending across all items is only available approximately every five years or so.
Underlying Inflation
While Australia's inflation target is expressed in terms of CPI inflation – known as ‘headline inflation’ – it can also be useful to look at indicators of ‘underlying’ inflation. These indicators exclude items that have particularly large price changes (either frequently or in a given period). Large price changes can often be due to temporary factors, which are sometimes unrelated to broad conditions in the economy. For example:
- Supply disruptions because of unusual weather: For example, in 2006 Tropical Cyclone Larry destroyed banana crops in Queensland. As a result of this significant reduction in supply, the price of bananas temporarily increased by 400 per cent.
- Infrequent changes in tax regulations: For example, the introduction of the 10 per cent goods and services tax (GST) in mid 2000 caused the prices of many items to increase (the Reserve Bank typically shows headline CPI inflation excluding the effects of these tax changes).
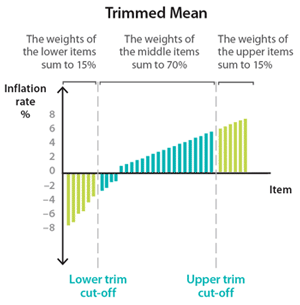
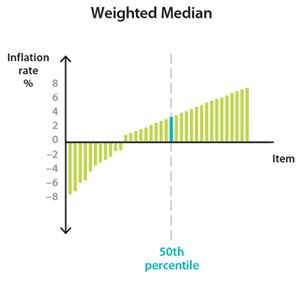
In contrast, price changes for a broad range of items may indicate a shift in economic conditions. The Reserve Bank may decide to respond to this by changing cash rate target (see Explainer: Australia's Inflation Target). In Australia, the most important indicators of underlying inflation are the trimmed mean and the weighted median (see Box: Calculating the Trimmed Mean and the Weighted Median).
The ABS also calculates the CPI excluding volatile items, which is the average inflation rate of all items in the CPI basket except for fruit, vegetables and fuel. Prices of fruit, vegetables and fuel are usually very volatile because they are often affected by supply disruptions, such as unusual weather, or changes in how much oil is supplied to the world market. The CPI excluding volatile items always removes the same items, while the items that are removed from the trimmed mean and weighted median can change each quarter, depending on which items had particularly large price changes.

Box: Calculating the Trimmed Mean and the Weighted Median
To calculate the trimmed mean and the weighted median, all 87 items are ordered by their quarterly, seasonally adjusted price change. (Seasonal adjustment means that price changes have been adjusted for increases or decreases that always occur at a particular time of year; for example, high school fees typically increase in the March quarter, so an adjustment is made to spread this out over the year.)[2]
Limitations of the CPI
CPI is not an indicator of the price level
The CPI measures the rate of price changes in the economy, but not the price level. If the price index of bread is 140 and the price index of eggs is 180, it does not mean that eggs are more expensive than bread. It only means that the price of eggs has increased by more than the price of bread from a particular point in time.
Coverage
For practical reasons, the CPI measures price changes of items in the metropolitan areas of Australia's eight capital cities (where around two-thirds of Australian households live). It does not measure price changes in regional, rural or remote areas. The CPI also does not take into account the differences in spending patterns between individual households. Households are very different and some may spend a lot more on a certain items than others. For example, cars have a weight of almost 3 per cent in the CPI basket, but not every household owns a car.
Quality changes
The CPI intends to only calculate pure price changes. This means the CPI should ignore price changes that result from variations in the quality of items. The quality of items in the basket can vary and new products can be introduced. For example, a bag of pasta can become smaller in weight, or the quality of a mobile phone can improve if its camera is upgraded.
The ABS tries to remove any price changes that result from changes in quality or the mix of items that households buy. Continuing with the previous examples, the ABS would calculate the price of the pasta assuming that the weight remained the same, and compare it with the price in the previous quarter. Calculating the increase in the price of a mobile phone due to the improved camera is more difficult, because there is often limited information about how much the price of the phone has changed because of the better camera. In this case, the ABS would need to estimate the price impact of the improved camera and adjust the mobile phone price. Because the adjustment is only an estimate, it can result in under or overestimation of the pure price change. Services are particularly difficult to quality-adjust because changes often occur slowly and it is hard to measure by how much the service has improved. For example, better x-ray technology at a hospital could better detect injuries, but it is difficult to calculate how much the improvement in detecting injuries is worth. In those cases, it can lead to quality being only partly accounted for or not at all.
Substitution bias
The CPI is affected by ‘substitution bias’. This is because the CPI does not adjust for changes in household spending patterns very often (as identifying such changes for all households is a major undertaking). In reality, households frequently change the amounts they spend on items. For example, if lamb prices rise by more than beef prices, households might adapt and buy more beef and less lamb. Not accounting for this type of substitution in expenditure results in too much weight being given to lamb in the CPI basket and too little weight given to beef. This increases (or biases) the CPI compared with an index that accounts for households substituting from relatively more expensive items to relatively cheaper ones. In the past, updates to the CPI basket have taken place every 5 or 6 years, and from late 2017 onwards, the ABS started updating the CPI weights on an annual basis, which will help reduce the substitution bias in the CPI.
New products
The CPI does not include new products as soon as they appear on the market. It can often take some time until the ABS includes them in the CPI basket. This typically occurs once a product has reached a high enough market share and is available to most households.
Cost of living
The CPI is often used to measure changes in the cost of living, but it is not an ideal indicator of this. While the CPI measures price changes, cost-of-living inflation is the change in spending by households required to maintain a given standard of living. The ABS publishes other indexes that aim to provide a better indicator of the cost of living.
Footnotes
From 29 September 2022, the ABS commenced publication of a monthly CPI indicator. The monthly CPI indicator provides a timelier read on inflation in Australia using updated prices for around two-thirds of the CPI basket each month. The quarterly CPI remains the principal measure of inflation in Australia. See the ABS Information Paper ‘Introducing a monthly Consumer Price Index (CPI) indicator for Australia’ for more information. [1]
The ABS also produces a seasonally adjusted version of the monthly CPI indicator and a monthly trimmed mean. See ‘Monthly Consumer Price Index Indicator’ for more information. [2]

